Ground Penetrating Radar: The Electromagnetic Signal Attenuation and Maximum Penetration Depth
Abstract
The use of high frequencies limits the penetration of the radar energy; this low penetration depends, at a parity of used frequencies, on the electromagnetic properties of the investigated material. The principal drawback is the elevated sensibility of the system to the variations of the EM properties of the environment immediately surrounds the antennas. The radar signals that arrive at the receiving antenna are attenuated and modified because of the selective absorption of the pulses by the ground, because of geometrical spreading, and because of an alteration of the actual amplitude due to the instrument amplification. In this paper, the absorption of the radar signal is taken into consideration and we determine, respectively, (i) the radar signal attenuation in the ground, (ii) the electrical conductivity (σ) and the relative dielectric permettivity (RDP) of the ground, and (iii) the maximum penetration depth of GPR in the ground.
1. Introduction
The maximum penetration depth of GPR in the ground is commonly unknown among GPR users because the propagation of the electromagnetic signal depends on the electrical properties of the particular soil at hand. The electrical conductivity of the materials crossed by the EM waves introduces significant absorptive losses, which limits the penetration depth into earth formations and is primarily dependent on the water content and mineralization present. Few studies describe efficient GPR techniques for determining the radar energy attenuation, the relative dielectric permittivity, and the electrical conductivity [1–4]. Several studies, instead, describe efficient laboratory techniques for determining these parameters [5–8].
We present a method to determine the radar energy attenuation directly from the radar sections acquired in the field. The knowledge of the radar energy attenuation is important to identify electrical properties of different materials in the ground (in particular, relativity dielectric permittivity (RDP) and electrical conductivity) and to determine the maximum penetration depth of GPR in the ground. To determine the attenuation of the radar, energy has been necessary to find the true value of the radar signal amplitudes. In order to determine the true amplitude of the radar energy, a technique that allows to remove the gain values from the traces and to correct them for the geometrical spreading has been implemented.
The value of the attenuation of the radar energy has been used to calculate both conductivity and RDP. The value of the electrical conductivity calculated with this method has been compared with the value calculated in laboratory on samples of the same material. The values are in good agreement.
The knowledge of both electrical conductivity and RDP allows calculating the total propagation loss (TPL) [1]. This parameter allows calculating the maximum penetration depth of the GPR in the ground.
In the following, we describe the theory elaborated to determine the radar energy attenuation and demonstrate its effectiveness with an example.
2. Background Theory
GPR offers, under favourable conditions, a simple and fast method to provide valuable information on shallow subsurface areas. As said, GPR is an electromagnetic (EM) method similar in principle to the seismic reflection technique, except that it is based on the propagation and reflection of EM waves rather than elastic waves. EM wave propagation is governed by Maxwell’s equations, and most geological media are mainly influenced by the RPD and electrical conductivity (σ), whereas the influence of the relative magnetic permeability is generally negligible. These parameters affect both wave propagation velocity (ν) and radar energy attenuation (α).
- (i)
a = antenna aperture;
- (ii)
c = 3 × 10⁸ m/s (velocity of electromagnetic waves in vacuum);
- (iii)
f = radar signal frequency;
- (iv)
PD = maximum probe depth;
- (v)
A = the absorption loss in decibels per meter = 8.69α dB/m.
3. Instrumentation
The instrumentation employed in this work is constituted from the SIR System-2 by Geophysical Survey Systems, Inc. (GSSI, NH, USA).
The tool is a complete digital control with 16 MB of RAM and 450 MB of hard disk.
- (1)
input 12 V (DC);
- (2)
performance figures (PFs) 160 (dB);
- (3)
range from 15 nanoseconds to 2000 nanoseconds;
- (4)
frequency of automatic transmission 64 (kHz) (it is the frequency of repetition of the impulse);
- (5)
automatic sampling or manual to 128, 256, 512, 1024, or 2048 champions/trace;
- (6)
conversion A/D 8 or 16 (bit);
- (7)
dynamic range 150 dB.
- (a)
antenna with central frequency of 35 MHz [monostatic] (Radar Team SUBECHO-40);
- (b)
antenna with central frequency of 100 MHz [monostatic] and [bistatic] (GSSI models 3207 with impulse amplitude by 10 nanoseconds);
- (c)
antenna with central frequency of 200 MHz (GSSI models 3205 3 nanoseconds);
- (d)
antenna with central frequency of 500 MHz [monostatic] (GSSI models 3102A 2 nanoseconds);
- (e)
antenna with central frequency of 1000 MHz (GSSI models 3101D 1.1 nanosecond).
4. Calculus of the Attenuation
The radar antenna is assimilable, at first approximation, to an oscillating dipole that radiates spherical waves.
The amplitude of the wave that propagates in the ground suffers, therefore, a geometric attenuation (geometrical spreading) due to the distribution of the energy on the front of spherical wave.
At great distances from the source, it is possible to use the approximation of plain wave and, therefore, to use (1) for the attenuation.
One of the goals of this work is to estimate the attenuation directly from the radar traces.
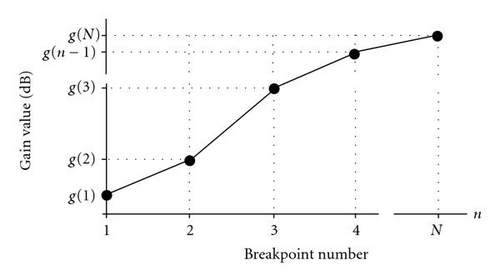
Before studying the radar energy attenuation, it is, therefore, necessary
- (i)
to remove the gain from the radar traces;
- (ii)
to correct the amplitude for the geometrical spreading.
The correction for the geometrical spreading is done by multiplying the nonamplified radar traces by 1/G(t).
The test was carried out in continuos mode using an antenna with central frequency of 1000 MHz.
Data were collected over a calcarenite block of 20 cm of thickness for 60 cm of length set on two supports to 10 cm of height from the surface of the floor.
To put into evidence, the lower surface of the calcarenite block has been set a metal foil under calcarenite block (Figure 2).
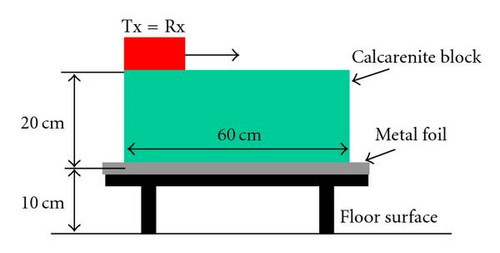
The acquisition parameters are
- (i)
time range 8 nanoseconds;
- (ii)
samples number 512;
- (iii)
gain point 4;
- (iv)
gain values [7, 11, 20, 26] dB.
The resulting radar section is shown in Figure 3.
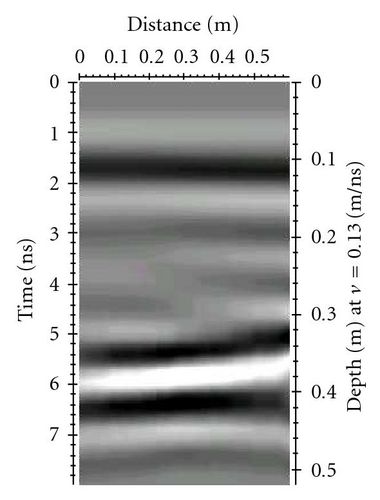
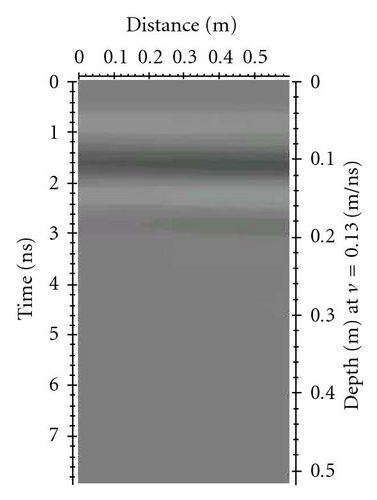
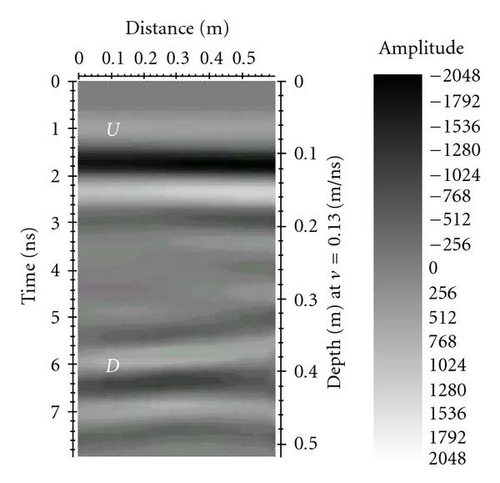
The reflections derived from the upper and lower surface of the calcarenite block are observed in correspondence of 2 nanoseconds and 5 nanoseconds, respectively.
- (1)
gain remove from the raw radar section;
- (2)
correction for the geometrical spreading (using the value of v previously determinate).
The U letter in Figure 3(c) points out the value of A0. The D letter in Figure 3(c) points out the value of A(t) (that represents the lower surface of the calcarenite block).
The value of the radar energy attenuation has been determined as average value of the amplitude in all points of the U and D lines (Figure 3(c)).
Using a silver mix, the extremities of the sample have been connected to the voltage generator.
Both the current that passes through the sample and the voltage on its sides were measured .
We have, therefore, decided to apply this technique on the data acquired in the field.
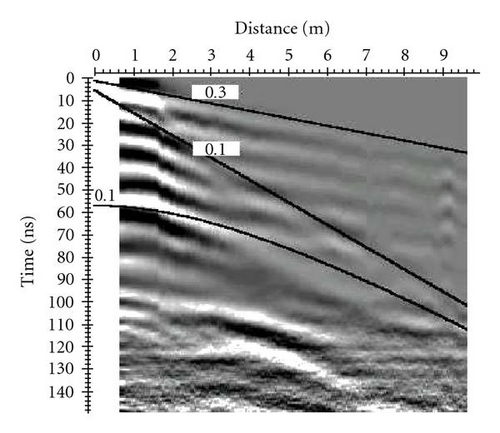
A raw radar section relative to a wide-angle refraction reflection (WARR) profile is considered (Figure 4(a)).
- (i)
time range 150 nanoseconds;
- (ii)
samples number 512;
- (iii)
gain [13, 12, 25, 48, 56, 67, 71] dB;
- (iv)
the antennas come to move of 0.2 m turned for time.
In Figure 4(a), several waves are visible. These waves are the direct air wave, the ground wave, and the reflected wave. From all these waves, the ground wave can best be used for wave velocity determination, as its propagation path and the transmitter-receiver spacing are known. We have been estimated a ground wave velocity by 10 cm/ns.
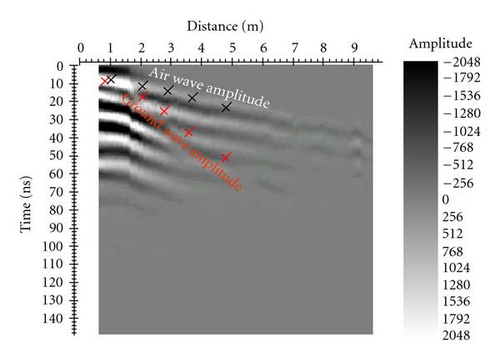
There are some theoretically derived facts about the behaviour of the ground wave. The amplitude of the ground wave decays faster (prop. 1/r2), with distance. The amplitude of the ground wave increases in regard to the air wave. On the base of these considerations, we have been determined the radar energy attenuation.
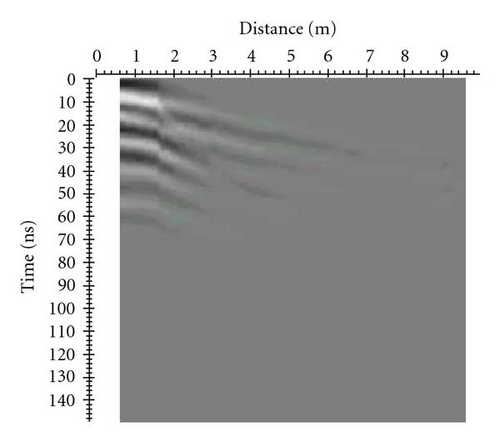
The necessary passages for the radar energy attenuation are shown in Figure 4.
After effecting the operations of ungain (Figure 4(b)) and correcting for the geometrical spreading of the radar signal (Figure 4(c)), we have determined the radar energy attenuation comparing the values of the ground wave amplitude in the red crosses with the value of the air wave amplitude (first cross). In fact, all these points represent the radar energy that has travelled in the ground and that has been received from the receiving antenna.
5. Total Propagation Loss and Maximum Penetration Depth
In order to evaluate the GPR maximum penetration depth in the survey area, the both the radar energy attenuation and the attenuation due to the instrumentation must be esteemed.
- (i)
PF has been furnished by the builder (160 dB in air);
- (ii)
f represents the frequency of centre band of the used antenna (100 MHz);
- (iii)
PD is the depth of penetration (unknown);
- (iv)
a2 is the real area of the antenna (unknown);
- (v)
L is the constant of attenuation (L = 8.96 α/f) [1].
In this case, radar energy attenuation term in the ground in (22) is equal to zero. Unfortunately, in (22), there are two unknown terms PD and a2.
Once esteemed the values of a2, that they depend on the antenna, it is possible to esteem TPL in the ground if we have information on the attenuation alfa.
Using the radar energy attenuation value estimated in (18), we have Table 1.
| Antenna frequency (MHz) | Antenna model | Antenna time range (nanosecond) | a (m) | TPL (dB) |
|---|---|---|---|---|
| 1000 | HS | 20 | 2.84 × 10⁻⁴ | 82.7 |
| 1000 | TAD | 15 | 2.29 × 10⁻⁴ | 82.4 |
| 1000 | TAS | 8 | 1.43 × 10⁻⁴ | 81.7 |
| 500 | D | 100 | 0.0011 | 74.8 |
| 200 | D | 300 | 0.0032 | 63.1 |
| 200 | S | 150 | 0.0019 | 62.1 |
| 100 | D | 500 | 0.0056 | 53.8 |
| 100 | S | 250 | 0.0034 | 53 |
| 35 | LF120CM | 500 | 0.0073 | 54.9 |
| 35 | LF240CM | 1000 | 0.0123 | 54 |
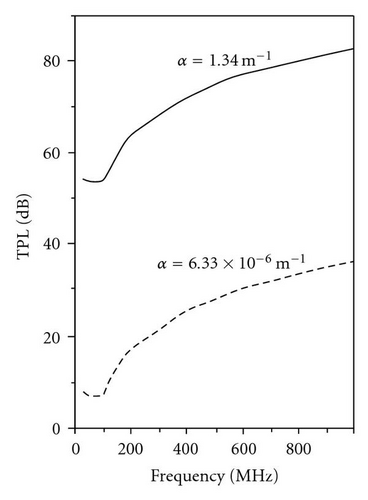
Using both the attenuation values (12) and (18), we get the graph of Figure 5, which represented TPL against antennas frequency. It is important to note that, obviously, TPL decreases with the frequency increase.
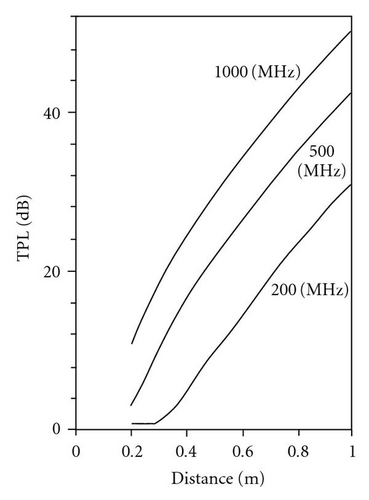
Using the attenuation value (18), we get the graph of Figure 6, which represented TPL against depth penetration (PD) in a range of depth (0–1) m for antennas with elevated value of centre band, usually used for investigating small thickness.
A general graph for all antennas used in the field surveys has been represented in Figure 7.
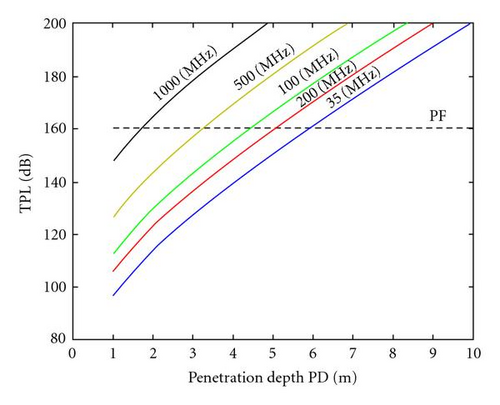
The figures underline the limits (for the penetration depth) associated to both instrumentation and ground.
It is important to note that the maximum depth of penetration is about 6 m (Figure 7) with the antenna by 35 MHz. In fact, the radar sections surveyed in the same site, which has been surveyed the WARR profile of Figure 4, show a strong attenuation of the signal in correspondence of 6 m of depth.
6. Conclusions
Since the applications of the GPR depend on the electrical property of the ground, we have focused our attention on the attenuation of the signal and on the EM propagation velocity for having information on the parameters (RDP) and σ that characterised the materials in the ground.
To estimate the attenuation, it is necessary both to remove the gain from all traces and to correct for the geometrical spreading in order to have the true amplitude of the radar signal. The electrical conductivity value of σ of the calcarenite block has been compared with the electrical conductivity value estimated by with independent laboratory tests, on a small sample of the same material. The two values are in good agreement.
The technique to determine the radar energy attenuation has been, subsequently, applied on the radar section acquired in the real site and, also in this case, the comparison between the value of σ estimated from this radar section and that estimated from a geoelectrical survey has given satisfactory results.
In the final part of the paper, we have assembled our attention on the intrinsic characteristics of the instrumentation that contribute to the attenuation of the signal.
The acquaintance of these parameters, together with the attenuation α, allows calculating the total propagation loss (TPL) for the survey site.
The acquaintance of α and v has allowed working out the parameters RDP and σ.
The acquaintance of the TPL is important because it allows determining the maximum depth of penetration for each type of antenna and, therefore, to select the more proper antenna to use for the next surveys (in the same zone) according to the purposes of the investigation at hand.


