Salmonine Consumption and Competition for Endemic Prey Fishes in Bear Lake, Utah–Idaho
Present address: Oregon Department of Fish and Wildlife, 211 Inlow Hall, Eastern Oregon University, One University Boulevard, La Grande, Oregon 97850, USA.
Abstract
Two principal sport fish—the indigenous Bonneville cutthroat trout Oncorhynchus clarki utah and the introduced lake trout Salvelinus namaycush—are the dominant piscivores in Bear Lake, a 282-km2 oligotrophic system. These piscivores rely predominantly on four endemic prey fish species that make up a major portion of the unique Bear Lake fish assemblage. We estimated the annual biomass of pelagic and benthic prey fish by using hydroacoustic and trawling techniques. We also estimated the lakewide abundance of piscivores with a multiple mark–recapture survey and used a bioenergetics model to compare the population-level consumption of prey fish with prey fish production. Prey fish biomass declined to a minimum during 1991 and 1992 but subsequently recovered to reach maximum levels during 1994 and 1995. The proportion of maximum ration estimates from model simulations indicated that the piscivores were consuming well below maximum rations during a period when predation exceeded prey fish production, thereby providing the potential for a predator–prey imbalance. Predation impacts by lake trout cohorts were prolonged because of high survivorship and long life expectancy. Although cutthroat trout outnumbered lake trout, the larger, more piscivorous size-classes of cutthroat trout accounted for only 12.5% of their population. This information, combined with overlapping diets and declining condition factors at increased piscivore biomass, also indicates that lake trout may be competing with cutthroat trout during periods of low prey fish resources. Lake trout predation on juvenile cutthroat trout, combined with competition with other age-classes, also contributes to the poor survival of cutthroat trout. Although prey fish abundance appears to be largely influenced by bottom-up factors related to water elevation, lake trout exert a decoupled predatory threat to the endemic prey fish populations and have the potential to suppress endemic fishes during unpredictable periods of poor prey fish production.
Introduction
In Bear Lake, Utah–Idaho, an indigenous fish assemblage with four endemic species has evolved as part of the Lake Bonneville watershed (Nielson and Lentsch 1988). The Bear Lake population of Bonneville cutthroat trout Oncorhynchus clarki utah evolved as the dominant piscivore in this unique system. Beginning in 1911, lake trout Salvelinus namaycush have been periodically introduced to supplement the sport fishery (Crossman 1995) and now consume the endemic prey fish along with cutthroat trout. Within the past decade, the populations of these two piscivores have been enhanced substantially by stocking programs. Because the majority of their prey fish resources consists of endemic fishes, there is now concern that increased piscivory will adversely affect the unique Bear Lake fish assemblage.
Other changes in the Bear Lake ecosystem also threaten the long-term preservation of the indigenous fish assemblage. Earlier this decade, drought conditions coupled with water withdrawals from the lake and its tributaries drastically reduced water levels. Low water conditions nearly eliminated natural reproduction by cutthroat trout and exposed much of the shallow-water substrates used as spawning habitat by the endemic prey fishes (Bouwes and Luecke 1997; Ruzycki et al. 1998). During this same period, prey fish abundance was extremely low compared with other years for which we had data (Wurtsbaugh and Luecke 1998).
Balancing the demand and supply of prey fishes is crucial for the long-term stability of aquatic communities (Ney 1990), and the principal factor regulating piscivore survival and growth in lakes and reservoirs is prey fish supply (Ney and Orth 1986). When predators are introduced and sustained through stocking programs, their populations become decoupled from the numerical dynamics of their prey resources (Kitchell and Crowder 1986). Because predator reproduction is no longer regulated by prey fish supply, natural feedback loops are unable to regulate predatory demand. Currently, salmonine populations in Bear Lake are sustained almost exclusively through artificial propagation (Hassler et al. 1986). Without feedback to regulate predators, prey and predator populations may fluctuate at unnatural levels. When prey populations are composed of endemic species with extremely limited distributions, the consequences of these fluctuations become increasingly important because of the risk of extinction.
We saw some evidence that lake trout were competing with cutthroat trout in Bear Lake for the limited, endemic prey fish population. During 1990–1992, when prey fish biomass was very low, both piscivores showed declining trends in condition. When lake trout demonstrated strong year-classes, cutthroat trout recruitment appeared poor and cutthroat trout size-classes appeared to be replaced by similar-sized lake trout. Because piscivorous cutthroat trout during the early 1990s appeared to be relatively rare and in poor condition in comparison with their status in years when prey fish were more abundant, and because piscivorous lake trout during this same period were common, we hypothesized that lake trout were competing with cutthroat trout for the limited prey fish resources.
Bioenergetics models have become important tools for quantifying trophic supply and demand (Ney 1990). These models have been used successfully to estimate the predatory impacts of salmonines (e.g., Kitchell and Crowder 1986; Stewart and Ibarra 1991; LaBar 1993), to estimate management effects (e.g., Luecke et al. 1994; Negus 1995), and to estimate food consumption (e.g., Kitchell and Hewett 1987; Yule and Luecke 1993). More specifically, the bioenergetics modeling approach has been used to investigate predator–prey imbalances in salmonine-dominated fisheries. For example, Stewart et al. (1981) predicted the decline of prey fishes from the overstocking of salmonines in Lake Michigan; later evidence substantiated this prediction (Kitchell and Crowder 1986). By matching sport fish consumption with prey fish production in Bear Lake, the long-term sustenance of this unique fish community can be enhanced.
Predatory demand by a population is the product of the consumption by representative individuals and the number of individuals in the population. Although extremely valuable data, fish population sizes in large lakes are often difficult to estimate. Population estimates not only allow estimation of the consumption demand on the prey fish populations, they also are crucial for future management of exploited fish stocks. Moreover, stocking, exploitation, and species introductions increase the need for accurate population estimates because of the decoupling of predator and prey dynamics. This lack of population data has hindered decisions regarding management of the Bear Lake fishery.
We hypothesized that lake trout predation was adversely affecting endemic prey fish resources and that introduced lake trout were competing with cutthroat trout for the limited endemic prey fish biomass in Bear Lake. Our objectives in the present study were (1) to estimate the abundance of piscivorous size-classes of both lake trout and cutthroat trout; (2) to estimate the annual changes in biomass of principal endemic prey fishes; (3) to quantify the predatory effects of salmonine piscivory on the endemic prey fish assemblage; and (4) to quantify predatory and competitive interactions among the introduced lake trout and indigenous cutthroat trout.
Methods
Study site
Bear Lake is located in northeast Utah and southeast Idaho (Figure 1). It is a 282-km2 lake 1,805 m above sea level, with tilt-block morphometry, a maximum depth of 63 m, and a mean depth of 28 m. The lake is typically dimictic, with summer surface temperatures reaching 19–21°C and bottom temperatures remaining at 3–5°C year-round (Lamarra et al. 1986). The lake is also oligotrophic, with mean summer epilimnetic chlorophyll concentrations near 0.5 μg/L (Lamarra et al. 1986; Moreno 1989). At the north shore, a canal and pumping facility connect the lake with the Bear River; this allows some manipulation of the water level for downstream irrigation and hydroelectric power generation.
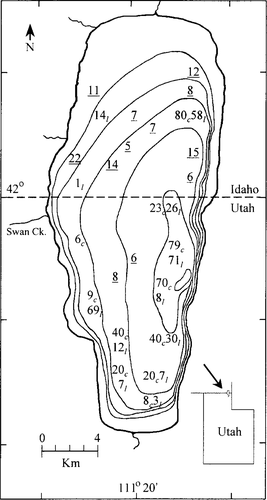
Map of Bear Lake showing the numbers of and locations where cutthroat trout (subscript c) and lake trout (subscript l) were captured and released during the mark–recapture survey. Underlined values indicate cutthroat trout that were released away from their capture location. Contour intervals = 10 m
Cutthroat trout populations are primarily maintained by annual stocking of 150–250-mm-long age-1 fish. Naturally produced cutthroat trout represent approximately 10% of the angled fish (S. Tolentino, Utah Division of Wildlife Resources, personal communication). Lake trout are also artificially maintained, although stocking has been less regular. Several large cohorts of lake trout stocked in 1986–1988 have dominated the lake trout fishery for a decade. Four endemic species, Bear Lake sculpin Cottus extensus, Bonneville cisco Prosopium gemmifer, Bonneville whitefish P. spilonotus, and Bear Lake whitefish P. abyssicola, sustain the salmonine sport fishery. Bonneville whitefish are also predators of small fishes but are not included in our estimates of the salmonine population. Other common fishes in Bear Lake include Utah sucker Catostomus ardens, speckled dace Rhinichthys osculus, Utah chub Gila atraria, and the nonnative common carp Cyprinus carpio.
Piscivore abundance
Sizes of the lake trout and cutthroat trout populations were estimated by using a multiple mark–recapture approach. Given the duration of the tagging and recapture effort, some immigration and emigration of both modeled populations occurred from stocking, natural recruitment, mortality, and angler harvest. We therefore used a Jolly–Seber mark–recapture method, which allows for an open population by accounting for losses and gains (Jolly 1965; Krebs 1989). To perform the calculations, we used a computer model program (Pollock et al. 1990) that allowed data input in tabular format. Input parameters included number of capture periods, interval (days) between capture periods, number of marked and unmarked individuals captured in each period, total number of individuals captured, and total number of individuals released. Mark and recapture efforts began on November 1992 and continued through March 1995. Each model year was apportioned into 3–4-month periods chosen to maximize the number of model days between each of the major sampling efforts. Model output included a population estimate for each period. Means and 95% confidence intervals for the combined periods were calculated to obtain a single population estimate for the sample period.
To mark fish and minimize size biases from our sampling gear, we used several techniques to capture the fish, including gill nets, angling, and bottom trawls. Gill-net mesh sizes varied from 10 to 31 mm bar measure and primarily captured piscivores by entangling their teeth or mandibles. Most gill nets were tended twice daily to reduce the amount of time the captured fish were restrained. We angled with trolling gear during June through November at various water depths over several depth strata. During winter months other angling techniques with various methods and terminal tackle were also used. Throughout 1993–1994 we also tagged fish that were captured incidentally to our bottom trawl survey of prey fishes. For all capture methods, only fish that visually appeared uninjured were tagged, and those that did not swim vigorously away from the boat were quickly recaptured and not allowed to return to the population.
Although our sampling was conducted throughout the lake at 18 established sampling sites, our efforts were not distributed equally among sites; more effort was expended at the locations that produced higher catch rates. To increase the random distribution of the marked population, some of the marked cutthroat trout were transported away from their capture site to locations where we expended less effort (see Figure 1). We also relied on the mobility of tagged fish and the distribution of the public angling effort to ensure a spatially distributed recapture effort.
Fish were marked by inserting an external dart tag (Hallprint Pty. Ltd.) at the left posterior base of the dorsal fin. Each tag was individually numbered and printed with a return address that included a $5.00 reward statement to increase the probability of tag returns from anglers. Also included in the population estimate were fish tagged by the Utah Division of Wildlife Resources (UDWR) during 1992–1994. They captured fish by gillnetting and angling and trapped spawning fish as they entered spawning tributaries. These fish were marked with the same type of tag as the reward tags but were labeled with a statement for their return to the UDWR office at Bear Lake. These tags did not include a reward statement but were thought to be returned at the same frequency as the reward tags.
Several methods of recapture, including the above-mentioned techniques, were used to sample the population for tagged (marked) individuals. In addition to our gill-netting and angling methods, we also included fish recaptured during the UDWR's piscivore monitoring program. This monitoring program included gill nets that were set three times each year near a central lake location. Six 38 m long × 1.8 m deep nets were set at 6 depths (5, 10, 15, 20, 25, and 35 m) on two consecutive nights (Nielson and Tolentino 1996). Mesh sizes on each net ranged from 13 to 51 mm bar measure. A spawning trap for cutthroat trout was also operated by the UDWR on Swan Creek, a major remaining spawning tributary (Figure 1). The majority of fish migrating up this tributary during the spring spawning run were intercepted and examined for marks. Recapture data were also obtained from the tags returned by the angling public. Angler return rates were set at 85% of the total of creeled tags (Luecke et al. 1994). The total number of fish examined for marks by anglers (creeled) was estimated by using an expanded annual creel census (Neuhold and Lu 1957).
Piscivore mortality rates and age-class abundance
To estimate mortality rates of cutthroat trout at ages 2 to 10 and of lake trout at ages 4 to 20, we used a catch curve technique (Gulland 1983; Van Den Avyle 1993) with the UDWR standardized gill-netting data from 1986 to 1994. Size-at-age for cutthroat trout was taken from Nielson and Lentsch (1988). This dataset was based on the identification of individual year-class markings by using fluorescent grit and unique fin clips. Size-at-age for lake trout was determined from the identification of 240 individuals from a marked cohort that were recaptured and measured for length at various times in the 20 years since they were stocked in 1973 (Bryce Nielson, UDWR, unpublished data).
Our mark–recapture estimate provided an abundance for fish vulnerable to our capture methods but did not provide an accurate age structure for this population. The age distribution of the two piscivores was therefore estimated by applying the average annual mortality rate to the estimated abundance of the whole-lake populations. After annual mortality rates were applied to each age-class to determine relative age-class composition, the initial age-class sizes were adjusted so that summation of all age-classes equaled the mark–recapture abundance estimate. A cutoff of four individuals was used to define the oldest age-classes. The youngest age-classes were determined by the smallest individuals commonly captured in our sampling. This minimum cutoff was about 300 mm total length (TL) for age-2 cutthroat trout and 400 mm TL for age-4 lake trout.
Piscivore growth rates
A von Bertalanffy growth equation was fit to the size-at-age datasets by using least-squares linear regression as described by Gulland (1983). Maximum total length (TL∞) was estimated mathematically by calculating the x-intercept of the regression of annual increment as a function of TL (mm), and growth rate in TL (K) was estimated from the slope of this line. Total lengths were determined for each of 13 age-classes (ages 2 to 14) for cutthroat trout and 22 age-classes (ages 4 to 25) for lake trout. Length-at-age for cutthroat trout was adapted from Nielson and Lentsch (1988). When these data were used to set maximum body size for cutthroat trout, however, the maximum TL of 525 mm was unrealistically low compared with the lengths of the specimens we captured. We instead set maximum body size as the mean of the six largest fish captured over an 8-year period (1988–1995). Total lengths were converted to wet mass (g) by using regression equations established from fish captured during the mark–recapture effort (see below).
Piscivore feeding habits
Cutthroat trout and lake trout diets were collected from June 1993 through May 1994. Fish captured in healthy condition were anesthetized with tricaine methanesulfonate (MS-222) and their stomach contents were removed by gastric lavage. Fish that had died were placed on ice and their stomachs were removed whole for later analysis. Prey items were identified and separated by taxon, blotted dry, and weighed as aggregated proportions. When possible, partially digested fish prey items were identified by external body or bone morphology. For model simulations, diet composition was calculated as seasonally aggregated percentages by wet weight. Seasons were delimited as follows: winter, December–February; spring, March–May; summer, 1 June–15 September; and autumn, 16 September–November. Because of small sample sizes (a result of the many piscivore stomachs that were empty), we combined our data with the 1987 diet analysis estimates of Wurtsbaugh and Hawkins (1990) by weighting each entry as a proportion of the entire sample.
Piscivore thermal history
The thermal history of the four modeled size-groups of piscivores was partially estimated by using the seasonal depth distribution from the relative catches in our gill nets. This depth distribution was then converted to temperature by using monthly vertical temperature profiles. During periods when catch data were limited, catch information was combined with known habits of these fishes in Bear Lake. Lake trout remain below the epilimnion from June through September. Beginning in October, however, lake trout move into shallower water to spawn. After spawning, they occupy a variety of depths throughout the winter and into spring until thermal stratification occurs and they return to hypolimnetic depths. All sizes of lake trout were modeled with the same temperature regime. Cutthroat trout of 400 mm TL or more inhabit waters below the epilimnion from July through the time of thermal destratification. During winter and continuing through June, they typically inhabit depths from 2 to 15 m. Small cutthroat trout, those less than 400 mm in TL, inhabit intermediate depths (above the thermocline) from June through November. Beginning in April, this size-group presumably moves into shallow water to prey on spawning Bear Lake sculpin, which spawn at depths of less than 10 m.
Indices of prey fish biomass and production
The annual trend in biomass of pelagic and benthic prey fishes was estimated from 1990 to 1995. Our sampling strategy was designed primarily to target Bonneville cisco and Bear Lake sculpin. Pelagic prey fish biomass and abundance (targeting Bonneville cisco) were estimated by using hydroacoustic surveys conducted at night during periods of the new moon in late July and early August. Densities of pelagic fish were estimated along 9–10 parallel east–west transects. Acoustic data were collected with a Biosonics model 105 scientific echosounder with a 420-kHz dual-beam (6°,15°) transducer towed 1.0 m deep off the bow of the research vessel. We sampled at a rate of two pings per second while traveling at a boat speed of 3–5 m/s. To determine the acoustic size of individual fish targets in decibels, data were processed by echo-counting techniques with a Biosonics ESP dual-beam processor (model 281) and software. Targets within 4° of the acoustic beam axis were used to calculate fish target strength and to determine fish density estimates. Signals were adjusted for spreading loss by applying a time-varied gain of 40 log10R, where R is the time required for the sound to travel from the transducer to the acoustic target and back. Target strengths were converted to fish length by using an equation developed for coregonines (Dahm et al. 1985) and based on our dual-beam data. Fish densities were calculated from fish targets that had been apportioned into three size-classes: small,−57 to−53 dB (30–50 mm TL); medium,−53 to−41 dB (51–220 mm TL); and large,−41 to−39 dB (221–270 mm TL). To estimate annual trends in the biomass of pelagic prey fish, we pooled medium-sized targets along each of the 9–10 transects. Medium-sized targets encompassed nearly all of the Bonneville cisco older than age 1. Additional details of the acoustic techniques used here have been published elsewhere (Luecke and Wurtsbaugh 1993; Wurtsbaugh and Luecke 1998).
From 1992 through 1995, 18–23 midwater trawls were conducted each year along four of the acoustic transects to assess the species composition of acoustic targets. Trawls were partitioned among three depth strata: 4–10, 14–20, and 26–32 m. We used a beam trawl (Enzenhofer and Hume 1989) measuring 3 m wide × 7 m deep and fitted with a 5-mm cod end mesh. The trawl was lowered to the specified depth, opened, towed at 1 m/s for 20 min, closed, and raised to the surface. More than 95% of the midwater trawl catches were Bonneville cisco. Thus, we assumed that annual variation in pelagic prey fish biomass we determined acoustically represented variation in Bonneville cisco biomass (Wurtsbaugh and Luecke 1998).
The biomass and abundance of benthic fishes (targeting Bear Lake sculpin) was measured each year with a 4-m-wide bottom trawl (12.7 mm net mesh, and 5.0 mm cod end mesh liner) fished at three depth strata (2–8, 11–17, and 37–43 m) at 5–13 sites with 20-min trawls. Two replicate trawls were pulled at 1 m/s in each depth strata at each site with 24–56 individual trawls/year. This small trawl was chosen to sample small benthic prey fish and was less efficient at capturing larger taxa. Sampling was conducted at night (2200–0500 hours) during or close to the dark of the moon in late July or early August. Lengths of all Bear Lake sculpin were measured and converted to mass by using a length–mass regression. Estimates of minimum abundance and biomass of Bear Lake sculpin were made by assuming 100% trawl efficiency.
In addition to Bonneville cisco and Bear Lake sculpin, two other endemic prey fishes, Bear Lake whitefish and Bonneville whitefish, were also monitored. The biomass of these whitefishes, however, was not estimated because the species were not fully vulnerable to the active sampling techniques we used. The benthic distribution of the whitefishes makes it difficult to quantify them accurately by hydroacoustics. Their swimming ability (and subsequent gear avoidance) at larger body sizes also precluded quantitative sampling with the small bottom trawl used to sample Bear Lake sculpin. Further, the two whitefish species are difficult to distinguish at smaller body sizes.
Production of Bonneville cisco and Bear Lake sculpin was estimated for the 1993–1994 period by using an Allen curve technique (Chapman 1978). Body size-at-age for both species has been previously determined from otolith and scale measurements (Ruzycki et al. 1998; C. Luecke, unpublished data). Relative abundance of size-classes was determined from fish captured during the 1993 population surveys. For Bonneville cisco, length–frequency distributions were established by using the combined catches from midwater and bottom trawls and from the UDWR gill nets. Biomass for each age-class was then calculated as the product of the mean body size and abundance. Production (P, kg/year) was estimated as P = G · B, where G is the instantaneous rate of growth (natural log of the ratio of final to initial weight), and B is the mean biomass (kg) of each cohort (Ney 1993a).
Bioenergetics modeling
The Hewett and Johnson (1992) bioenergetics modeling program was used to develop models for the Bear Lake cutthroat trout and lake trout populations. The coefficients of Stewart et al. (1983) were used to model lake trout. Because no complete dataset of coefficients has been published for cutthroat trout, we used their closest published taxonomic surrogates, the steelhead Oncorhynchus mykiss coefficients of Rand et al. (1993), for most of the parameters. On the basis of data from Dwyer and Kramer (1975) we changed lower (CTO) and upper (CTM) temperature values (temperatures at which consumption is 98% of the physiological maximum) to better match those of cutthroat trout (Beauchamp et al. 1995). To simulate spawning, 6.8% of individual biomass was subtracted from lake trout (Stewart et al. 1983) that were longer than 600 mm on 15 October; 10% was subtracted for cutthroat trout (Rand et al. 1993) that were longer than 475 mm on 15 May. Model runs were tabulated at 15-d intervals and summed for annual estimates of consumption by allowing for seasonal variations in feeding habits and thermal history. Model runs were initiated on December 1 and continued through November 30 of the following year.
Ontogenetic shifts in diet and thermal history by cutthroat trout and lake trout necessitated size-dependent model simulations for each species. However, limited size-specific diet information for both species necessitated the use of size-groups instead of individual age-groups used for annual growth increments. Cutthroat trout were modeled as two size-groups (300–400 and more than 400 mm TL) for the four seasonal periods. At approximately 400 mm TL, cutthroat trout switch from being predominantly insectivorous and become increasingly piscivorous (Nielson and Lentsch 1988; Wurtsbaugh and Hawkins 1990). Lake trout were modeled as five size-groups (400–499, 500–599, 600–699, 700–799, and 800 mm or more TL) with no seasonal variation in diet.
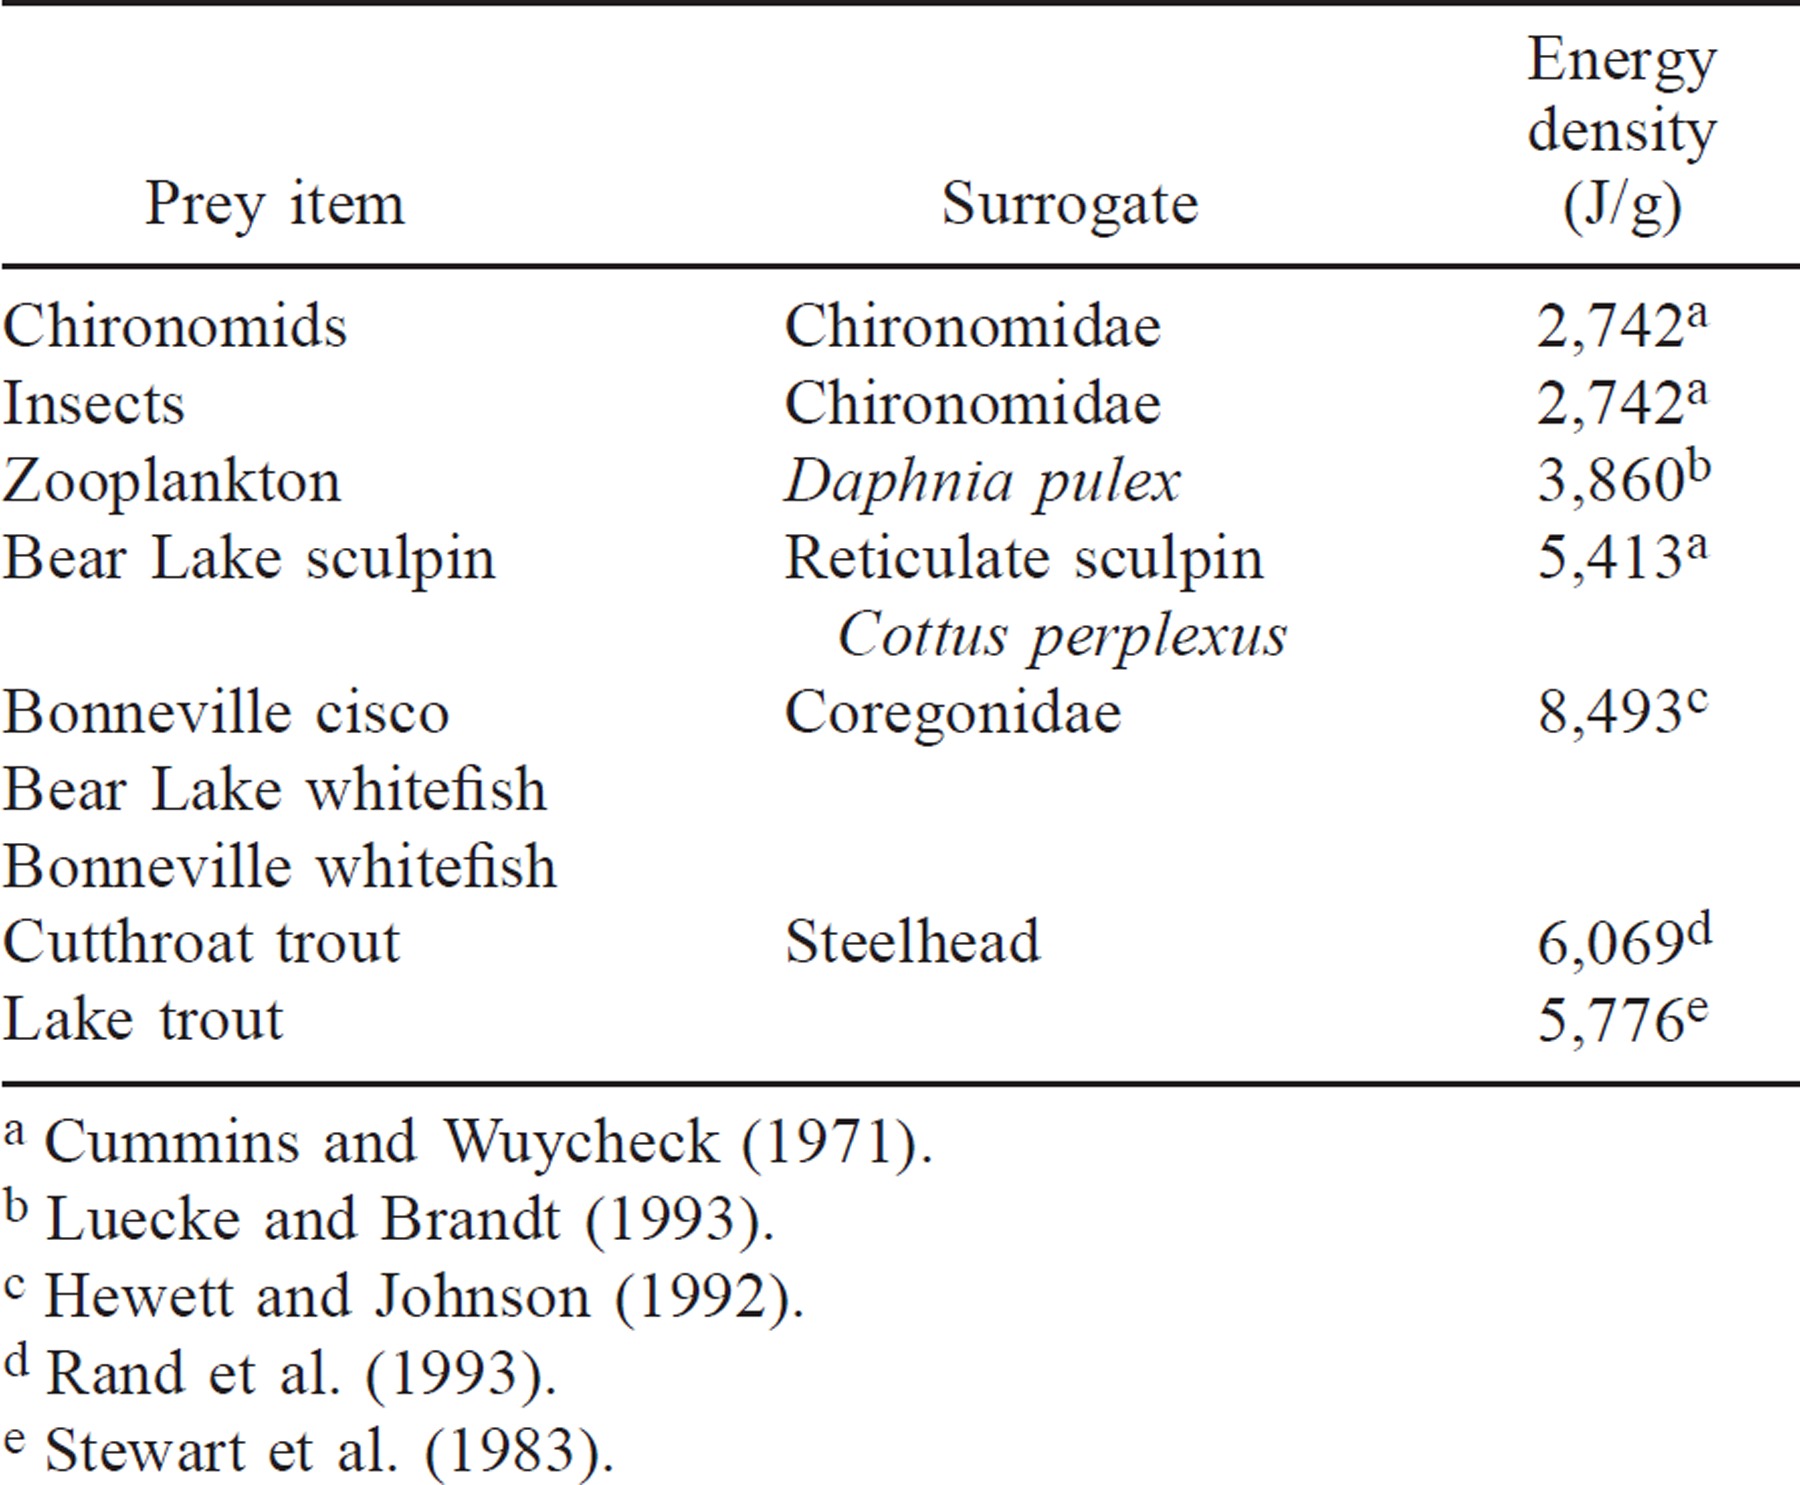
Predator and prey energy densities were derived from literature sources. Because little information was available for energy content of the endemic fish species, we used taxonomically close surrogates (Table 1). The percentage of indigestible invertebrate prey biomass was set at 10% (Stewart et al. 1983).
Piscivore condition factor and size-frequency distributions
Because body condition is related to the availability of prey, we examined the long-term and seasonal trends in the relative condition factor of cutthroat trout and lake trout. The relative condition index (Kn; Le Cren 1951) was used because it allows for comparisons among individuals within the same population (Ney 1993b). Both species were divided into two size-classes (less than 400 and equal to or greater than 400 mm TL) to examine the condition of preadult and adult fish. These sizes also correspond to the size-classes used to model the ontogenetic diet shift of cutthroat trout. Long-term trends in condition and size-frequency distributions were determined by using fish collected in the UDWR gill nets from 1986 to 1995. We also developed lake trout and cutthroat trout size-frequency distributions to examine the extent of overlap of size-groups of the piscivores and to illustrate the presence of strong cohorts. Because the piscivores show interspecific diet overlap at various body sizes, the presence or absence of size overlap was also used as complementary evidence for the potential of competition between the two species.
Results
Piscivore Population Estimation
From November 1992 to July 1994 we marked and released 516 cutthroat trout and 317 lake trout. Fish were captured at a variety of locations throughout most of the lake (Figure 1). For the marking phase of the mark–recapture effort, most fish were captured with gill nets (n = 491) although substantial numbers of fish were also captured by angling (n = 332) and an additional 10 fish were captured by trawling. Fish marked and released by using gill nets were primarily captured by the entanglement of their mouthparts; this method retained fish in the nets without substantial mortality. Approximately 9% of the captured fish died in the gill nets, removing 54 cutthroat trout and 21 lake trout from the total population. Nearly all of the fish captured by angling and trawling were released, and all fish that were transported and released away from their capture site were captured by angling. From the population we marked, 40 lake trout and 78 cutthroat trout were recaptured. Of these, 57% were returned by anglers, 23% in our gill nets, 13% in the spawning traps, and 7% by other methods.
The Jolly–Seber model estimated the age-2 and older cutthroat trout population at 31,000 (95% confidence limits [CLs]: 51,000 and 10,000) and the age-4 and older lake trout population at 16,000 (95% CLs: 22,000 and 9,200). These estimated population sizes yield average lake areal densities of 1.09 cutthroat trout and 0.56 lake trout/ha, with a total salmonine biomass of 1.36 kg/ha.
Piscivore Mortality Rates
The catch rates of fish in the standardized gill nets declined with age for both the cutthroat trout and lake trout populations (Figure 2). The exponential decay models were

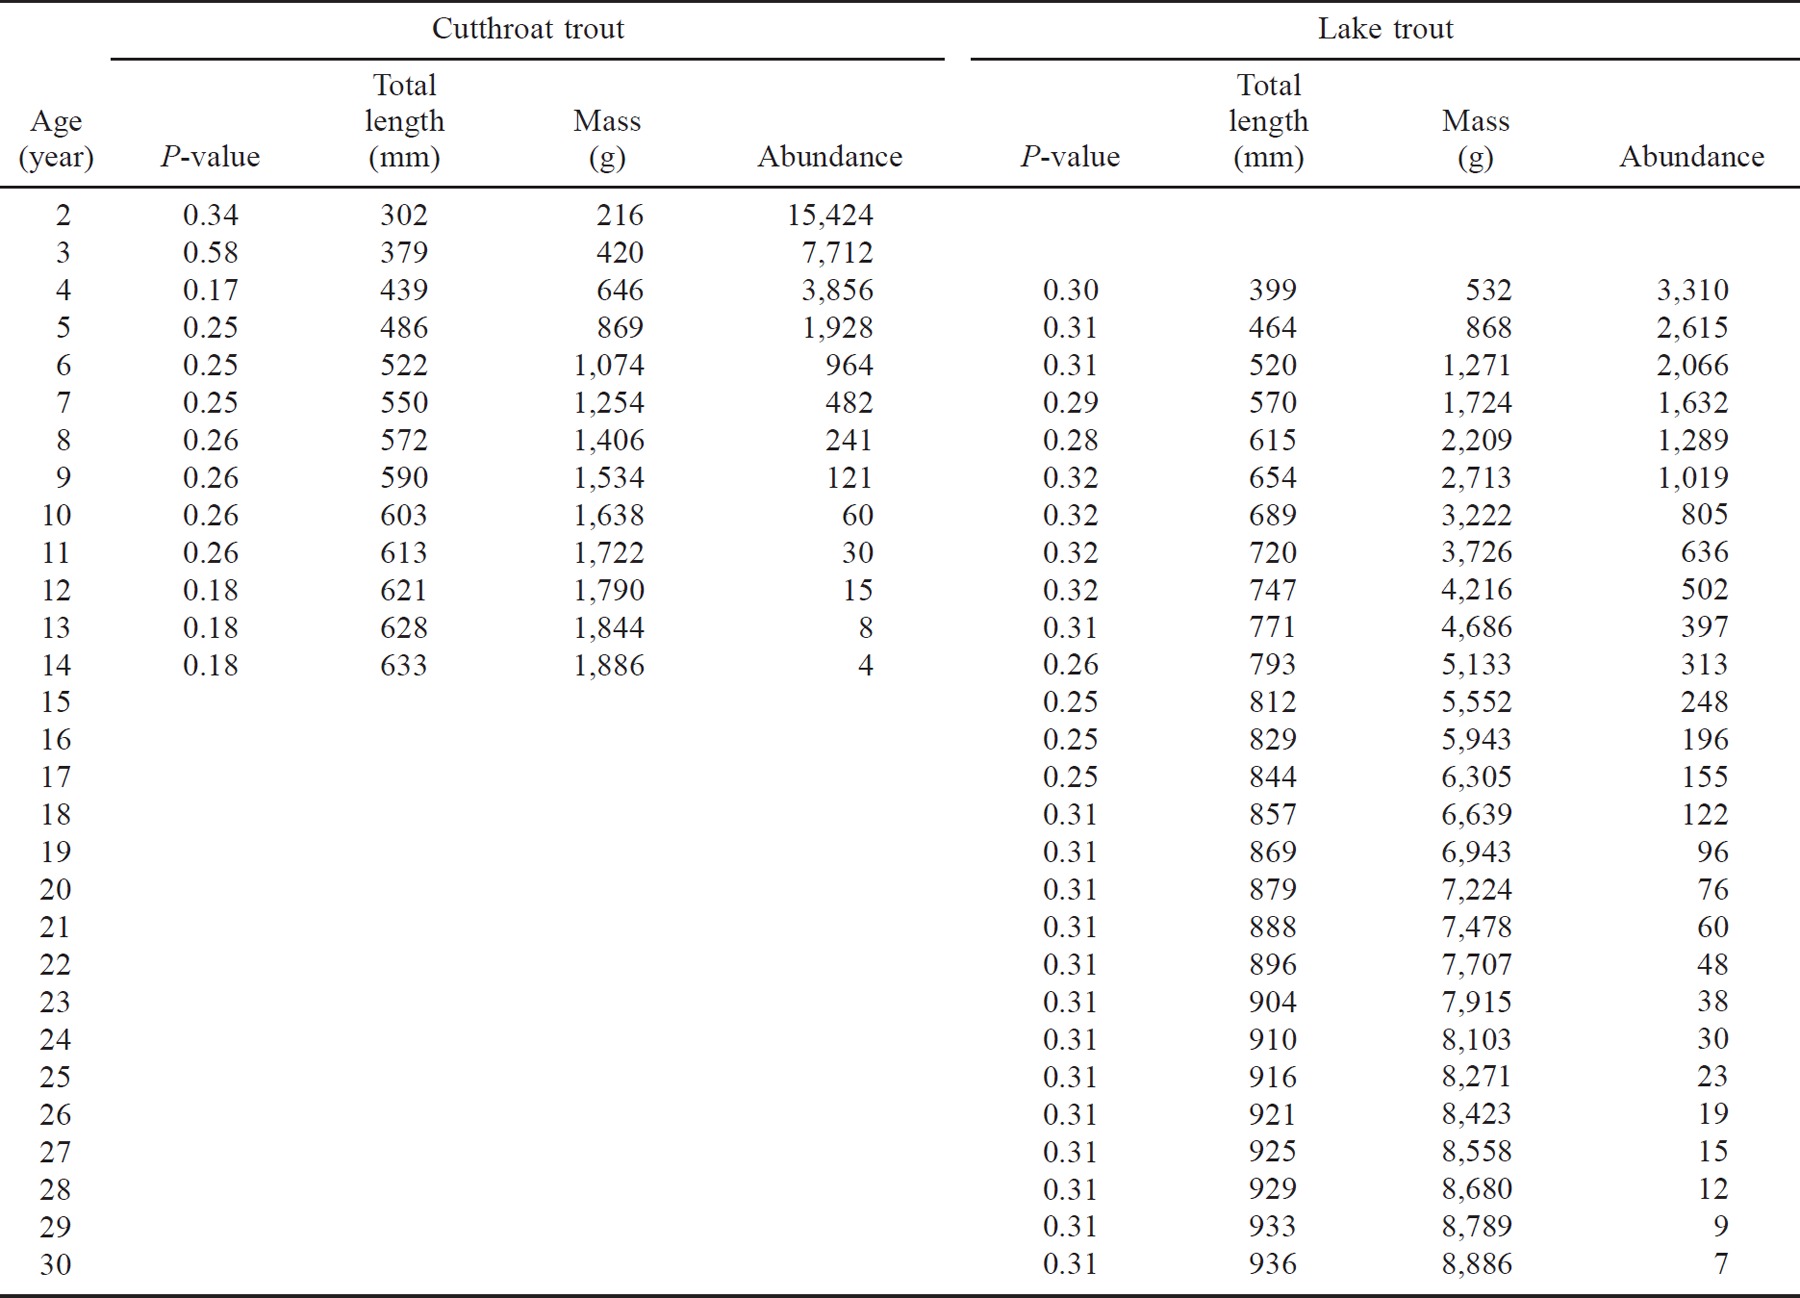
A where Nt is the number of individuals at age t in years. The slopes of the least-squares models indicate average annual mortality rates of 21% for lake trout and 50% for cutthroat trout (Gulland 1983). Applying these mortality estimates to the population estimates indicated the presence of 13 age-classes of age-2 and older cutthroat trout and 27 age-classes of age-4 and older lake trout (Table 2).
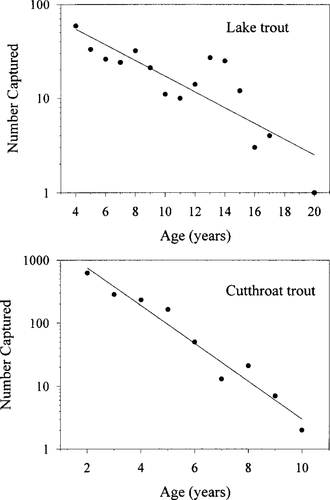
Catch curves showing the decreasing number of Bear Lake cutthroat and lake trout as a function of age (years). Fish were captured with standardized gill nets of variable mesh sizes
Piscivore Thermal History and Feeding Habits
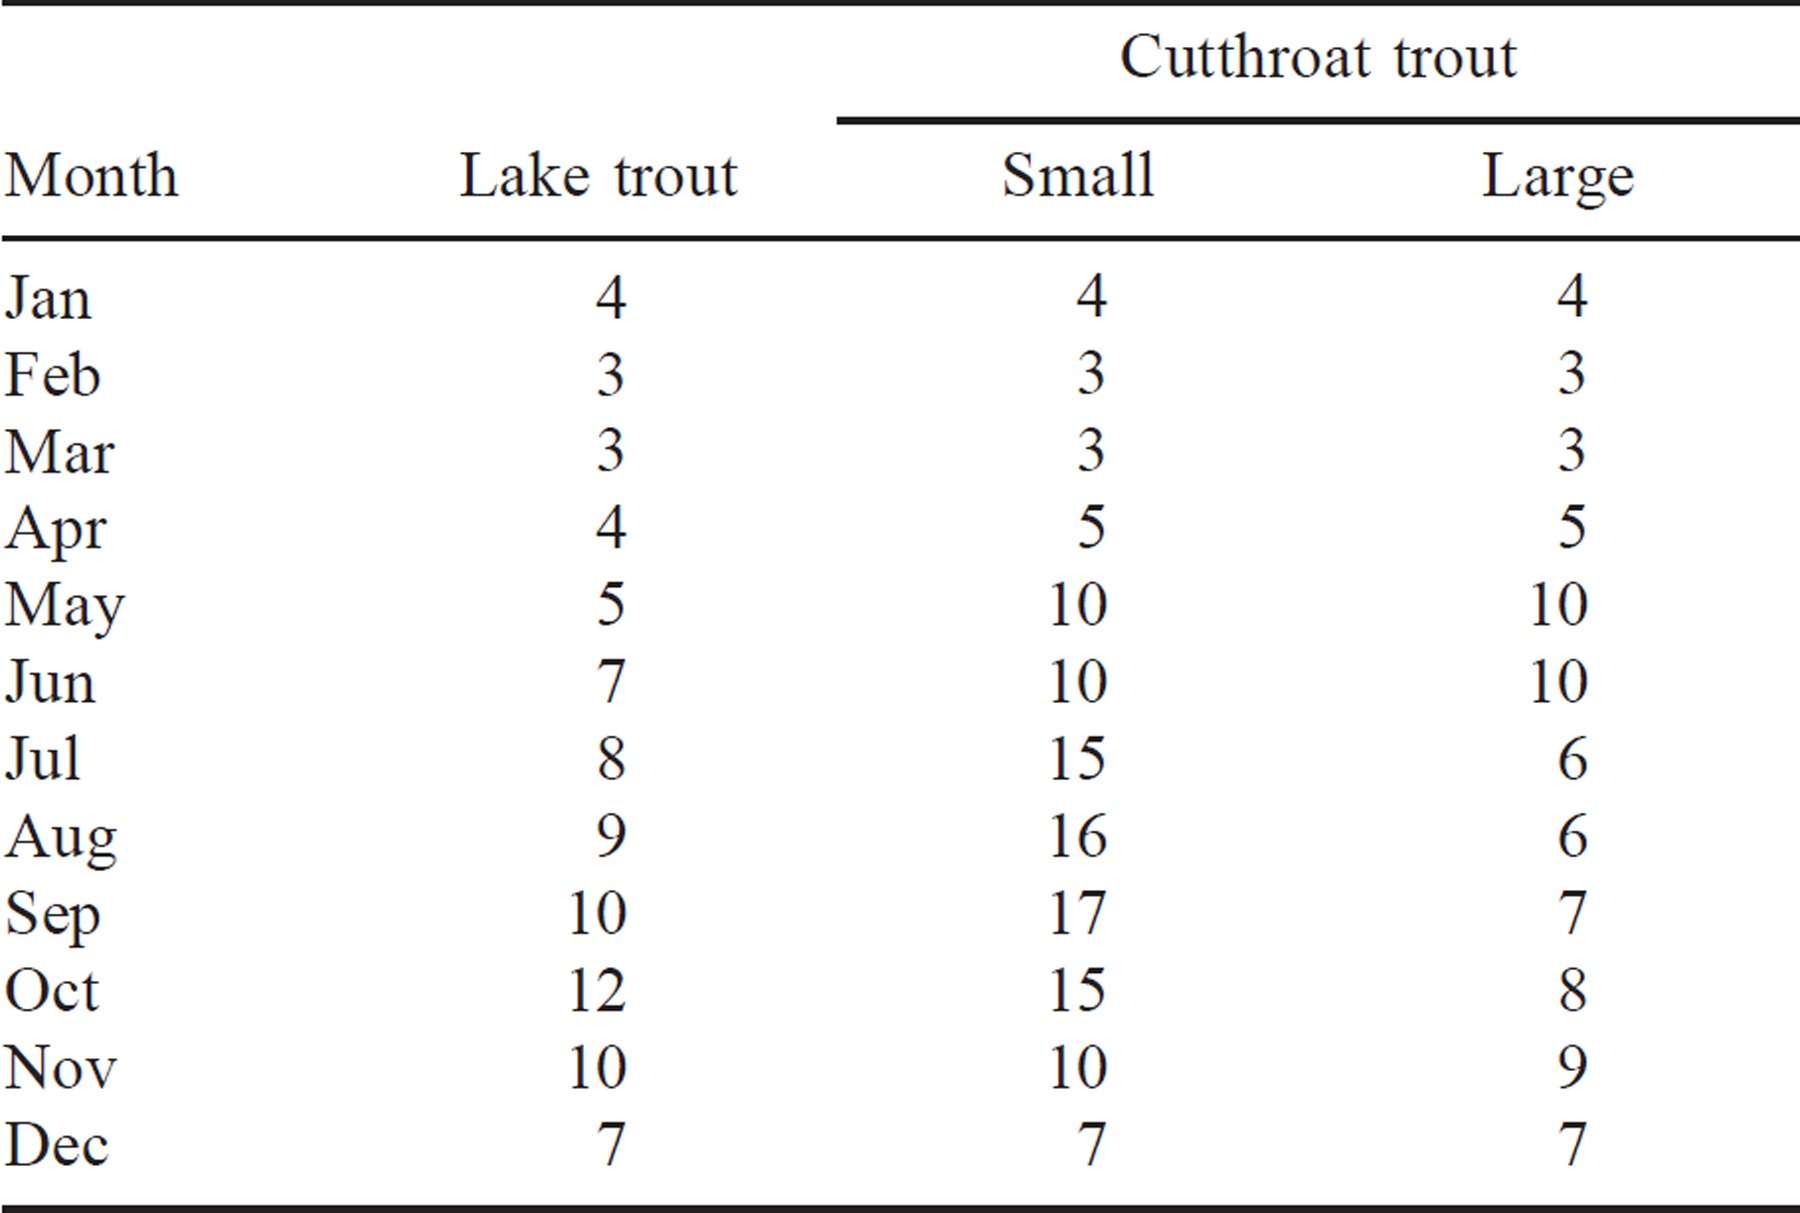
During the summer, small cutthroat trout fed primarily at the surface on the terrestrial insects found there. During the same period, these fish were also captured at night in gill nets set along the bottom just above the thermocline. Their thermal regime was reflected in this feeding strategy from June through October (Table 3). Lake trout and large cutthroat trout were captured exclusively below the epilimnion from July through September. During the spawning season in October, lake trout were readily captured in shallow water near rocky substrates. Large cutthroat trout spawned during the months of May and June in both model years (1993 and 1994). During the winter (December through March), all size-classes were modeled at ambient temperatures within 10 m of the surface (Table 3).
The combined diet information indicated cutthroat trout fed on a variety of invertebrate and vertebrate prey taxa. Small cutthroat trout consumed primarily Bear Lake sculpin and Daphnia sp. during the winter and spring (Figure 3A). Terrestrial insects and chironomid pupae became the dominant food items during the summer and autumn. Large cutthroat trout diets contained more fish than those of smaller individuals, including Bear Lake sculpin, Bonneville cisco, and whitefish (Figure 3B). The two whitefish species inhabiting Bear Lake are not easily distinguishable and were therefore reported only as whitefish. Bonneville cisco were the dominant food item of large cutthroat trout during autumn and winter, whereas small cutthroat trout, Bear Lake sculpin, and whitefish were also important in the diet during spring and summer.
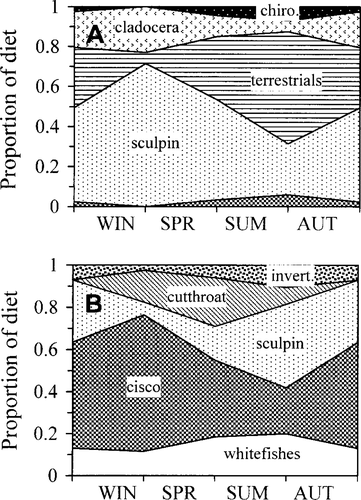
Seasonal diet composition of (A) small (<400 mm TL) and (B) large (≥400 mm TL) cutthroat trout captured in Bear Lake. Diet composition was calculated as the proportion of diet by wet weight. Abbreviated diet categories include: chiro Chironomidae larvae and pupae; terrestrials, terrestrial insects; and invert, other and unidentifiable invertebrates
Lake trout diets were consisted entirely of fish, including Bear Lake sculpin, Bonneville cisco, cutthroat trout, and whitefish (Figure 4A). The diet of lake trout smaller than 500 mm TL was dominated by Bear Lake sculpin but shifted to Bonneville cisco and whitefish at larger sizes (Figure 4B).
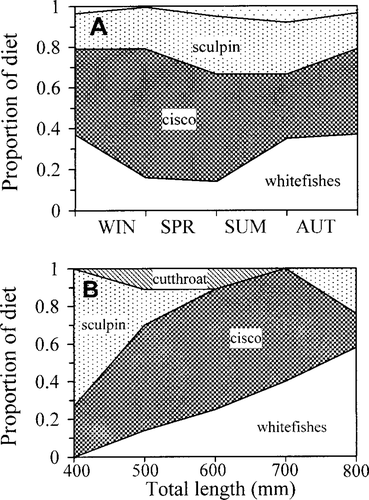
Seasonal and (B) size-specific diet composition of lake trout captured in Bear Lake. Diet composition was calculated as proportion of diet by wet weight
Piscivore Growth Rates
Both cutthroat trout and lake trout grew slowly in Bear Lake. For example, age-1 cutthroat trout and lake trout are stocked at an approximate mean individual mass of 20 g. Age-5 cutthroat trout and lake trout weighed 869 and 868 g, respectively. Growth rates of cutthroat trout slowed markedly above this age, whereas lake trout continued to grow. At age 10, cutthroat trout and lake trout weighed 1638 and 3222 g, respectively. The fitted von Bertalanffy growth curves for lake trout,


Indices of Prey Fish Abundance and Production
From 1990 to1995 the biomass of Bonneville cisco varied from a low of approximately 2.2 kg/ha during 1991 to a maximum of 4.2 kg/ha in 1995 (Figure 5). The biomass of Bonneville cisco captured in the bottom trawl survey averaged 30% of the pelagic estimate. Using abundance and measured growth rates, Bonneville cisco production was estimated at 20,300 kg/year during 1993. The minimum biomass index of Bear Lake sculpin declined from 1990 (0.17 kg/ha) to 1992 (0.098 kg/ha), then returned to approximately 0.25 kg/ha in 1995 (Figure 5). With the 1993 abundance estimate (2 million fish) and growth rates, Bear Lake sculpin production was estimated at 4,000 kg/year.
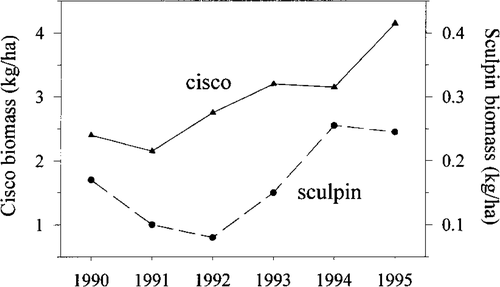
Minimum biomass estimates of Bonneville cisco (left scale) and Bear Lake sculpin (right scale) as determined from hydroacoustic and bottom trawl surveys
Bioenergetics Modeling
Bioenergetics simulations indicated that piscivores were consuming far less than their maximum possible ration (P-value). The proportion of maximum consumption was generally less than 0.34 for both species, and P-values for cutthroat trout were usually less than those for lake trout of the same size (Table 2). The combined consumption by lake trout and cutthroat trout, however, approached the minimal production estimate of Bonneville cisco and exceeded the estimated minimal production of Bear Lake sculpin by12,000 kg/year.
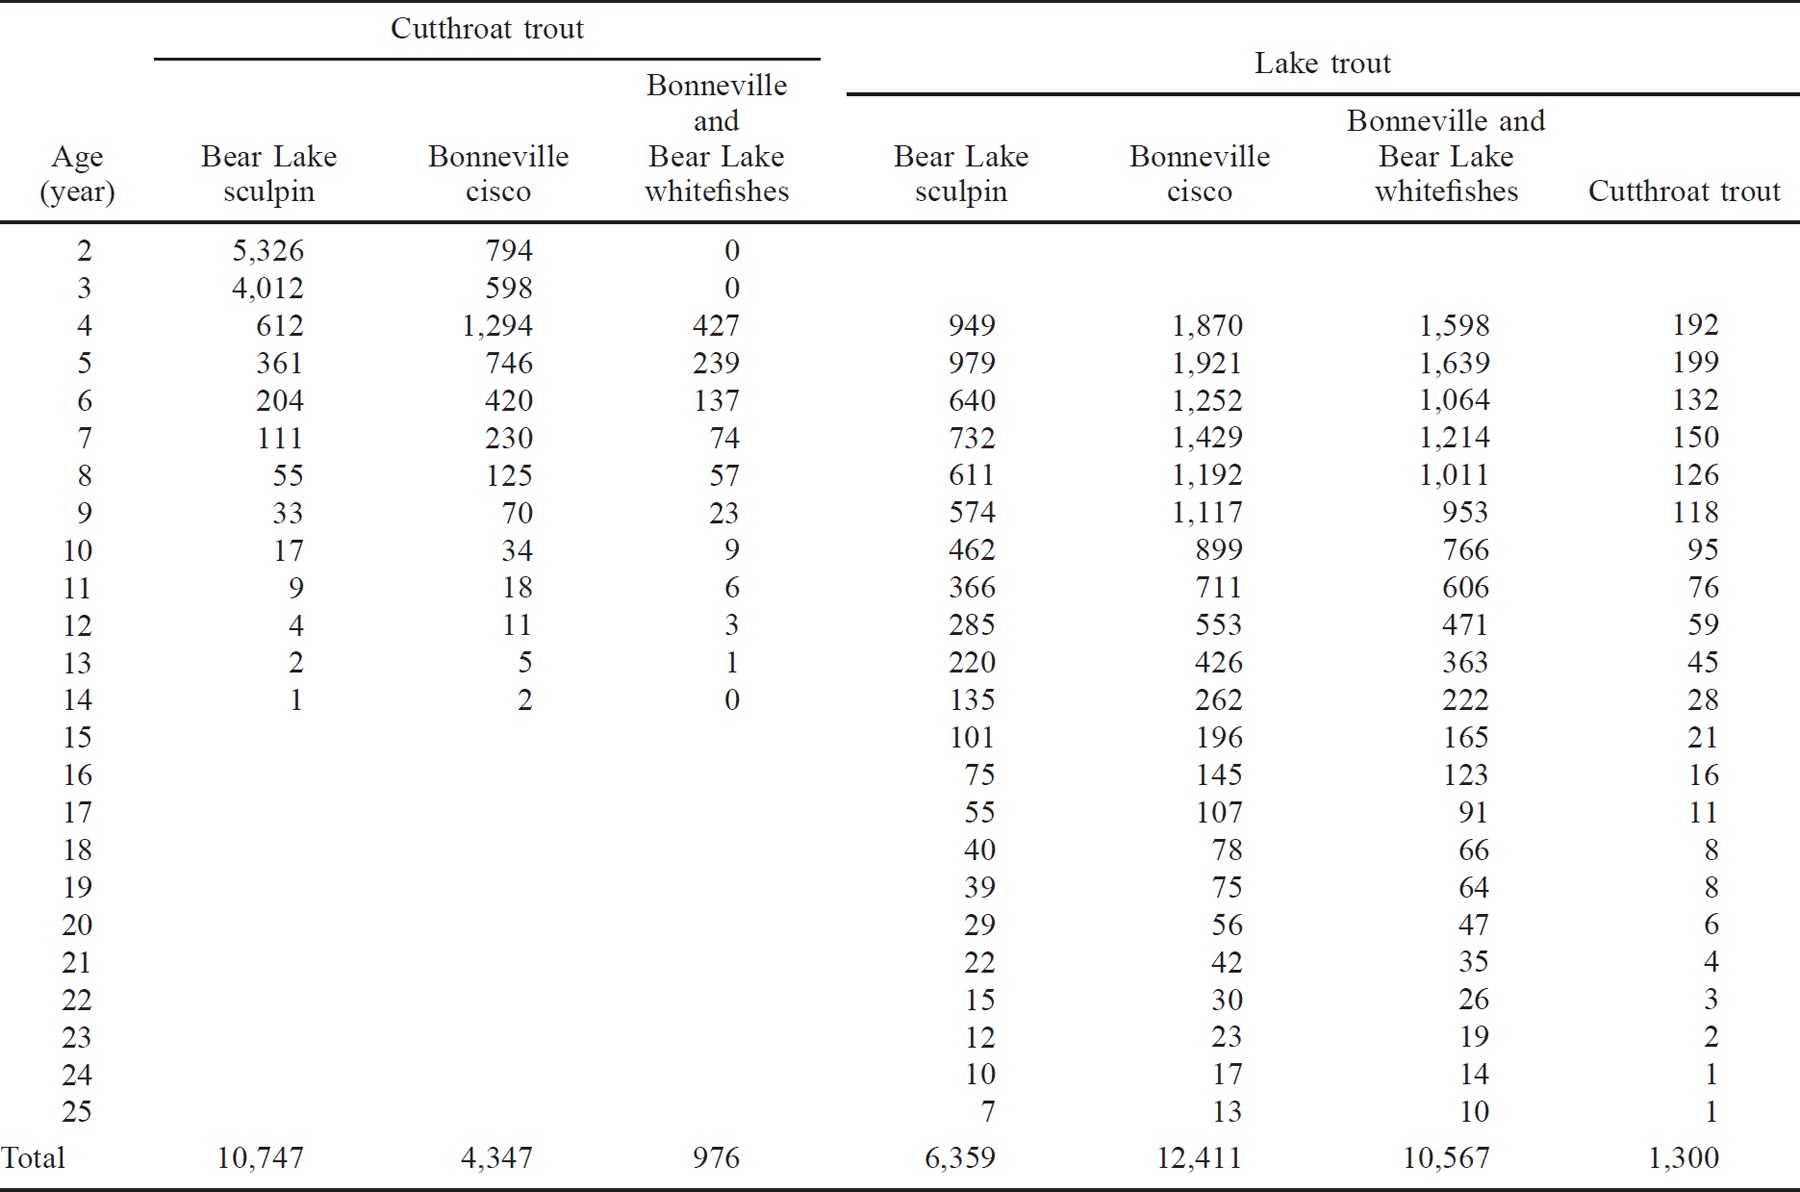
Lake trout exerted 66% of the predation pressure on prey fishes, primarily because of their longevity; cutthroat trout exerted only 34%. Predation pressure on the prey fish was spread over relatively few age-classes in cutthroat trout, whereas the pressure from lake trout was much more prolonged (Table 4). Cutthroat trout of age 6 or older ate approximately 15% of the prey fish consumed by this population. In contrast, consumption by lake trout age 6 or older accounted for 65% of the prey fish consumed by their population. This difference reflects the much higher mortality rate for cutthroat trout than for lake trout and the lower growth and consumption rates for cutthroat trout.
Piscivore Condition Factors and Size-Frequency Distributions
The condition factors of both size-classes of cutthroat trout and lake trout declined from 1986 to 1995 (Figure 6). In small cutthroat trout, this decrease was relatively slight. Condition factors of large cutthroat trout were relatively constant from 1986 to 1990 but then dropped precipitously. Condition factors of small lake trout were relatively stable until 1990 but then declined. Large lake trout show a similar trend except that their condition increased slightly after 1993. Annual comparisons of lake trout and cutthroat trout size-frequency distributions showed little interspecific overlap in population size structures from 1986 to 1995 (Figure 7). Beginning in 1988, a persistent cohort of lake trout was apparent; during this same period, however, cutthroat trout recruitment was poor, and cutthroat trout size-classes similar in size to this strong lake trout cohort appeared to be replaced by the similar-sized lake trout.
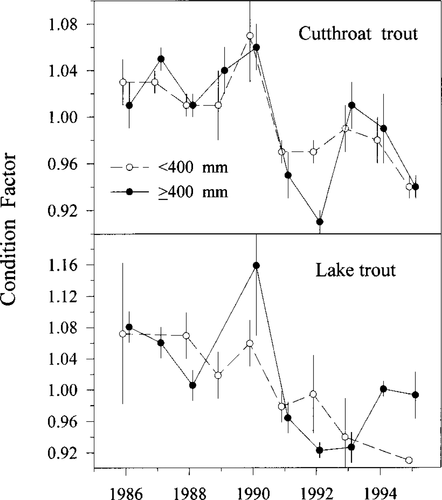
Ten-year trend in the relative condition index (Kn; Le Cren 1951) of small (< 400 mm TL) and large (≥400 mm TL) cutthroat and lake trout captured in Bear Lake from 1986 to 1995. Error bars show 95% confidence intervals
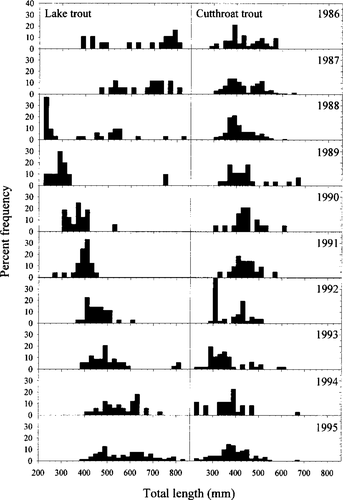
Size-frequency distributions of lake and cutthroat trout captured in variable-mesh gill-net sampling. Note the apparent strong cohort of lake trout beginning in 1988 and continuing through 1995
Discussion
The mark–recapture study demonstrated that abundances of cutthroat trout and lake trout in Bear Lake were very low but typical for an oligotrophic lake, having an estimated total density of only 1.65 trout/ha and a standing crop estimate of 1.36 kg/ha. If we had been able to sample the youngest age classes of trout, and if Bonneville whitefish were included, our estimate of piscivore standing crop would have been larger. Given the oligotrophic state of Bear Lake, our estimates are reasonable. Using the relationship between chlorophyll a concentration and fish biomass derived for kokanee lakes in Idaho (Rieman and Meyers 1992), we would predict that Bear Lake, with a summer chlorophyll a concentration of only 0.51 μg/L (Moreno 1989), would have a salmonine standing crop of 1.54 kg/ha—near the observed value. Lake Tahoe, with photic zone chlorophyll levels near 0.33 μg/L (Chang and Petersen 1995), has lake trout densities of 2.0 fish/ha (Theide 1997). The low salmonine standing crop is also consistent with Bear Lake's very low densities of benthic invertebrates and zooplankton (Wurtsbaugh and Hawkins 1990). Thus, although we made many assumptions in estimating the density of piscivores in the lake, the results are consistent with the expected salmonine density.
Despite the low abundances of piscivores, our results indicate that they were consuming a large proportion of the Bonneville cisco and Bear Lake sculpin populations. We estimate that they consumed 83% of the estimated annual production of Bonneville cisco in 1993; determining the impact of the piscivores on Bear Lake sculpin and whitefish is more difficult because we do not have accurate population estimates for these prey species. The estimated consumption of Bear Lake sculpin by the piscivores far exceeded our estimated minimum production of this prey. This was not surprising since our trawl estimate of Bear Lake sculpin biomass underestimates the true biomass because the trawl is not 100% efficient. To accurately estimate the impact of the piscivores on the Bear Lake sculpin, we would have to measure the efficiency of the trawl. Nevertheless, the decline in Bear Lake sculpin biomass coincided with the increase in piscivory since 1990, suggesting that the increased predatory losses could have accounted for the decline. The increase in Bear Lake sculpin biomass in 1994 and 1995 is also consistent with the decreasing population and increasing size of lake trout during this period, because the older fish switch to feeding on Bonneville cisco and whitefishes and thus decrease their predation on Bear Lake sculpin.
We can also estimate the impact of piscivory by lake trout on the juvenile cutthroat trout stocked in the lake. The majority of cutthroat trout consumed are probably age 1, although some age-2 fish were also found in the diets of lake trout. These small fish are vulnerable to predation and were found in lake trout diets during the spring stocking period. The mean individual mass of an age-1 cutthroat trout is 130 g. With an estimated total consumption of cutthroat trout juveniles of 1,300 kg/yr, we estimate that large trout consumed 10,000 individuals each year or 5% of the total number of cutthroat trout stocked each year. Because we had limited diet samples during stocking periods, some of the temporally limited predation may have been missed. A subsequent, more temporally explicit, study of this predation indicated that lake trout were consuming nearly 24% of the stocked cutthroat trout (Orme et al. 1999).
Our gill-net catch data from 1992 to 1995 suggest that cutthroat trout mortality was very high between ages 3 and 4; indeed, we captured only nine cutthroat trout older than this. Age-3 cutthroat trout are approximately 380 mm TL, which corresponds to a size when they are becoming more piscivorous. If small prey fish are in short supply, this may be a critical life stage. Evidence from the bioenergetics simulations supports this hypothesis: The P-value drops from 0.58 for age-3 fish to only 0.18 for age-4 fish. This dramatic decline in P-values suggests that either these fish are not adapting well to piscivory or too few small prey fish are available for the cutthroats. The high mortality rate between ages 3 and 4 may also be related to the young cutthroat trout entering the fishery at this time. If the fish are very hungry at this age (i.e., low P-value), they may be particularly vulnerable to angling. Accordingly, these age classes of cutthroat trout were highly vulnerable to our angling effort used for the mark–recapture portion of our study, accounting for 64% of the cutthroat trout angled.
Several lines of evidence suggest that lake trout and cutthroat trout are competing for the prey fish. First, the low growth rates and P-values of the piscivores suggests that they are food-limited. Second, the data suggest that lake trout may be competitively excluding cutthroat trout from feeding on Bear Lake sculpin. In 1987, when lake trout abundance was very low, Bear Lake sculpin made up 67% of the diet of cutthroat trout between 250 and 350 mm TL (Wurtsbaugh and Hawkins 1990). During our 1993–1994 diet analysis, when the lake trout were abundant, almost no identifiable fish were observed in the 91 cutthroat trout smaller 400 mm TL that we examined, indicating a major change in feeding. The substantial population of large lake trout, coupled with the small population of large cutthroats could be interpreted as competitive exclusion of the larger sizes of cutthroats by lake trout.
Length-frequency distributions of cutthroat trout and lake trout show surprisingly little overlap since 1986, despite large variations in both species' distributions. Moreover, lake trout could be limiting recruitment of similar-sized cutthroat trout. Beginning in 1988, when lake trout were recruiting through small size-classes, cutthroat trout were absent at similar sizes, suggesting they had poor recruitment during these years (Figure 7). As these lake trout cohorts grew, reaching approximately 400 mm TL (1992), cutthroat trout of smaller size-classes were again captured in gill nets. This pattern may be due to competitive exclusion of similar-sized cutthroat trout by lake trout.
Declines in condition factors of the piscivores suggest that the quantity of available food in the lake decreased from 1986 to 1995. Condition factor declined in both lake trout and the large piscivorous cutthroat trout, suggesting that prey fish abundance was declining. The decline in condition factors is consistent with the decline in Bear Lake sculpin numbers and the small size-classes of whitefish from 1990 to 1993 (W. Wurtsbaugh, unpublished data). Condition factors of cutthroat trout began to decline in 1991, coincident with the time when large lake trout cohorts became piscivorous, further supporting the hypothesis of competition between the two species.
In addition to an increase in piscivores, other environmental factors have been implicated in the population fluctuations of these prey species. The water level in the lake has become lower during the recent drought, reducing the surface area of the shallow littoral zone habitat in Bear Lake, which may be an important nursery habitat for juvenile prey fishes. Lack of extensive rocky substrates may have also reduced prey fish reproduction. These substrates are an important spawning habitat for Bear Lake sculpin (Ruzycki et al. 1998), Bonneville cisco (Bouwes and Luecke 1997), and whitefish. Low-water years are also coincident with both low abundance of Bear Lake sculpin and reduced condition factors of piscivores, suggesting that the water level indirectly affects piscivore growth and survival.
The evidence presented here suggests that salmonine production is limited by prey fish numbers during periods of low prey fish production, and that the piscivores consume a large portion of prey fish supply. Stocking of lake trout has increased predation pressure on the food base, reduced recruitment of cutthroat trout, and lowered condition factors of both salmonines. The prey fish, however, are still abundant, with nearly 2 million Bonneville cisco and at least 2 million Bear Lake sculpin in the lake. Maintaining the piscivores at 1993–1994 levels will therefore probably not threaten the prey species of special concern. These results must also be viewed within the environmental context of drought and subsequent low water levels, which may have driven prey fish reproduction to below normal values. More recently, water levels have returned to predrought conditions, and prey fish biomass has recovered from the minimum estimates of 1991 and 1992. During 1995, biomass and abundance of both Bonneville cisco and Bear Lake sculpin was approximately double that in the low-water years (W. Wurtsbaugh, unpublished data).
Because stocking decouples predator–prey interactions, and because predation by a cohort of lake trout is so prolonged (>15 years), increased stocking of lake trout and cutthroat trout should be coupled with careful monitoring of both prey fish abundance and piscivore condition factors. Careful monitoring, however, will not aid long-term prediction of predator–prey imbalances because piscivory by a single stocked cohort of lake trout is not evident for 4–5 years and may not peak until 10 years after stocking. Longevity and predatory inertia, coupled with variable recruitment, make it difficult to manage current lake trout stocking with future prey fish supply. A strong cohort of lake trout produced during near-optimal conditions may eventually coincide with a period of low water levels 10 years from now and may therefore impose a serious risk to endemic fishes. This unpredictability necessitates an extremely conservative approach. Fortunately, a more conservative approach to lake trout stocking has been implemented by the managing agencies by reducing the frequency of stockings. We believe, however, a more naturally functioning food web could be obtained by completely eliminating the stocking of nonnatives.
We do not understand the factors that control natural reproduction of the lake trout in the lake. Trawl catches of very small, unmarked lake trout suggest that natural reproduction is possible in the lake. One hypothesis for the low reproductive success of lake trout is that egg predators (e.g., Bear Lake sculpin, whitefish, suckers; Bouwes and Luecke 1997) can limit recruitment (B. Nielson, UDWR, personal communication). If this hypothesis is true, and if egg predators decrease in numbers because of predation or some other factor, then the lake trout might successfully reproduce in numbers. This could initiate an alternative stable state in which the piscivores would decimate the prey fish populations and the lake trout could subsequently switch to a diet containing a greater proportion of cutthroat trout. High rates of lake trout predation on cutthroat trout have been demonstrated in Bear Lake (Orme et al. 1999) and other large lakes (e.g., Ruzycki and Beauchamp 1997), and lake trout introductions have often been implicated in the decline of indigenous fishes (Gerstung 1988; Marnell 1988; Crossman 1995). Consequently, until we understand the factors controlling recruitment of the lake trout in Bear Lake, we must exercise care in stocking these predators. Without careful stocking, populations of the endemic prey fishes could be driven dangerously low, which would threaten the future recruitment and growth of indigenous sport fishes.
Acknowledgments
This research was funded by Federal Aid in Fish Restoration administered through the Idaho Department of Fish and Game. Dick Scully provided the support from the Idaho Department of Fish and Game. This work could not have been completed without the assistance and efforts of Bryce Nielson and Scott Tolentino of the Utah Division of Wildlife Resources, who provided extensive access to their database on the Bear Lake fish populations.


