Processes Contributing to Variability in Regional Patterns of Juvenile River Herring Abundance across Small Coastal Systems
Present address: Federal Energy Regulatory Commission, 888 First Street NE, Washington, DC 20426, USA.
Abstract
Many populations of anadromous herring, (e.g., alewives Alosa pseudoharengus and blueback herring A. aestivalis, collectively referred to as river herring) are in decline. To help understand the various processes influencing their relative abundance, we studied juvenile river herring populations in 11 small, coastal Massachusetts systems. We examined diel and seasonal movements, variation in patterns of abundance, and relationships between juvenile river herring numbers and seven abiotic and biotic factors (stream discharge, pond temperature, habitat availability, pond transparency, pH, food availability, and spawning stock size). Seasonally, juvenile downstream migration peaked in early summer, and most juvenile river herring emigrated between 1200 and 1600 hours. Little or no emigration occurred in late summer when stream channels were often dewatered, although several streams experienced a smaller, more variable emigration peak in the fall. In univariate regressions, stream discharge, pond volume, surface area, depth, transparency, and pH were significantly related to variation in juvenile abundance across systems. Multiple regression models that integrated discharge, volume, and transparency, as well as multivariate models that included abiotic and biotic influences, trophic effects, and system size, explained 32–82% of the variability in juvenile abundance across systems. Thus, stream discharge, pond volume, transparency, pH, trophic effects, and system size contribute to heterogeneity across systems and may influence the abundance of these fish during freshwater residence. Increased understanding of the sources of heterogeneity in movement patterns and causes of variability in abundance across systems can help to implement more effective monitoring protocols, more informed land-use decisions, and improved management of river herring.
Introduction
Anadromous alewives Alosa pseudoharengus and blueback herring A. aestivalis, known collectively as river herring, return to freshwater to spawn. Juveniles spend 3–9 months in their natal rivers before returning to the ocean. Because anadromous river herring use a variety of coastal streams for spawning and rearing, they are an ideal group to examine for across-system responses to variation in environmental factors. Furthermore, these fish offer a unique opportunity to study regional patterns in fish distribution and abundance. Substantial differences in relative abundance of juvenile river herring have been reported in coastal streams of southern New England (Rulifson 1994). Although many factors acting at multiple life stages may contribute to these patterns, mortality during their first year of life probably plays an important role. To gain insights into factors that influence abundance during the first year, we analyzed patterns of juvenile river herring abundance and variation in relationships between fish numbers and environmental variables in 11 small coastal Massachusetts streams.
Both stream and pond conditions potentially affect the juvenile stage of anadromous river herring. Stream discharge, pond characteristics (e.g., temperature, habitat availability, water quality, food availability), and spawning stock can affect early life stages of anadromous fishes. Reduced stream discharge adversely affects anadromous fish in general (Moring 1993), and emigrating juvenile river herring specifically (Cooper 1961; Kissil 1974; Richkus 1975a; Huber 1978). Direct and indirect effects of extreme temperatures can also adversely affect juvenile clupeids (Crecco and Savoy 1984; Rulifson 1994). As habitat generalists, alewives and blueback herring use the littoral and pelagic zones of headwater ponds for spawning and rearing (Fay et al. 1983; Yako 1998). Habitat availability, as measured by headwater pond volume, surface area, and depth, varies across systems and may limit juvenile river herring relative abundance. Both alkaline conditions, which may indicate highly productive, hypoxic systems (Charlton 1980), and acidic conditions, which can be toxic to eggs and larvae (Baker 1982), could cause variation in juvenile river herring across coastal systems. In addition, water transparency may contribute to variations in juvenile abundance by altering reproductive behavior of adult fish (Muncy et al. 1979), development and mortality of eggs and larvae (Fay et al. 1983), and feeding success of larval and juvenile clupeids (Muncy et al. 1979; Crecco and Savoy 1987). Furthermore, food can affect juvenile alosid abundance and has the potential to contribute to both small- and large-scale heterogeneity (Essig 1979; Crecco and Savoy 1985; Gibson 1992). Finally, although most studies show limited or no parent–progeny relationship (Gibson 1994; Jessop 1994), the relative abundance of adult river herring could reduce juvenile abundance at low stock levels.
Thus, stream discharge, pond characteristics (e.g., temperature, spawning and rearing habitat, transparency, pH, food availability), and adult spawning stock vary across systems and have the potential to alter the relative abundance of juvenile river herring. To assess the effect of these abiotic and biotic factors on variation in juvenile river herring abundance across systems, we first examined diel variability in juvenile river herring migration in two coastal streams. If we found that daily patterns were similar, then we could sample these fish representatively across systems. We then quantified seasonal variability in juvenile river herring abundance and stream discharge in all 11 coastal streams. For all study systems, we then calculated a single point estimate for each abiotic and biotic variable. Finally, to evaluate the role of these factors in contributing to variability in juvenile river herring across systems, we examined univariate and multivariate relationships between juvenile river herring and these point estimates of abiotic and biotic factors.
Methods
Study site selection
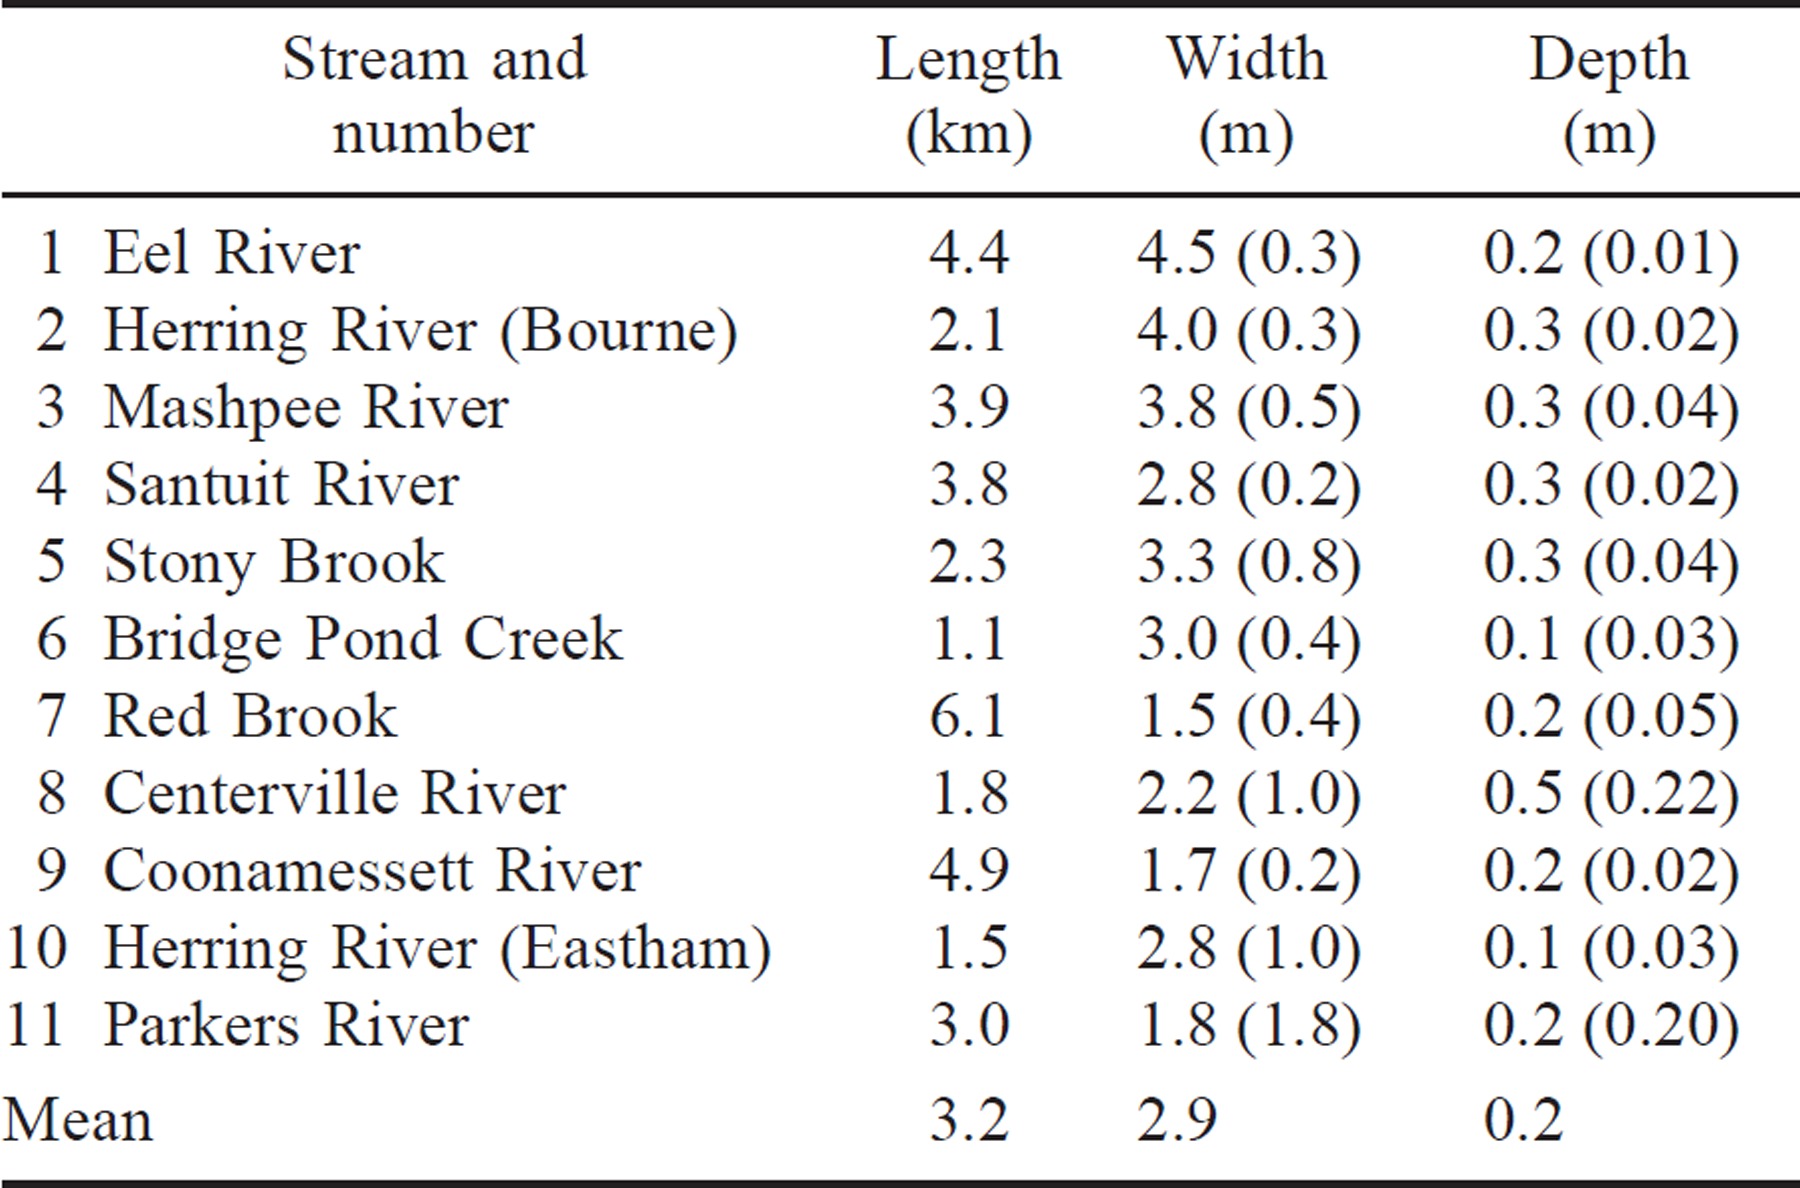
We selected 11 physically similar streams with associated rearing ponds as experimental units to assess the effect of selected abiotic and biotic factors on juvenile river herring abundance in the freshwater habitat. All systems included small, first-order, pond-fed coastal streams in southeastern Massachusetts (Figure 1) with similar lengths, widths, and depths (Table 1). The surface area and volume of the associated ponds varied. To assess whether the pond sizes in our 11 study systems were representative of other river herring systems in Massachusetts, we calculated surface area and volume of accessible spawning and rearing ponds for all Massachusetts systems with river herring runs and compared the size of those reference systems to our study systems.
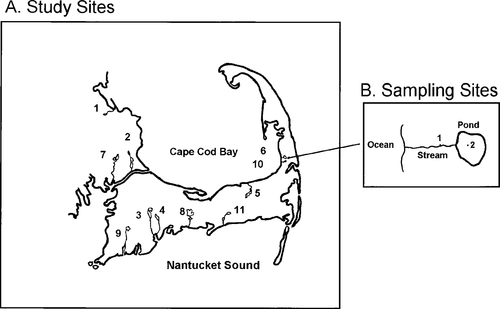
Geographic locations of the 11 small to medium-sized coastal Massachusetts streams sampled in 1994. The stream names (and nearest towns) by their identification number are (1) Eel River (Plymouth), (2) Herring River (Bourne), (3) Mashpee River (Mashpee), (4) Santuit River (Mashpee), (5) Stony Brook (Yarmouth), (6) Bridge Pond Creek (Eastham), (7) Red Brook (Wareham), (8) Centerville River (Centerville), (9) Coonamessett River (Falmouth), (10) Herring River (Eastham), (11) Parkers River (Yarmouth). (B) Locations for (1) stream sampling (juveniles, discharge, and adults), and (2) pond sampling (temperature, transparency, pH, and zooplankton)
Juvenile river herring sampling
Cold temperatures can influence survival of alewives (Meador et al. 1984; Eck and Wells 1987). Specifically, juvenile river herring do not survive temperatures of 3°C or less (Otto et al. 1976). Because average coastal water temperatures in February–March fall below this lower lethal temperature (National Oceanographic and Atmospheric Administrative National Buoy Data Center; Buzzards Bay Buoy BUZM3; 1985–1993), juvenile river herring typically do not overwinter successfully in these coastal systems. Hence, if they do not emigrate before winter, they probably will die. Thus, we equated juvenile emigration or escapement with juvenile relative abundance. We quantified the abundance of juvenile river herring in two ways. First, to evaluate if our sampling was representative across streams, diel, downstream migration patterns were quantified every other week from June 24 through October 1, 1994, in two systems: Herring River (Bourne; N = 8 weeks) and Mashpee River (N = 6). These diel samples, 15 min each hour over a 24-h period, were taken approximately 1 km downstream of the lowest headwater pond, where one–four contiguous nets (1.5 m long, 0.6 m wide, 0.4 m high, 0.32-cm mesh) were staked into the stream bottom from shore to shore (Table 2).
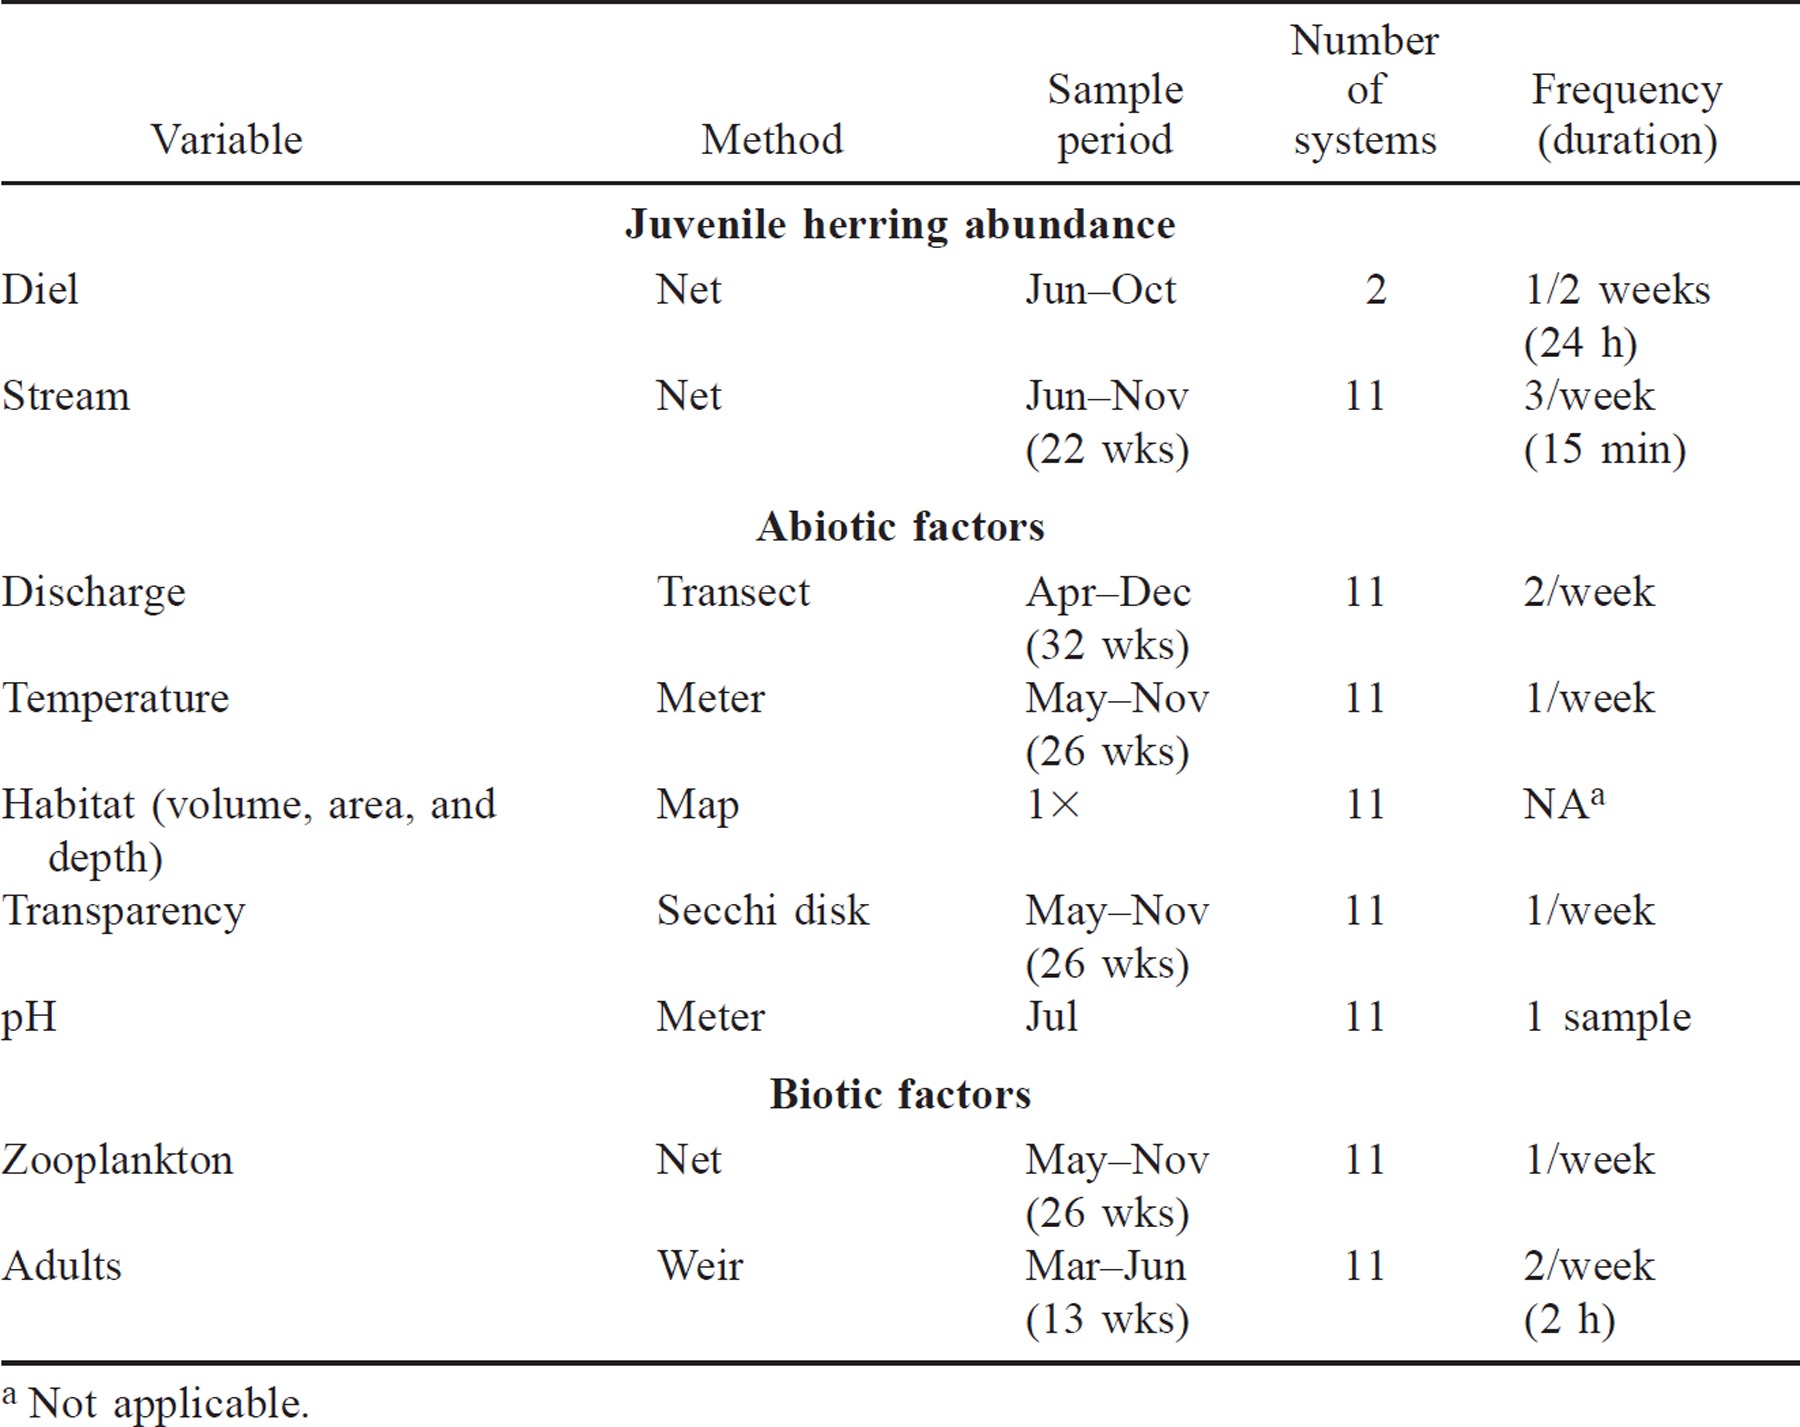
Second, in all systems we measured the relative abundance of juvenile river herring throughout the emigration season (June–November 1994) as these juvenile fish moved downstream from the freshwater rearing pond toward the ocean. In the Mashpee River, sampling was stopped in late September for logistic reasons. Migrating juveniles were sampled in each system three times per week for 15 min as described above (Table 2). When large numbers of juveniles (>300) were captured in the first 3 min (10 of 792 samples, 1.3%), the sample period was shortened to 5 min and the catch was extrapolated to 15 min to standardize effort across samples. In every catch, juvenile river herring were counted and a subsample of 100 fish was identified to species. We then estimated juvenile relative abundance for each system by summing fish caught in all individual 15-min samples over the entire season. Most juvenile fish were alewives; blueback herring constituted no more than 4% of the total number of juveniles in any system. Thus, alewives and blueback herring were analyzed in aggregate.
For each of the 11 systems, each of three weekly samples of juvenile river herring were taken at three different times (1300–1500, 1500–1700, and 2200–2400 hours) to concentrate sampling effort during the afternoon period of peak migration, as indicated by diel samples in this study and by Richkus (1975a), and Richkus and Winn (1979). A randomized block sampling design was used with daily sample time as the blocking factor. Afternoon samples (1300–1500 and 1500–1700 hours) were taken in all 11 systems within 48 h of each other; weekly evening samples (2200–2400 hours), initiated 0.5 h after sunset, were completed for all systems within 96 h of each other. We started sampling in June before any juvenile river herring migrated. Streams that were dry during the regularly scheduled sampling period were recorded as having no migrants for that sampling period. After November 1, the end of the normal migration season (Richkus 1974; Huber 1978), sampling was terminated after no fish were captured for two consecutive weeks. In the two systems in which stream channels were totally dewatered until January (Centerville and Parkers), we sampled for 2 weeks after stream flow resumed to quantify late season migration patterns.
Physical variables
Stream discharge was measured twice per week, immediately after each afternoon juvenile migrant sample, in each of the 11 study systems from April through December 1994 (Table 2). Adjacent to the site at which juvenile river herring were sampled, mean water velocity was measured at 10 equidistant points across a transect. We measured velocity at 0.6 of the depth where stream depth was less than 0.5 m, and at 0.2 and 0.8 depth where stream depth exceeded 0.5 m. Discharge was estimated as Q = Σ(vidiw) where Q is stream discharge, v is mean water column velocity, d is depth, w is 0.1 stream width, and i = the ith point across the 10 transect points (Gordon et al. 1992). Some interesting complexity was observed in the response of the temporally varying abiotic and biotic components we measured. However, to assess which abiotic and biotic factors were most important (the primary goal of this study), we simplified these and other temporal patterns by reducing each response to a single point estimate to describe each system. For the regression analysis, the seasonal mean from June through December 1994 was used as a point estimate for each system.
Pond surface temperatures in each of the 11 study systems were measured at the pond center at 0.5 m depth once per week from May to November 1994 (Table 2). The mean of pond temperatures from June 1 to November 9, 1994, the period when juvenile fish were present in the pond, was used to calculate the point estimate for subsequent univariate and multivariate analyses.
Surface area, depth, and volume are three related morphometric variables that may reflect the amount of suitable freshwater habitat available for both adult spawning and juvenile rearing within the upstream ponds. Maximum pond depth, total surface area, and volume of the headwater ponds in each system were determined from U.S. Geological Survey topographic maps (McMahon et al. 1996) and bathymetric maps produced by the Massachusetts Division of Fisheries and Wildlife (Wetzel 1983; McMahon et al. 1996). Pond volume was estimated by summing the individual volumes of the depth strata on bathymetric maps of the headwater ponds. The volume of each stratum (i.e., the volume between two contour lines; VS) was estimated: VS = (h−3) (A1 + A2 + A1·A2), where h = height of the stratum, A1 = area of the upper surface of the stratum, and A2 = area of the lower surface (Wetzel 1983; McMahon et al. 1996). Because these three morphometric measures do not change significantly through time, point estimates generated by these methods were made once for each system during the 1994 sampling season (Table 2). Because surface area, depth, and volume are related measures, they were not used together as independent variables in any single model. Instead, only volume was used in multiple regression models because we thought this variable best reflected habitat availability and, thus, system size. However, all three variables were used in the initial univariate regressions and to form the system-size principal component.
Once per week at the pond center, transparency was measured to the nearest 0.1 m with a Secchi disk (McMahon et al. 1996; Table 2). Because we expect transparency to have the greatest effect on the larvae and smallest juveniles early in the year (Janssen 1976; Crecco and Savoy 1985), we used the mean transparency for May through July 1994, the period when these young fish were present, as the point estimate for transparency in each study system. We measured the fifth abiotic variable, pH, once with a pH meter at the pond center in July 1994.
Biotic variables
Food is probably important for young river herring using nursery ponds. Although no study has related fish emigration to competition, a change in food availability has been suggested as an emigration cue for juvenile anadromous herring (Vigerstad and Cobb 1978; O'Neill 1980; Yako 1998). Thus, we examined zooplankton density as an indicator of food resources. This first biotic variable was sampled once per week at the pond center, May to November 1994, with a vertical-tow zooplankton net (53-μm mesh, 30.5-cm diameter; Table 2). Samples were preserved in 70% alcohol. Larval and juvenile river herring feed primarily on copepods, cladocerans, and juvenile insects (Hutchinson 1971; Gregory et al. 1983), so only these prey items were enumerated. Because we were primarily interested in whether changes in food availability just before emigration stimulated juvenile emigration, for regression analysis, we used a point estimate or mean zooplankton density in each system during the 3 weeks before peak migration.
To estimate relative abundance of spawning stock from March through June 1994, adult river herring were sampled in each system with a modified weir trap (Orciari et al. 1994) in which we replaced the net funnel with a rigid vertical slot, which reduced sampling bias associated with differences in discharge across systems (Table 2). All streams were sampled twice per week, once in the morning (1000–1200 hours) and once in the afternoon (1300–1500 hours) for 2 h, using a randomized block design in which each of the 11 streams were sampled in both the morning and afternoon within a 72-h block. Although adult river herring can migrate during a range of times, peak adult movements occur primarily during the day (Richkus 1974; Rideout 1974; Richkus and Winn 1979; Jessop and Harvie 1990), the time when we concentrated our sampling effort. Diel migration data from electronic fish counters that were operated in two of our study systems, and concurrent with our sampling, corroborated this pattern (Massachusetts Division of Marine Fisheries, unpublished data). When large numbers of adults (>200) were captured in the first hour of a sample, sampling was terminated and the catch was extrapolated to 2 h to standardize effort across samples (N = 1 of 286 collections). Fifty fish from each sample were examined to determine sex and species composition. Finally, we estimated relative abundance of adult river herring for each of the 11 systems by summing the catch of all the individual samples within a system across the entire sampling season.
Regression analyses
Because multiple factors probably influence abundance of juvenile river herring, we used multiple regressions to assess across-system variation in juvenile river herring relative abundance. Specifically, we built two sets of multiple regression models. The first set of multiple regression models combined variables for which significant univariate relationships existed. The second set of multiple regression models included new variables that were created with principal components.
For the first set of multivariate analyses, we examined combinations of variables for which significant univariate relationships existed. To ascertain the best univariate relationship, juvenile migrant abundance was regressed individually on all nine independent variables (i.e., stream discharge, pond characteristics such as temperature, volume, surface area, depth, transparency, pH, food availability, and spawning stock size) using both linear (X) and quadratic (X2) models. We evaluated models that used untransformed, log10, or square-root-transformed abundance of juvenile river herring. From these options, a single best univariate equation for each variable was selected based on low P, high R2 values and how well the model satisfied parametric assumptions. We then examined multiple regressions constructed from all combinations of the variables that were significant in these univariate regressions. The same transformations and formats that gave the best fit in the univariate regressions (untransformed, log10, and square root; linear or quadratic) were used in this first group of multiple regression models.
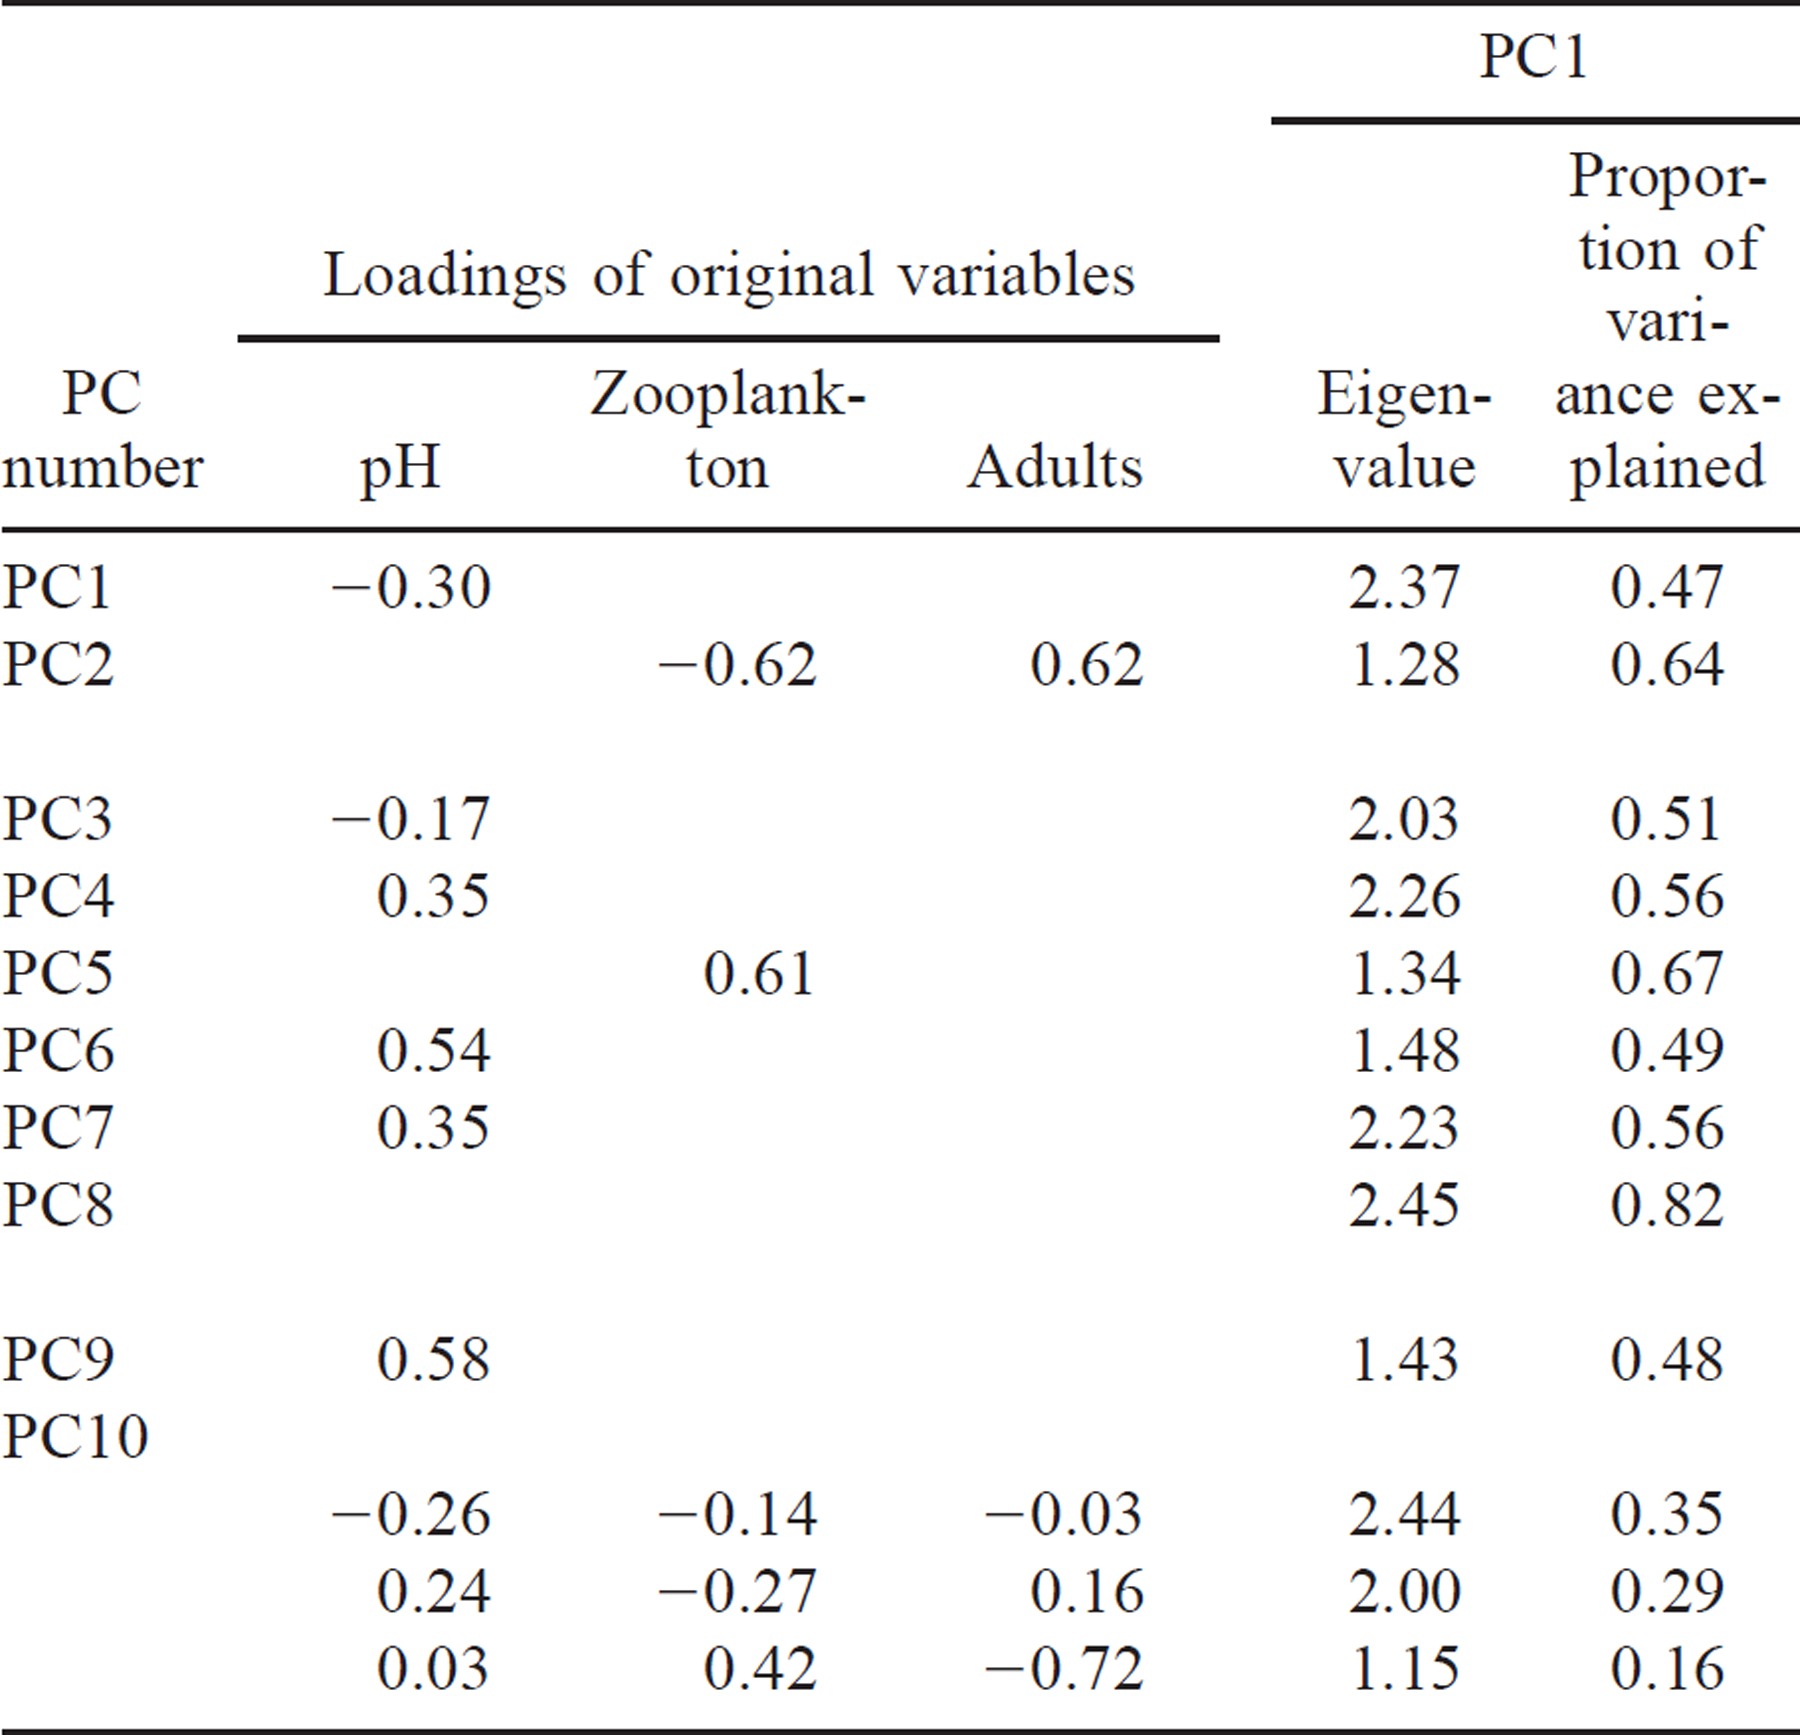
In the second set of multivariate analyses, we tested multiple regressions that incorporated four groups of new variables created using principal components (i.e., abiotic effects, biotic effects, trophic effects, system size effects; Table 3). The original variables used to construct these new principal component variables were selected a priori to create biologically interpretable entities. First, we formulated permutations of a generic “abiotic-effects principal component” that included some combination of stream discharge, pond temperature, pond volume, pond transparency, and pH (Table 3, PC1, PC3–4, PC6–7, and PC9). Second, we combined zooplankton and adults into a “biotic effects-principal component” (Table 3, PC2 or adults only). Third, because factors affecting growth could be especially important for these young fish, we combined two original variables that could influence juvenile river herring feeding success, transparency and zooplankton, into a third new variable that we termed a “trophic-effects principal component” (Table 3, PC5). Fourth, we combined volume, depth, and surface area into a fourth new variable that represented “system size” (Table 3, PC8). Finally, we ran a traditional principal components analysis in which all seven original variables were combined so that we could compare our approach to a more traditional one (Table 3, PC10).

Because an original variable was included only once, either alone or within a single principal component (PC), we created multiple versions of the abiotic- and biotic-effects principal components. The version used depended on other variables in the multiple regression models. For example, when none of the original abiotic variables were used separately or in another PC (Table 4, model 12A), stream discharge, pond temperature, pond volume, pond transparency, and pH were all included in the abiotic-effects PC (Table 3, PC1, abiotic 1), but when a trophic PC composed of zooplankton and transparency was concurrently tested (Table 4b; model 13B), the abiotic-effects PC did not include transparency (Table 3, PC5, abiotic 4). Because of the proposed importance of stream discharge, models were tested that treated the original variable, discharge, both separately and as part of the abiotic-effects PC. For example, multiple regression model 12A (Table 4) examined three effects: discharge, an abiotic-effects PC (pond temperature, pond volume, pond transparency, pH; Table 3, PC3), and a biotic-effects PC (zooplankton and adult abundance; Table 3, PC2), whereas multiple regression model 12B (Table 4) examined only two variables, an abiotic-effects PC (stream discharge, pond temperature, pond volume, pond transparency, pH; Table 3; PC1) and a biotic-effects PC (zooplankton and adult abundance; Table 3, PC2).
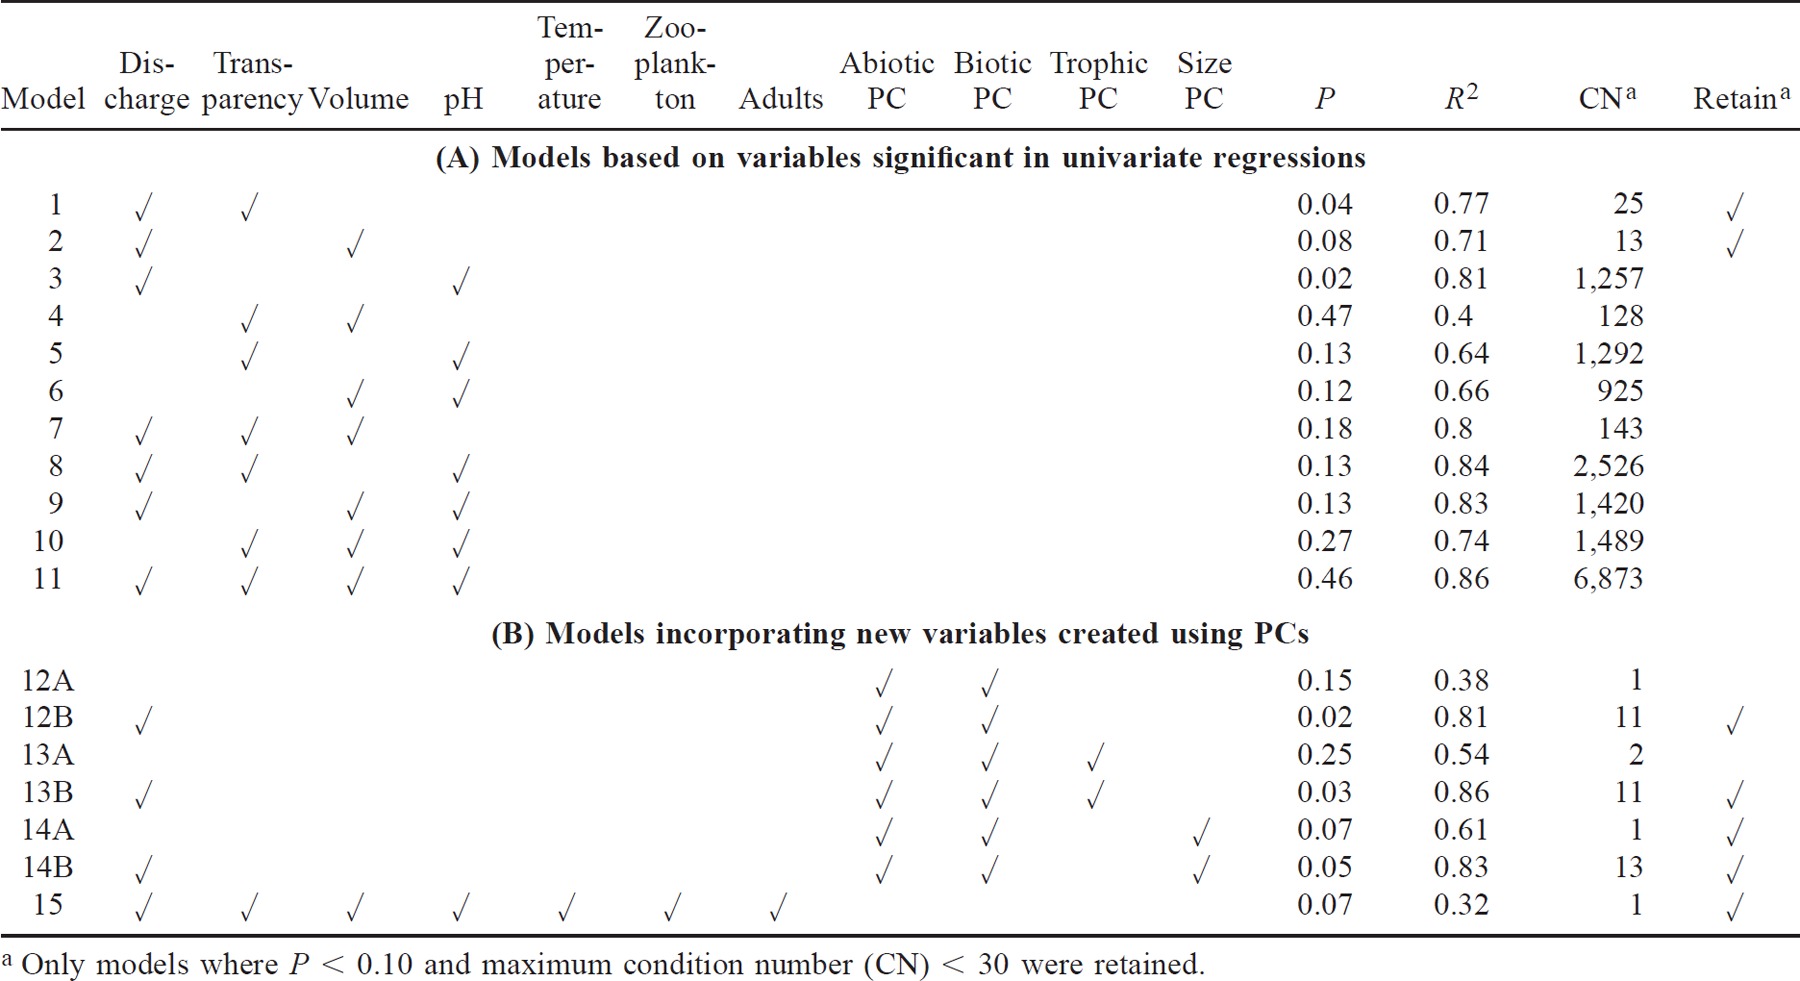
In this second set of multiple regression models, the original data were used for all PCs except zooplankton, which was log-transformed. The new variable then consisted of the first PC axis (see Table 3 for loadings of the original variables in each PC). In the second set of multiple regression models, a linear format was used for all multiple regressions, except when discharge was used as a separate variable; in these models, a quadratic format was used for discharge. In both the first and the second set of multiple regression models, the response variable, juvenile river herring abundance, was log-transformed. In all multiple regressions, models with condition numbers greater than 30 were rejected to eliminate all multiple regression models affected by multicollinearity of the independent variables. (Philippi 1993). In both the first and second sets of multiple regressions, we used a liberal alpha of 0.10 because pattern detection was the goal of this study (Scheiner 1993).
Results
Diel Patterns of Juvenile Migration
Our 11 study systems had pond volumes and surface areas (Figure 2A, B) within the range of Massachusetts' reference systems with anadromous herring. In the two systems that were sampled throughout the diel migration, fish moved throughout the daylight hours, 0600–2100 hours, but not at night (Figure 3A, B). In Herring River (Bourne), 81% of the juvenile emigration occurred in the afternoon between 1200 and 1500 hours and peaked at 1300 hours; in the Mashpee River, 55% of the juvenile emigration was between 1200 and 1500 hours and peaked between 1200 and 1300 hours (Figure 3). Because most juveniles in these two systems migrated in the afternoon, we believed that our weekly sampling protocol concentrating sampling effort between 1200 and 1600 hours would provide comparable relative abundance estimates across systems.

Pond volume and (B) surface area for Massachusetts coastal systems with river herring runs. Systems used in our study are indicated with cross-hatch and arrows and span the range of values
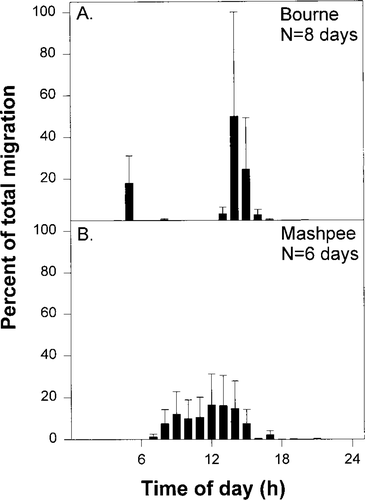
Diel patterns of juvenile river herring abundance, as a percentage of the total migration, in two representative streams—(A) Herring River (Bourne) and (B) Mashpee River—during the 1994 migration season. Juvenile river herring were collected from each stream by sampling with nets set hourly for 24 h every other week. Data are hourly means (±SE)
Juvenile Relative Abundance and Seasonal Migration
Across all systems, migrating juvenile river herring were first observed moving downstream in late June and early July (Figure 4A–J). In the majority of systems, the timing of the early summer peak consistently occurred within the first sampling month, (late June through early July; Figure 4B–F, H, J). The timing and extent of the late fall peak was more variable. When present, this second peak typically occurred within a 6-week period between late October and December (Figure 4B, E, G, I), although it was observed as early as mid-September (Figure 4D). The end of emigration also varied considerably; in most systems it was in September or October (Figure 4A, C, D, G, J), but in some it was as early as July (Figure 4F, H) or as late as December (Figure 4B, E, I).
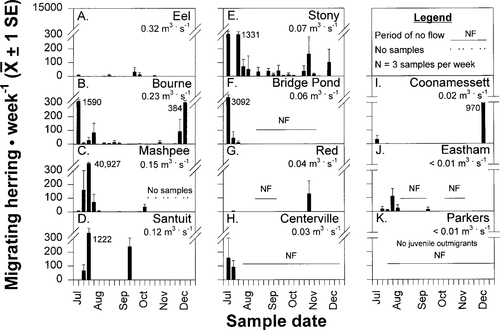
Patterns of juvenile river herring emigration (numbers of fish through time) observed through the 1994 migration season in 11 small to medium-sized coastal Massachusetts streams that varied in discharge. High flows (as indicated by number below the system name) were in (A) Eel, (B) Herring (Bourne), (C) Mashpee, and (D) Santuit rivers; medium flows were in (E) Stony Brook, (F) Bridge Pond Creek, (G) Red Brook, and (H) Centerville River; and low flows were in the (I) Coonamessett, (J) Herring (Eastham), and (K) Parkers rivers. Although sampling was started in June, no fish emigrated before July, so June data are not shown. Each bar represents the weekly mean ± SE (N = 3); note the break on the y-axis at 300. The peak of weekly means is the number adjacent to the bar
Numbers of emigrating fish observed each week also varied substantially across systems, ranging from zero (Figure 4K), to a few (Figure 4A), to hundreds (Figure 4G–J), to thousands (Figure 4B–F). For the regression analysis, all juvenile downstream migrants observed in samples throughout the entire season were summed to provide a single point estimate for each sample system (Figure 5A). For our 11 study systems, total juvenile river herring numbers observed over the sampling season varied from none in Parkers River to 135,470 in Mashpee River (Figure 5A); 6 systems had low juvenile river herring abundance (<1,000 herring), 4 systems had moderate numbers of herring migrants (1,000–5,000; Figure 5A).
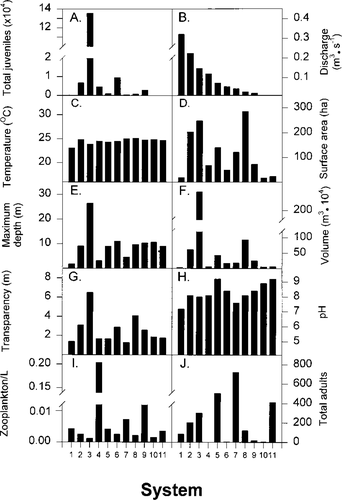
Variation in select abiotic and biotic variables across 11 small to medium-sized coastal Massachusetts streams. System numbers (see Table 1 for names) are in descending level of discharge (1= highest, 11= lowest). Shown are (A) total number of juvenile emigrants, (B) mean stream discharge, (C) mean pond temperature, (D) pond surface area, (E) maximum pond depth, (F) pond volume, (G) mean pond transparency, (H) pond pH, (I) mean pond zooplankton density before juvenile river herring emigration (zooplankters/L), and (J) total number of adult herring
Discharge
Discharge was variable through time and across systems. As evaluated by seasonal means, the Eel, Herring (Bourne), Mashpee, and Santuit rivers had continuous, high discharges throughout the study (Figure 6A–D). Of the seven remaining streams with medium (Figure 6E–H) to low discharges (Figure 6I–K), only Stony Brook (Figure 6E) and Coonamessett River (Figure 6I) had water in the stream channel throughout the juvenile emigration period. Bridge Pond Creek (Figure 6F), Red Brook (Figure 6G), Centerville (Figure 6H), Herring (Eastham; Figure 6J), and Parkers (Figure 6K) rivers each had 1–2 dry sampling periods during the emigration season. Thus, both timing (Figure 6A–K) and magnitude (Figures 5B, 6) of discharge varied across our 11 coastal study systems.
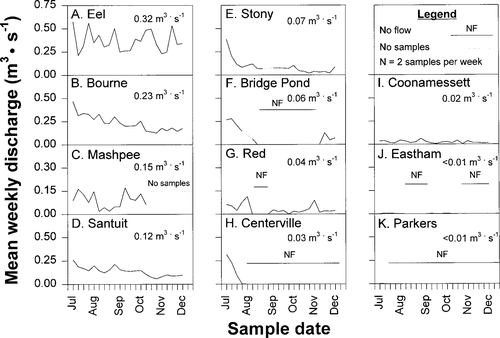
Means of weekly discharge samples (twice per week from June to December 1994) in 11 small to medium-sized coastal Massachusetts streams: (A) Eel, (B) Herring (Bourne), (C) Mashpee, and (D) Santuit rivers; (E) Stony Brook; (F) Bridge Pond Creek; (G) Red Brook; and the (H) Centerville, (I) Coonamessett, (J) Herring (Eastham), and (K) Parkers rivers. Mean discharge for the entire study period is below each system name. No samples were taken in Mashpee after September 20; discharges in the Herring (Eastham) and Parkers rivers were too low to be visible at this scale
Temperature, Habitat, Transparency, and pH
Pond surface temperatures varied through the sampling season. For all systems, the highest temperatures, 27–29°C, were recorded in July and the lowest, 18–20°C, in October. Point estimates, calculated as seasonal means of temperature, varied by only 2°C across systems (Figure 5C); Eel River was the coldest (mean 23.1°C), and the Herring River (Bourne) was the warmest (mean 25.1°C).
Available freshwater pond habitat was quantified by surface area (Figure 5D), depth (Figure 5E), and volume (Figure 5F). These three habitat variables differed across systems. For example, the Eel and Santuit rivers, Bridge Pond Creek, and the Coonamessett, Herring (Eastham), and Parkers rivers (Figure 5D, systems 1, 4, 6, 9, 10, 11) had small ponds with surface areas less than 75 ha. Stony and Red brooks had intermediate-sized ponds (Figure 5D, systems 5, 7), whereas Herring (Bourne), Mashpee, and Centerville (Figure 5D, systems 2, 3, 8) had large ponds with surface areas exceeding 200 ha. The maximum pond depth in 10 systems was less than 12 m (Figure 5E, systems 1–2, 4–11), and 3 of these were extremely shallow with maximum depths less that 5 m (Figure 5E, systems 1, 4, 7). The remaining system, Mashpee River, was relatively deep (26.5 m; Figure 5E, system 3). As a result of these surface area and depth measurements, eight systems had volumes less than 50 × 104 m3 (Figure 5F, systems 1, 4, 5, 6, 7, 9, 10, 11). Two systems, the Herring (Bourne) and Centerville (Figure 5F, systems 2, 8) rivers, had intermediate volumes (50 ≤ V ≤ 100 × 104 m3), and one system, the Mashpee River, had a pond volume exceeding 200 × 104 m3 (Figure 5F, system 3).
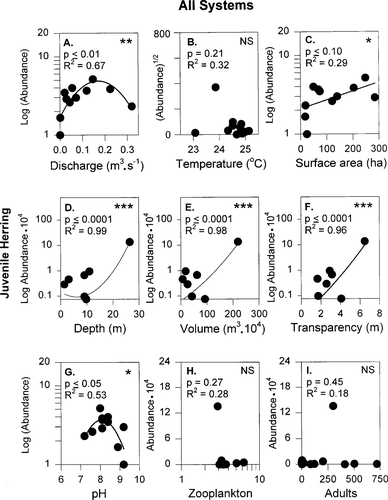
Univariate regressions that, using all systems (N = 11), examine the relationship between relative abundance of juvenile river herring emigrants over the season and (A) mean discharge (Y = −107.8x2 + 36.6x + 1.5), (B) temperature (Y = −131.9x2 − 6,307x − 75,236), (C) surface area (Y = 0.008x + 2.1), (D) depth (Y = 328.7x2 − 3,997.8x + 10,339), (E) volume (Y = 4.24x2 − 345x + 5,741.2), (F) transparency (Y = 7,997x2 − 38,281x + 42,811), (G) pH (Y = −2.0x2 + 32.3x − 126.9), (H) zooplankton (Y = 0.5x2 − 4.4x + 11.9), and (I) adults (Y = −0.3x2 + 225.6x − 1,062). Plotted here are the best fits of linear or quadratic equations using untransformed, log-transformed, or square-root-transformed data. Asterisks indicate level of significance: *P < 0.10, **P < 0.01, ***P < 0.001; NS indicates nonsignificance (P > 0.10)
Mean transparency also varied across the 11 study systems (Figure 5G). The lowest mean transparency, 1.3 m, occurred in Red Brook (Figure 5G). In 6 of the 11 systems, mean transparencies were less than 2 m, and in 3 others, transparencies were between 3 and 4 m. The highest transparency, 6.5 m, was observed in Mashpee River. Pond pH also varied across systems, although in all 11 study systems, pH was above 7 (Figure 5H). The lowest pH was in Eel River (7.2) and the highest was in Stony Brook and Parkers River (9.2). Most study systems had measurements of 7.5–8.5.
Biotic Variables
Mean zooplankton density also varied across systems and ranged from 0.864 zooplankers/L in Mashpee River (Figure 5I, system 3) to greater than 150/L in Santuit and Coonamessett rivers (Figure 5I). The remaining eight systems ranged from 1.2 to 5.4 zooplankters/L. The number of adult river herring collected over the spawning period varied from 0 in Santuit River to 721 in Red Brook (Figure 5J). Thus, the abundance of juvenile river herring and all nine variables, representing seven abiotic and biotic factors, exhibited a range of values across the 11 study systems.
Univariate Relationships
When all systems were examined, significant univariate relationships existed between juvenile river herring abundance and discharge, surface area, depth, volume, transparency, and pH (Figure 7; Table 4). Specifically, when stream discharge was lowest (<0.02 m3/s), few fish migrated from the system. More river herring migrated as discharge increased up to a peak at 0.15 m3/s. As discharges exceeded 0.2 m3/s, fewer fish were collected in these small-channeled streams (Figure 7A). In addition, numbers of juvenile river herring migrants increased directly with surface area, depth, volume, and transparency (Figure 7C–F). Relative abundance peaked at a pH of 8, with higher and lower values producing fewer fish (Figure 7 G).
Multivariate Relationships
In the first set of multiple regression models, we examined 11 possible multivariate combinations of the four unrelated variables that were significant in univariate relationships (discharge, transparency, volume, and pH; Table 4). For all variables, quadratic equations with log-transformed juvenile abundance were used (X, X2) because this format provided the best fit in most univariate regressions. Of the 11 multivariate models, model 1 (discharge and transparency) and model 2 (discharge and volume; Table 4) were significant, noncollinear, and explained 77% and 71%, respectively, of the variance in juvenile river herring abundance across systems. In the second set of multiple regression models using PCs that represented biologically interpretable variables, five multiple regression models (Table 4) were significant and noncollinear: (1) model 12B or discharge and abiotic and biotic effects; (2) model 13B or discharge and abiotic, biotic, and trophic effects; (3) model 14A or abiotic, biotic, and system-size effects; (4) model 14B or discharge and abiotic, biotic, system-size effects; and (5) model 15, the traditional PC analysis.
Discussion
Diel Patterns of Abundance
In our systems, diel juvenile river herring emigration peaked around 1200–1400 hours, a pattern observed in other small New England systems (Cooper 1961; Kissil 1974; Richkus 1975a; Yako 1998). Similarly, in both of our study systems for which diel patterns were quantified, maximum movement occurred in the early afternoon. However, some notable across-system variations were observed. For example, in Herring River (Bourne), some juvenile river herring also moved at dawn; in Mashpee River, fish also moved throughout the morning hours. Culverts, bridges, and low-head dams (some with fishways) are common obstacles in many small coastal New England streams (Cooper 1961; Richkus 1975a; Quinn 1994), and, in combination with other factors (e.g., system morphometry), can modify diel emigration patterns of juvenile river herring across systems. Overall, though, in our two representative study systems, river herring moved primarily during the afternoon when our sampling was concentrated.
Juvenile Emigration Patterns
Because juvenile river herring do not overwinter in these systems, the numbers emigrating represent system-specific relative abundance. We observed several consistent trends in seasonal emigration patterns in our study systems. In most of our study systems, large numbers of fish emigrated during an initial, early summer peak that appeared to be synchronous across systems. Typically the majority (>80%) of fish migrated in one or two eruptive peaks lasting several days, interspersed with long periods when few or no fish were seen; others have also observed river herring emigrating in waves (Cooper 1961; Kissil 1974; Richkus 1975a; Huber 1978). We noted some differences in movement across systems. This variability in emigration across systems, as well as variation across seasons and years, has been attributed to decreases in temperature (Richkus 1975b), precipitation and discharge (Richkus 1975b; Huber 1978; Yako 1998), lunar phases (O'Leary and Kynard 1986; Yako 1998), and changes in food availability (Yako 1998). Although seasonality does affect movement patterns, our cumulative, single-point index of abundance that sums all fish caught throughout the season should allow us to compare relative abundance and sources of variation across systems.
Discharge
Discharge regime can influence fish community structure. Specifically, the functional organization of stream fish communities can be related to hydrological variability (Poff and Allan 1995), and invertebrate and fish communities in headwater streams change with altered stream flow regimes (Schlosser and Ebel 1989). In addition, species life stages can be assigned to habitat preference guilds based on depth and flow (Aadland 1993). In our study systems, the timing and magnitude of discharge in the stream strongly influenced emigration patterns and the relative abundance of juvenile river herring. Complete dewatering of the outlet streams in several systems prevented the migration of juveniles throughout the late summer and fall. When young river herring cannot exit the system, patterns of discharge will effect juvenile relative abundance via both density-independent effects and density-dependent mortality experienced by juveniles unable to exit the upstream spawning and rearing grounds.
In this study, the five significant multiple regressions that included discharge as a separate variable suggest that discharge is an important factor influencing variation in the relative abundance of juvenile river herring across smaller systems. Other investigators have also noted that abundance and movement of river herring is reduced at low discharge, increases directly with discharge, and peaks during periods of elevated discharge and rainfall (Cooper 1961; Kissil 1974; Richkus 1975a; Huber 1978; Meador et al. 1984; West et al. 1988; Jessop 1994). Our finding that extremely high discharge can adversely influence juvenile emigration was supported by other studies of river herring (Richkus 1975b; Jessop 1994) and other anadromous fish (Crecco and Savoy 1984; Crisp 1991; Crisp and Hurley 1991). In laboratory experiments, juvenile river herring avoid higher water velocities (>10 cm/s), especially in narrow stream channels (Gordon et al. 1992). The association between high or fluctuating discharge and decreased abundance of adult and juvenile blueback herring (Meador et al. 1984; West et al. 1988) may explain the depressed river herring relative abundance for the Eel River, the stream with the highest and most variable mean discharge.
In large rivers, however, the effects of discharge may differ; the frame of reference in this study was extremely small relative to the variety of channel sizes and discharges possible throughout the river herring's geographic range. Larger channels can transport greater volumes of water per unit time without substantial increases in velocity (Gordon et al. 1992), and streams with mean discharges greater than 0.15 m3/s may experience increased abundance of juvenile river herring if the stream channel is large (cross sectional area >1.5 m2). Furthermore, large systems rarely become completely dewatered, and downstream migrants in these systems may be less susceptible to predation and stranding during low discharge periods. However, in our small coastal stream systems, discharge is a key factor influencing variability in juvenile river herring abundance and emigration.
Temperature
In other systems, temperature plays an important role in the distribution and abundance of anadromous stream fish, especially by influencing when adult fish can first enter the river and when the last juveniles can leave in the fall. Others have found that, depending on system-specific conditions, temperature may (Richkus 1974; Henderson and Brown 1985) or may not (Kissil 1974; Yako 1998) be related to river herring migration and distribution patterns. In our study, no significant relationship was found between pond surface temperature and juvenile river herring abundance. This trend probably relates to the close geographic proximity of the 11 study systems and the consequent narrow range of mean temperatures tolerated by the juvenile river herring. During our spring–fall study season, water temperatures never dropped below 17°C; thus, juveniles were probably unaffected by cold temperatures before or during emigration. The upper lethal temperature for juvenile alewives is about 30°C (McCauley and Binkowski 1982), and although surface water temperatures in the ponds briefly exceeded this temperature (two peaks of 28–30°C between July 10 and August 31), all study systems were affected equally. Furthermore, the effect of high temperatures may have been minimized because most juveniles left the pond in the early migration peak before extremely high temperatures were reached. Temperature probably influences juvenile river herring in some freshwater systems by controlling spawning duration (Michaletz 1997), by affecting egg and larval development rate (Kellogg 1982), by altering predation intensity (Fuiman 1991), and by killing juveniles that attempt to overwinter in ponds. We did not identify temperature as a source of variation in juvenile river herring abundance across systems, probably due to the regional scale of our study.
Habitat
For juvenile alosids, spawning and rearing habitat may influence juvenile abundance (Rulifson 1994). In fact, New England fisheries management agencies use surface area of freshwater nursery areas as an estimate of potential juvenile abundance (S. Gephard, CT Department of Environmental Protection, personal communication; Gibson 1994). For other anadromous alosids, a relationship between habitat quantity and fish abundance exists. For example, freshwater habitat loss has been associated with the decline of American shad A. sapidissima in Maine (Moring 1993). Similarly, we found that the quantity of freshwater habitat provided insight into sources of variations in juvenile river herring abundance across systems. However, specific mechanisms by which system size influences river herring relative abundance are uncertain, and it may be useful to consider a wider range of values (Folt et al. 1998).
Trophic Effects
In our study, transparency and a trophic effect (i.e., transparency and zooplankton) were positively related to juvenile river herring abundance. Much of the literature on alewife and blueback herring foraging focuses on landlocked adults. Although differences exist in the morphology of juveniles and adults and between the anadromous and landlocked systems, many similarities also exist. Both juvenile and adult alewives are efficient, obligate zooplanktivores and probably have an intense effect on the zooplankton resource. In addition, in both systems, a premium is set on feeding efficiency. Because the freshwater habitat functions primarily as a nursery area, growth is a major objective for juveniles. Furthermore, Yako (1998) demonstrated that food availability may affect emigration timing.
In general, river herring consume copepods, cladocerans, juvenile insects, and larval fish (Burbidge 1974; Davis and Foltz 1991) and can affect zooplankton abundance and size structure (Brooks and Dodson 1965; Crowder et al. 1987). Increased transparency and variations in zooplankton densities could have several different effects on juvenile river herring: (1) low transparency caused by high turbidity can impair the ability of these zooplanktivores to search for food (Burbidge 1974; Janssen 1976; Miner and Stein 1996) or have adverse physiological consequences related to water quality (Aprahamian and Aprahamian 1990) and disease (Schubel and Wang 1973), and (2) transparency may reflect trophic status of the system. Others have found relationships between low transparency and high primary productivity (Drenner et al. 1986; Dettmers et al. 1996); however, this did not appear to be so in our study systems. Reduced transparency also may be linked to an increase in inedible algae, a condition that might impair juvenile river herring feeding, growth, and survival. In a related study, river herring left the rearing pond when a blue-green algae bloom developed, suggesting that reduced transparency associated with this change in phytoplanton species composition may trigger emigration (Yako 1998). Size may be important in juvenile feeding relationships, but the relationship between numbers of river herring and food levels can also provide insights into variation in numbers of river herring across systems. Although the relationship between productivity, transparency, and river herring cannot be discerned in our data, reduced feeding success and adverse physiological consequences could contribute to variations in juvenile river herring numbers.
Hydrogen Ion Activity (pH)
Juvenile river herring relative abundance was significantly related to pH. Abundance peaked at a pH of 8.2, similar to an abundance peak at a pH of 9.1 observed for fathead minnows Pimephales promelas (McCarraher and Thomas 1968). Between pH values of 7.2 and 8.2, increases in river herring numbers may be related to changes in system productivity. Alkaline conditions (≤160 ppm) have been positively correlated with increased biomass of fish (Hayes and Anthony 1964), and high pH values are associated with calcareous, highly productive systems (Wetzel 1983). Above a pH of 9.2, alkaline values are toxic to most fish and aquatic invertebrates (Thurston et al. 1979; Bergerhouse 1992). Adverse effects of low pH have been well-described for stream fish in general (Gagen et al. 1993 1994); for river herring, acidic episodes (pH of 5.5–7.4) may be an important source of early-stage mortality for fish that spawn in poorly buffered habitats (Klauda and Palmer 1987). These well-described adverse effects, however, occurred at pH values much lower that the neutral to alkaline values in our study systems (7.2–9.2). Although the exact mechanism for the impact of pH on river herring is unknown, because of its associations with alkalinity and productivity, pH appears to contribute to variations in juvenile river herring relative abundance across systems.
Adult Abundance
No relationship was observed between adult and juvenile river herring for either univariate or multivariate regressions in our analyses. Although periodicity also exists in adult movements, peak movement of adults occurs during the times we sampled, and it is unlikely that we missed the migration of large numbers of adults in our sampling regime. Although a stock–recruitment relationship was observed for river herring in a large Canadian river (Jessop 1990) and weak relationships between spawning stock and juvenile migrant alewives occur at low stock levels (Havey 1973; Walton 1987), most studies have had limited or no success in showing a relationship between adult and juvenile abundances (Brown 1972; Crecco and Savoy 1984; Henderson and Brown 1985; Gibson 1994; Jessop 1994). River herring are highly fecund: 50,000–46,000,000 eggs/female (Rothschild and DiNardo 1987; Jessop 1993). So, even a few adults can produce juveniles well in excess of the number that can survive (Loesch 1987). As a consequence, it is unlikely that adult abundance is the critical determinant of variation in juvenile numbers across systems for these exceptionally fecund clupeids, except at the lowest adult densities.
Approach
Region-specific models based on responses of many streams through one season in which each system acts as an experimental unit are useful because this approach has generality and allows statistical control of confounding variables. Multiple regression provides one analysis tool for examining the relative importance of various factors in determining fish distribution and abundance.
Multiple regression models can be constructed in a number of ways. One is to test all possible combinations. This approach was rejected because, with seven independent variables, the 120 simultaneous tests, including a number of biologically uninterpretable combinations, would produce a prohibitive overall experimentwide alpha (0.05–0.10 × 120). For the same reasons we also rejected a second approach—forward, backward or stepwise regression—in which variables are added and removed from multiple regression models based on specific decision rules. A third approach that we implemented was to use all combinations of the variables in the multivariate analysis for which significant univariate relationships existed. This provided interpretable insights and controlled the overall experimentwide alpha. A fourth approach, PCs, analyzes complex data sets in which numerous variables can be interrelated. Unfortunately, they are often difficult to interpret biologically.
We adopted the approach to PC construction suggested by Philippi (1993) because we believed that PCs to which we could not attribute clear biological meaning were not useful. In this approach, PCs are created a priori, based on biological hypotheses. Thus, by identifying a limited number of biologically interpretable models, we reduced the overall experimentwide probability of committing a type I error (Philippi 1993). Although our approach did not necessarily predict better than the more traditional PC analysis, it allowed us to identify general classes of models that predicted variation in juvenile abundance across systems. From these, we could identify key variables that played an important and recurring role. For example, models with discharge as an independent variable were most often significant, suggesting that this is a critical variable in determining juvenile river herring abundance. Clearly other approaches could have been taken, but ours yielded unique insights while maintaining consideration for the statistical constraints of a large, complex ecological data set.
Analysis Issues
Pattern detection was the goal of this study; therefore, a liberal alpha of 0.10 was used without a Bonferroni correction. In the first set of multiple regressions, we evaluated all combinations of four variables in 11 multiple regression models (experimentwide α = 0.1 × 11). In the second set of multiple regression models, we evaluated seven select multiple regression models (experimentwide α = 0.1 × 7). Although our experimentwide alpha was high, it was substantially less than had all combinations of original and new variables been examined through forward, backward, or stepwise regression techniques to blindly test all combinations of variables.
A single point for a season is simplistic, given the temporal variability observed in some of the factors we examined. In this analysis, we were primarily interested in looking for broad differences in abiotic and biotic factors across systems. Here, we reduced the across-season patterns to a mean or a sum, an initial simplification allowing us to identify a subset of factors for additional focus. After the number of potentially interesting abiotic and biotic factors were reduced and explored in a collective manner, the influence of temporal trends of selected factors could be examined in more focused studies.
Management Implications
Resource managers making decisions pertaining to water allocation or land-use change need to consider the importance of stream discharge on juvenile river herring survival, as well as the importance of seasonal patterns of juvenile emigration. Habitat-flow models have been criticized for their lack of substantiated model assumptions (Mathur et al. 1985; Zorn and Seelbach 1995). Consequently, our approach provides a useful way to gain foundational, regional-scale knowledge of a set of otherwise complex ecological systems. Specifically, where possible, the manipulation of pond outflows can improve the egress of juvenile river herring. Freshwater habitat conditions affect relative abundance, and certain aspects of this habitat can be manipulated by fisheries managers. The impact of both system size and trophic relationships on variations in juvenile river herring can be tested for a wider range of values via future field or laboratory experiments. Understanding the factors that determine the success of juvenile river herring in freshwater is critical for understanding the variability in abundance across systems and ultimately for protecting and enhancing the freshwater habitat for declining anadromous fish populations.
Acknowledgments
This project was funded by the Massachusetts Division of Marine Fisheries as administered through the Massachusetts Cooperative Fish and Wildlife Research Unit and the Department of Natural Resources Conservation at the University of Massachusetts at Amherst. We thank Ken Reback and Phil Brady of the Massachusetts Division of Marine Fisheries for sharing their information and advice. Randy Fairbanks, Paul Diodati, and Leigh Bridges provided administrative support without which this project could not have been completed. Special thanks go to John Boreman, Jack Finn, Alex Haro, Francis Juanes, Gerard Buynak, John Dettmers, and three anonymous reviewers for comments on the manuscript draft. We are also grateful for the help of Dan Parkins, Scott Ward, Jennifer Gilson, John Bowe, Sarah Wolaver, Leilia Knight, Lisa Yako, Margo Schulze, Cara Campbell, Fred Scharf, Gabe Gries, Paul Nitschke, Kevin Whalen, and Ken Sprankle. The Massachusetts Cooperative Fish and Wildlife Research Unit is jointly sponsored by the U.S. Geological Survey, Biological Resources Division; The University of Massachusetts Department of Natural Resources Conservation; the Massachusetts Division of Marine Fisheries; the Massachusetts Division of Fisheries and Wildlife; and the Wildlife Management Institute.


