Population Statistics for Paddlefish in the Wisconsin River
The Minnesota Unit is jointly sponsored by the U.S. Geological Survey, Biological Resources Division, the University of Minnesota, the Minnesota Department of Natural Resources, and the Wildlife Management Institute.
The Georgia Unit is jointly sponsored by the U.S. Geological Survey, Biological Resources Division, the Georgia Department of Natural Resources, the University of Georgia, and the Wildlife Management Institute.
Abstract
Although paddlefish Polyodon spathula are protected in Wisconsin and Minnesota, limited information exists on the status of populations in the upper Mississippi River. Paddlefish populations in the upper Mississippi River probably have never fully recovered from declines that occurred in the late 1800s and early 1900s following habitat loss and extensive fishing. In our study, we estimated population size, size and age structure, and mortality for a paddlefish population in the Wisconsin River, a tributary of the upper Mississippi River, during 1993 and 1994. We tagged 337 paddlefish and recaptured 33. Unequal probability of capture and small sample sizes violated the assumptions of published population models. To improve interpretation of results, data were adjusted for assumption violations, and estimates were generated using three widely used models (modified Jolly–Seber, adjusted Petersen, and Chapman's modified Schnabel). Based on Chapman's modified Schnabel adjusted for mortality and estimated ages of 5–23 years for all paddlefish sampled, we estimated the population to be 1,353 paddlefish. Eye-to-fork length for paddlefish ranged from 64 to 125 cm. Using catch-curve analysis, we estimated annual mortality to be 26.7%. Size structure and age structure data indicated weak year-classes for the 4–6 years preceding our sampling. Monitoring of the Wisconsin River paddlefish populations should continue because of the relatively high concentration of fish with the potential as a source population; investigations should also be implemented on other large tributaries and main stem of the upper Mississippi River.
Introduction
A review of data on paddlefish populations across their former range by the U.S. Fish and Wildlife Service (USFWS) revealed gaps in our knowledge of their population status. Allardyce (1992) found limited data on population dynamics and harvest rates, particularly for states bordering the upper Mississippi and Ohio rivers. Our study was initiated following a petition in 1989 to list the paddlefish as a threatened species under the Endangered Species Act (ESA; Allardyce 1992). As a result of the petition, the paddlefish was elevated to a Category-2 species under the ESA, and the USFWS added them to Appendix II of the Convention on International Trade in Endangered Species because of concern about paddlefish roe in the international caviar trade (Allardyce 1992).
In addition to the status review by the USFWS, three surveys on the status of paddlefish across their native range highlight the limited information available on population dynamics (Gengerke 1986; Graham 1997; Hesse and Carreiro 1997). At least four salient points resulted from these surveys. Populations were considered to be declining in Iowa, Minnesota, Arkansas, Mississippi, and South Dakota (Hesse and Carreiro 1997). Many respondents did not know the status of paddlefish within their states (Hesse and Carreiro 1997). In 11 states where paddlefish had not been extirpated and where paddlefish fisheries have been closed (Graham 1997; Hesse and Carreiro 1997), data available for determining the status of current paddlefish populations may be extremely limited. Population status was unknown in all or portions of Illinois, Missouri, Mississippi, Montana, Ohio, and Wisconsin (Hesse and Carreiro 1997).
In an effort to adequately assess paddlefish population status throughout the Mississippi River basin, the Mississippi Interstate Cooperative Resource Association (MICRA) initiated a basinwide, coded-wire-tagging study in 1995 (Grady and Conover 1998). Data appear adequate to ascertain status of several paddlefish populations, yet data from some areas, including Minnesota and Wisconsin, are still rather limited (Grady and Conover 1998).
Undertaking a population study of paddlefish in the upper Mississippi River basin is difficult for several reasons. Individual paddlefish exhibit long-distance, directional movement to and from select sites within river systems (Combs 1982; Alexander and McDonough 1983; Southall and Hubert 1984; Hoffnagle and Timmons 1989; Grady and Conover 1998). This extensive movement violates assumptions of both closed and open population models. Because paddlefish are obligate ram ventilators and can grow to large sizes, capture and handling is difficult and can induce mortality (Burggren and Bemis 1992; Lyons 1993); therefore, where paddlefish do occur in sufficient numbers to conduct a mark–recapture study, sampling intensity is limited due to risk of sampling mortality. Finally, paddlefish are listed as threatened in Minnesota and Wisconsin, making accurate age data and mortality estimates difficult to obtain. The currently accepted method for aging paddlefish—counting annuli in a cross section of the lower jaw (Adams 1942; Meyer 1960)—compromises obtaining data from living fish, so lower jaws are usually collected from moribund samples or carcasses.
We examined the paddlefish population below the Prairie du Sac Dam on the lower Wisconsin River, believed by Lyons (1993) to be sufficiently large for reliable population estimates. Specific objectives were to estimate population size, assess size and age structure, and estimate annual mortality. Estimates for mortality and population size were calculated with published methods. Additional estimates for population size are calculated with slight modifications of published methods to compensate for limits in our data.
Methods
Population estimates
Paddlefish were collected from the Wisconsin River at the tailwater of the Prairie du Sac Dam, a hydropower facility and the first dam upriver from the confluence with Mississippi River (148 km upriver). Lyons (1993) calculated that the number of paddlefish below the dam could exceed 3,000. Large concentrations of paddlefish such as the one found at Prairie du Sac are unknown, or at best, uncommon in the Wisconsin and Minnesota region of the upper Mississippi River and may be an important source of paddlefish production for the upper Mississippi River, particulaly in Minnesota and Wisconsin. Given the extensive movements exhibited by paddlefish (Combs 1982; Alexander and McDonough 1983; Southall and Hubert 1984; Hoffnagle and Timmons 1989; Grady and Conover 1998), these fish probably contribute to a broadly distributed population in the upper Mississippi River.
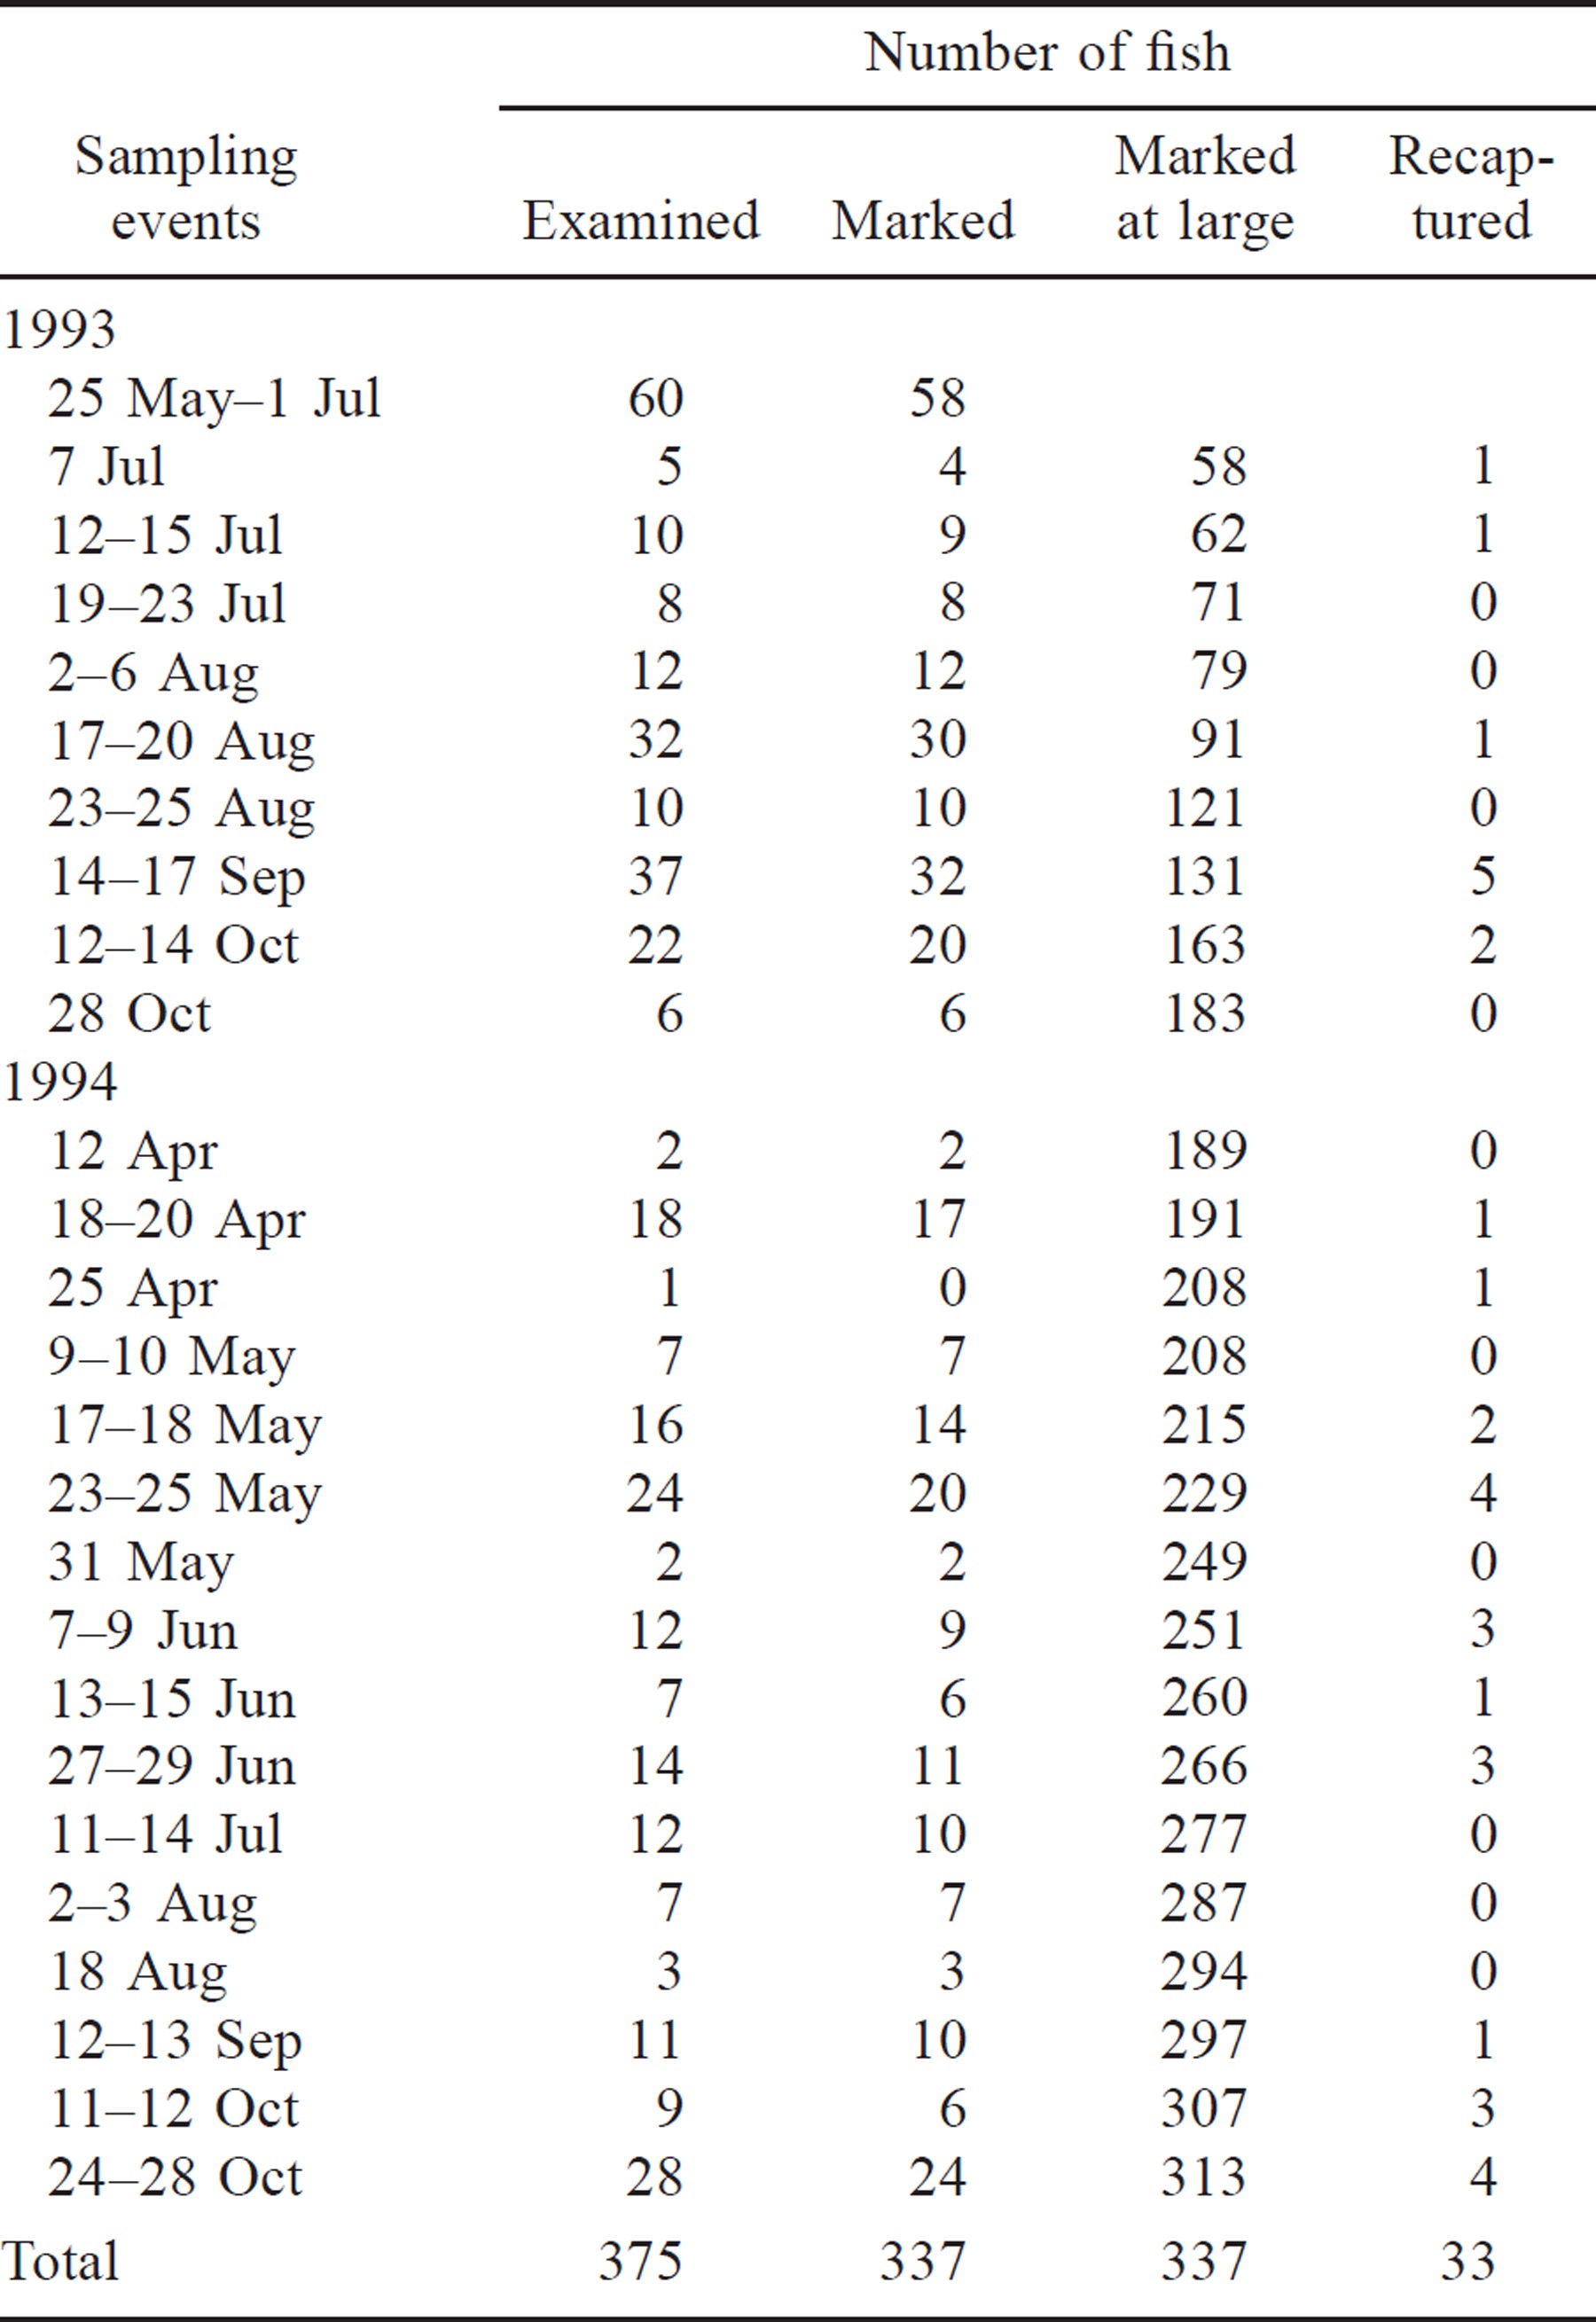
Sampling events of 1–5 d (mean = 2.7 d) were conducted on 12 occasions (the first two are combined because there were no recaptures) during May–October 1993 and on 16 occasions during April–October 1994 (Table 1). Gill-net mesh sizes of 127–203 mm (bar measure) are recommended for paddlefish population and size structure studies and are capable of catching small (eye-to-fork length < 50 cm) paddlefish (Paukert and Fisher 1999). In 1993, paddlefish were sampled with floating, drifting trammel nets (30.5 × 2.4 m; bar mesh of center walls = 102, 127, or 152 mm; bar mesh of outer panels = 457 mm). Nets were drifted for 5–7 min and sampled a 200–300-m reach of river immediately below the powerhouse. In 1994, fish were sampled with drifting and stationary floating trammel nets, both with the same dimensions as in 1993. Stationary nets were set in an area of calm water below the flood gates of the dam and were checked every 30 min or whenever a fish became noticeably entangled (i.e., floats sank or a tug was felt on the proximal end of the line).
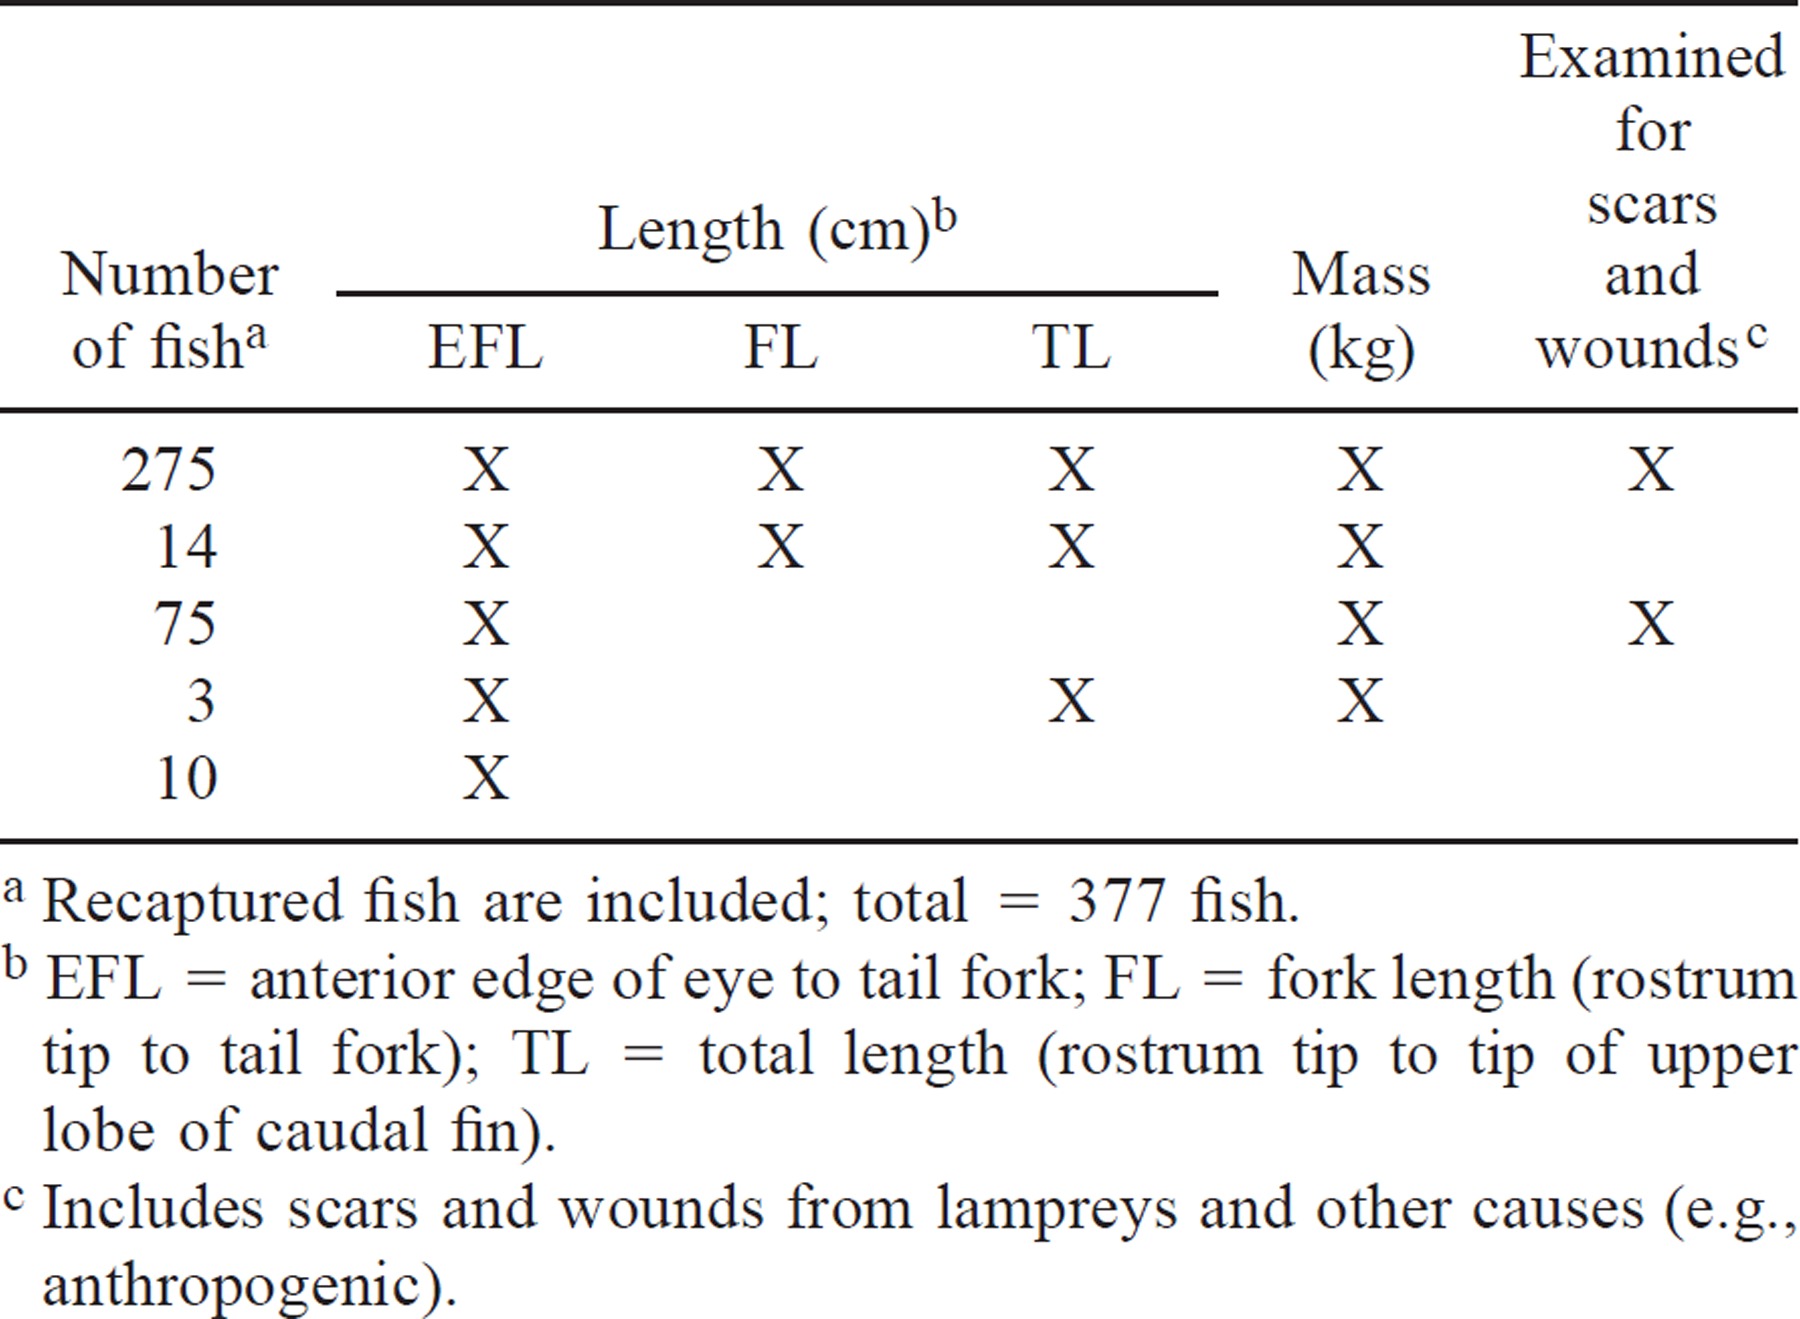
Three length measurements (to the nearest centimeter) were recorded: eye-to-fork length (EFL; anterior edge of eye to caudal fork), fork length (FL; tip of rostrum to caudal fork), and total length (TL; tip of rostrum to upper lobe caudal fin tip). Mass was measured to the nearest 0.5 kg, and previously unmarked fish were tagged on the jaw with a serially numbered Monel aluminum band. Data on lamprey scars, attached lamprey, and other injuries or physical anomalies were recorded. We did not weigh and record all three measures for all fish (Table 2). Initially (first 75 fish), we recorded only EFL, mass, and lamprey scars. However, to be consistent with Gengerke (1978), we recorded all three length measurements, mass, and lamprey scars for 94% of the fish we captured. When two or more fish were caught in the same set, all fish were tagged but not all were measured or examined for lamprey scars. Expedited release of the fish minimized holding time and negative effects on these obligate ram ventilators.
The number of fish captured per net drift was recorded and mean catch per drift was calculated for each day of sampling. Mean catch per drift by month (both years combined) was compared with analysis of variance (ANOVA) and Duncan's multiple-range test.
In calculating population estimates, we assumed that sampling the Prairie du Sac tailwater was adequate for meeting the assumption of geographic closure because of limited habitat availability in the Wisconsin River and known paddlefish behavior and habitat use. In a 3-year telemetry study (S. Zigler, U.S. Geological Survey, La Crosse, Wisconsin, unpublished data), 69–93% of radio-tagged paddlefish migrated significant distances from the Prairie du Sac tailwater in early to mid-April and all but 2 of 22 fish returned by mid-June; the two fish that did not return left the Wisconsin River entirely, and only 3 of 36 paddlefish radio-tagged in other areas of the Mississippi basin moved into the Prairie du Sac tailwater. Habitat characteristics at the Prairie du Sac tailwater are ideal for paddlefish: deep water areas (>5 m) with low velocities (0.0–0.3 m/s) adjacent to channels with greater water velocities and abundant zooplankton preferred by paddlefish (Coker 1929; 1930; Rosen et al. 1982; Hubert et al. 1984; Southall and Hubert 1984; Crance 1987). Downstream from Prairie du Sac, paddlefish habitat is limited and the dam provides an upstream barrier (Lyons 1993). Thus, most individuals we sampled probably had a home range that included the Prairie du Sac tailwater (S. Zigler, U.S. Geological Survey, La Crosse, Wisconsin, unpublished data).
Because the study took place over two years, we assumed that demographic closure did not exist for the entire period. We used the modified Jolly–Seber model because it does not require demographic closure (Jolly 1965; Seber 1965) and is more suitable for small numbers of recaptures (Seber 1965). Because of the assumption of equal capture probabilities, we can further assume that the proportion of recaptures for each group of marked fish would be approximately equal, and based on Jolly (1965) and Ricker (1975), we can estimate the number of marked fish at large as follows:


Population estimates also were calculated with the Chapman's modification of the Schnabel model. The Chapman's modified Schnabel is a multiple-census, closed-population model designed for concurrent marking and recapturing and cumulative recaptures. The Schnabel model is useful when the assumptions are only approximately satisfied (Ricker 1975). To reduce the bias caused by mortality across both years, the Chapman's-modified Schnabel population estimates were recalculated by adjusting the number of marked fish at large based on estimates of mortality. Mortality was incorporated by adjusting the estimate for daily survival calculated from the estimate of instantaneous mortality, and the number of marked fish at large was reduced by this amount for each day in the study.
Sampling dates for all models were combined into three events for each year, in part to reduce the bias that affects the Jolly–Seber population estimator if the number of recaptures per interval is less than five (Arnason and Mills 1981). In this study, the Jolly–Seber estimates were biased because of the small number of recaptures and different probability of capture. Each event was assigned a similar number of sampling days with the proviso that consecutive sampling days were not split between events. Sampling often took place over several days before a recapture was observed; a mean of 0.4 fish/d were recaptured. To account for the lack of returns initially, the second sampling event was the first set of consecutive days in which a recapture occurred. Thus, all catch data collected before the first recapture occurred were tabulated in the first sampling event.
Age analysis
Age estimates were made from ossified cartilage cross sections (23 μm) of the mesial bend of the dentary taken from eight paddlefish that suffered accidental mortality during sampling or were collected as carcasses. Six paddlefish aged in this study were collected from the lower Wisconsin River near the sample site, one carcass was collected in Pool 5A and another from Pool 4 of the upper Mississippi River. Age estimates followed methods described by Adams (1942) and Meyer (1960).
Gengerke (1978) collected 604 paddlefish from several pools (9, 11, 12, 13, 16, 17, 18, and 19; between river kilometers (rkm) 587 and 1,015 on the upper Mississippi River. Gengerke (1978) also followed the aging methods described by Adams (1942) to estimate the age of 565 fish. Sections were magnified (60×) and ages determined, but annual increments were not used for back-calculation of growth. The smallest fish collected in the Gengerke (1978) study was 43.8 cm FL and estimated to be age 1; the largest was 156.2 cm FL and age 18. Over 62% of the fish were estimated to be up to age 5.
Although more variable, the estimated ages of the eight paddlefish in our study overlapped the ages 8–18 (N = 56) estimated by Gengerke (1978; Figure 1). Thus, we assumed paddlefish from the Wisconsin River and pools 4 and 5 exhibited growth patterns similar to those determined by Gengerke (1978) and that a length–age relationship could be used to estimate age for all fish collected during this study. We developed a linear regression model for age in relation to fork length for the eight fish collected during our study plus fish 92 cm FL or greater from Gengerke's data (N = 168). We chose 92 cm fork length as a cutoff, because this matched the smallest fish collected during our study. The relationship was (r2 = 0.964)

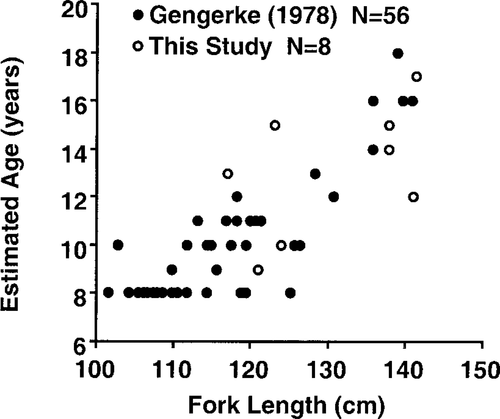
Estimated age in relation to fork length for eight paddlefish we aged for this study (clear circles) and 56 fish aged by Gengerke (1978; solid circles) from pool 13 in the Mississippi River
Because fork length was not measured on all fish sampled, a regression model was developed with EFL as the independent variable and fork length as the dependent variable (r2 = 0.91, P < 0.001) to assign fork length to fish that were not measured.
Mortality Estimates
Mortality was calculated by using an age-frequency catch curve (Ricker 1975). A curve of catch frequency (loge) versus age was constructed for the 1993 and 1994 data combined by using predicted ages from the age-at-fork-length regression (equation 1). To reduce any bias that may have resulted from extrapolating beyond equation (1), 11 fish that were estimated to be older than age 18, the upper age estimated by Gengerke (1978), were not included in the regression. The slope of the descending limb of the age-frequency catch curve was used as an estimate of instantaneous mortality.
Results
Population Estimates
During the study, 337 adult paddlefish were tagged, 189 in 1993 and 148 in 1994, of which 10 were recaptured in 1993 and 23 in 1994 (Table 1). Of the 23 recaptures in 1994, 20 had been tagged in 1993. Catch per unit effort varied from 0.14 (SD = 0.21) in July to 0.64 (0.29) in September. Mean catch per unit effort was significantly lower in July than in June, September, or October but was not different than in April, May, or August (F6, 75, P = 0.005).
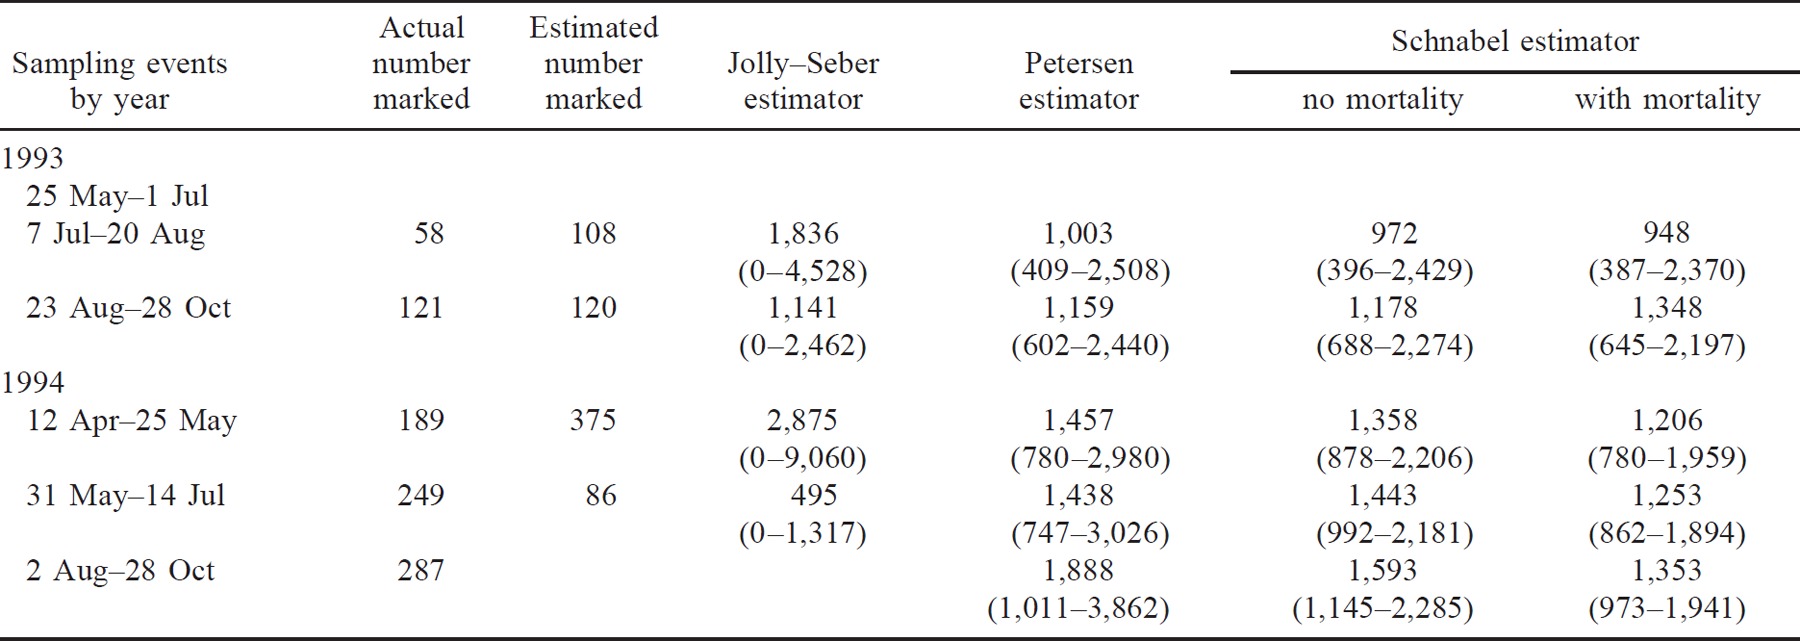
Population estimates ranged from 495 to 2,875 across the three estimators and six sampling events (Table 3). Modified Jolly–Seber estimates accounted for the entire range noted. However, for both modified Jolly–Seber estimates exceeding 1,141, the estimate for the number of marked fish at large was greater than the number of fish that had actually been marked, which positively biased these estimates, making them inaccurate. The adjusted Petersen estimates ranged from 1,003 to 1,888. Modified Schnabel population estimates ranged from 972 to 1,593 with no adjustment for mortality and from 948 to 1,353 with adjustments for mortality.
Age and Size Structure
Estimated ages of the eight paddlefish carcasses we collected were 9–17 years (Figure 1). Based on the age–length model, ages for all the paddlefish we sampled ranged from 5 to 21 in 1993 (mean ± SD = 13 ± 3.0) and from 6 to 23 in 1994 (14 ± 2.9; Figure 2). The EFL for paddlefish collected in 1993 ranged from 64 to114.5 cm (97.1 ± 8.8) and from 68 to125 cm in 1994 (100.3 ± 8.4; Figure 2).
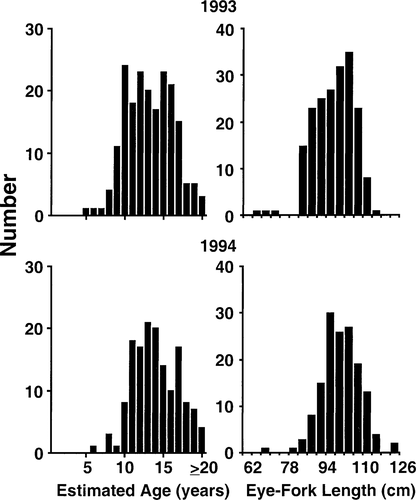
Estimated age-frequency (left panels) and length-frequency (right panels) distributions for paddlefish collected below the Prairie du Sac Dam, Wisconsin River, during 1993 and 1994
Mortality Estimates
The estimate of annual mortality (probability of death) derived from catch-curve analysis was 0.267. Paddlefish were considered fully recruited to the sampling equipment at age 15 (Figure 3). The estimate for daily survival (0.999) was calculated from the estimate of instantaneous mortality (0.311) following Ricker (1975).

Estimated age-frequency catch curve for paddlefish collected below the Prairie du Sac Dam, Wisconsin River, for 1993 and 1994 combined
Lamprey Parasitism and Scarring
Only silver lamprey Ichthyomyzon unicuspis were found attached to paddlefish. Of the 315 paddlefish examined for scars (not including recaptures), 13.6% had only one lamprey scar or one attached lamprey. Multiple lamprey scars were observed on 221 fish (70%), and 31 fish (10%) had 10 or more fresh lamprey wounds. In addition, 69 fish (22%) had scars or wounds we did not attribute lampreys (i.e., unnatural wounds, such as bent or severed rostra, hook wounds, and damaged tissue). Severe unnatural injuries (i.e., severed rostra or large areas of damaged tissue) were noted in 31(10%) of these fish. Of fish that initially had zero or one scar, eight upon recapture had two or more scars; of fish that had no unnatural wounds before tagging, three had an unnatural wound upon recapture.
Discussion
Population Estimates
Before our study, we were aware of only two completed studies on the size or status of paddlefish populations in the upper Mississippi River basin. Gengerke (1978) studied paddlefish population dynamics in several pools along the Iowa border in the upper Mississippi River from 1975 to 1978. Lyons (1993) estimated the lower Wisconsin River paddlefish population at 3,600 (95% confidence interval 1,320–9,000) in 1988 and at 4,720 (1,730–11,800) in 1989. Although population size may have been overestimated in the lower Wisconsin River because of the small numbers of recaptures, Lyons (1993) suggested an estimate of several thousand was reasonable. Since our study began, MICRA has undertaken an extensive tagging study of paddlefish in the upper Mississippi and Missouri rivers (Hesse and Carreiro 1997; Grady and Conover 1998); however, final results are not complete for this effort. The status of the Wisconsin River paddlefish population, given the relatively high estimates of population size, is important to the status of this species in the upper Mississippi River basin. Our study provides the best available estimate of the paddlefish population and mortality in the Minnesota and Wisconsin region of the upper Mississippi River drainage.
Despite several assumption violations, we believe the estimates generated by both open and closed population models in this study are useful for three reasons: (1) understanding how models are affected when certain assumptions are violated increases their value as tools for estimating population variables because the direction (i.e., over or underestimate) of the bias is known; (2) simulations conducted to examine the effects of assumption violations have shown that resultant population estimates are acceptable for estimating population size and mortality (Hightower and Gilbert 1984); and (3) most population estimates, particularly for large-river fish populations, violate some assumptions, such as equal catchability, of every published population model. Violation of assumptions is particularly true when mark–recapture studies are conducted with limited time and resources (i.e., limited data reduce the number of models that can be considered).
The assumption that each fish had an equal probability of capture throughout the study was probably violated and affected both the Jolly–Seber model (open population estimate) and the modified Schnabel estimate (closed population model). During the 1995–1997 spawning seasons (early to mid-April), many paddlefish tagged with radio transmitters moved downstream and then returned to the Prairie du Sac tailwater by the second week of June (S. Zigler, U.S. Geological Survey, La Crosse, Wisconsin, personal communication). Also, 2 of 19 radio-tagged paddlefish from the Black River (Wisconsin) and 1 of 17 paddlefish radio-tagged in the Chippewa River (Wisconsin) moved into the tailwater of the Prairie du Sac Dam.
Due to these movements of paddlefish in the lower Wisconsin River, we assumed the observed number of fish previously marked and subsequently recaptured, a value only used in the Jolly–Seber model, to be inflated relative to the other values in the model. As a result, the numerator in the equation estimating marked fish at large was inflated. In addition, only one fish from the April–May 1994 marking period was recaptured, whereas more than 5% of fish marked during other periods were recaptured. This suggests additional unequal capture probabilities; it also results in a very small number in the denominator of the equation estimating marked fish at large, which inflates the estimate. The Jolly–Seber estimate of population size (2,875) for April and May 1994 reflects these biases. In fact, the Jolly–Seber estimates of 1,836 and 2,875 are not accurate because they are computed from an overestimate of marked fish at large.
For the second-to-last sampling period in the survey, the Jolly–Seber estimate of the number of marked fish (< 50% of the number of fish that had been marked to date) was probably underestimated. In this case, the Jolly–Seber estimate of population size was negatively biased. The number of fish recaptured was relatively small simply because there was only one remaining sampling event to collect recaptures. Limited recaptures reduce the numerator and the denominator in the Jolly–Seber equation for the estimate of marked fish at large. However, the numerator in the Jolly–Seber estimate of the number of marked fish at large is further reduced by the small number of new marks that were released (38) during this sampling event.
Catch per unit effort was lowest in July but was not different than in April, May, or August. The reduced catch may reflect seasonal behavior patterns that result in reduced susceptibility to capture during this period. Paddlefish have been found to be less vulnerable to capture during summer months, which is thought to be related to dispersal behavior (Gengerke 1978).
The modified Schnabel estimator assumes the population is closed to additions and losses. Our length-frequency curves suggest negligible recruitment to the sampling equipment. Thus, for the purposes of our study we suggest that the population was demographically closed relative to recruitment. Emigration would have the same effect on the population as mortality, and immigration will have the same effect as recruitment. Natural mortality (or emigration) occurring in the interval between sample periods theoretically affects marked and unmarked fish equally and will not bias some closed population estimators because it will not change the ratio of marked to unmarked fish (Robson and Reiger 1968; Seber 1973). However, the population estimate relates only to the population size at the beginning of the study. If both recruitment (or immigration) and mortality (or emigration) occur during the study and if both marked and unmarked fish are affected similarly by mortality, the estimate of N will be too high, on average, for both the initial and final population sizes. However, the population estimate can be considered an upper bound for population size for both occasions (Robson and Reiger 1968).
The two above-noted instances of paddlefish movement from other river systems suggest that the population at the dam is not entirely closed to emigration and immigration. There should not be a size bias in relation to movement; that is, Purkett (1963), Hoffnagle and Timmons (1989), and Pitman and Parks (1994) reported that nonspawning paddlefish (juveniles and adults) apparently migrate, even when not spawning (but see Lein and DeVries 1997). The combination of mortality, emigration, and immigration may have resulted in overestimates of population size. Our mortality-estimate adjustment to the data, which corrected for both mortality and emigration, produced lower estimates for the modified Schnabel. Considering the biases of each population estimator, we feel that the final Chapman's modified Schnabel estimate adjusted for mortality (1,353) is reasonable and is the best estimate of population size. Only two valid estimates exceeded 1,500 fish; however, the estimates made in 1988 and 1989 by Lyons (1993) may not be statistically higher than our preferred estimate because Lyons' confidence intervals are quite broad and overlapped the confidence interval for our estimate.
Our estimates of annual mortality (27%), although somewhat high for an unharvested population, fall well within the range of three reports in the literature for harvested populations. Gengerke (1978) estimated annual mortality of 22–44% for paddlefish subject to both commercial and sport harvest. Although an estimate of 44% annual mortality is high for a long-lived species, Gengerke (1978) collected only a small percentage (7%) of fish older than age 10, and the maximum was estimated to be age 18. In the Missouri River, where paddlefish also are harvested for sport and commercial purposes, annual mortality was estimated at 18%, but the oldest fish were estimated to be age 26 (Rosen et al. 1982). Finally, annual mortality estimates ranged from 26% to 48% for three Louisiana paddlefish populations that were protected by a commercial fishing moratorium but subjected to negligible sport harvest (maximum reported age was 14 years for one location but 10 for the other two; Reed et al. 1992).
The relatively high estimate of mortality for this study may be attributed to emigration and error in age estimation; however, several factors may contribute to paddlefish mortality at the dam. The tailwater area is used by sport anglers in boats with outboard motors. Boat-paddlefish collisions probably occurred and may have caused a large amount of the unnatural scarring we observed. Rosen and Hales (1980) reported 10% of fish in their study lost most or all or their rostrum and that scars were primarily due to injuries from collisions with motor boats. Purkett (1963) also reported paddlefish deaths related to boat collisions. Unintentional snagging of paddlefish by recreational anglers, which we observed frequently, may have resulted in some mortality, and losses due to illegal harvest also occur. Individual paddlefish that are heavily parasitized by lampreys (70% had multiple lamprey wounds) could be more susceptible to indirect sources of mortality (e.g., secondary infection).
Age and Size Structure
Unsuccessful spawning and recruitment failure have been linked to the effect of dams on the hydrograph, habitat, and migration of paddlefish and other riverine fish species (Purkett 1961; Russell 1986; Sparrowe 1986; Lyons 1993; Auer 1996; Scarnecchia et al. 1996). Lack of recruitment to our sampling equipment by smaller fish may point to weak year-classes 4–6 years before our sampling and may be cause for concern. Lyons (1993) sampled by electrofishing in the same area and also suggested a lack of recruitment. Intermittent recruitment success may be characteristic of paddlefish life history because maturation of the oocytes requires a minimum of 2 years (Russell 1986). In addition, paddlefish rely on specific flow regimes for successful reproduction, and variable year-class strength may be due, in part, to manipulation of the hydrograph for flood control and navigation purposes (Unkenholz 1986). Dams contribute to siltation in habitat that was once suitable for paddlefish spawning. Dams also block fish from gaining access to traditional spawning sites (Sparrowe 1986). Although the Prairie du Sac Dam is operated as run of the river, impacts on the lower Wisconsin River hydrograph are caused by hydropower dams upstream that store spring flows and slowly release water the remainder of the year (Lyons 1993; Jim Fossum, USFWS, Green Bay, Wisconsin, personal communication). Hydropower operations have an impact on spawning success because of the importance of flow on spawning behavior and on the quality and suitability of habitat for spawning, hatching, and rearing (Purkett 1961; Russell 1986; Sparrowe 1986).
In conclusion, our study may represent the best estimate of population size currently available for paddlefish in the lower Wisconsin River. Large concentrations of paddlefish, such as the one found at Prairie du Sac are unknown, or at best, uncommon in the Wisconsin and Minnesota region of the upper Mississippi River but may indicate that this area hosts a source population. Indications of unsuccessful spawning and recruitment failure should not be ignored and warrant further investigation. Monitoring of the Wisconsin River paddlefish population should continue because of the relatively high concentration of fish with potential as a source population, and investigations should be implemented on other large tributaries and the main stem of the upper Mississippi River. Cooperative monitoring efforts and data exchange of the type conducted by the MICRA Paddlefish and Sturgeon Subcommittee need to continue. In addition, an interagency management plan is needed to outline problems, identify strategies, and implement adequate management efforts that would prevent the decline of populations to precarious levels. The data management efforts of the MICRA Paddlefish and Sturgeon Subcommittee and cooperating states are the foundation from which an excellent management plan could be developed.
Acknowledgments
We thank the U.S. Fish and Wildlife Service for funding this project. We especially thank R. May and V. Hyde who helped enormously with data collection. L. Mizner provided technical advice, and S. Gutreuter aided with population estimates. S. Shastine assisted with aging paddlefish. We thank T. Gengerke for the use of his unpublished data. B. Knights, T. Koel, J. Pitlo, and three anonymous reviewers provided thoughtful comments that improved the manuscript. We are grateful to the following volunteers who assisted in collection of field data: D. Amundson, T. Batya, L. Berquist, H. Bolton, N. Chu, C. Damberg, K. Dulik, S. Duxbury, J. Duyvejonck, S. Erickson, M. Fain, S. Fischer, J. Fisher, J. Fossum, T. Gelatt, J. Grant, B. Giese, R. Hemker, L. Hill, L. Hoboy, D. Hochhausen, D. Hyde, A. Jurva, B. Luebke, J. Lyons, S. McCumber, R. Maxson, K. Maycroft, W. Miller, N. Molitor, R. Moody, E. Nelson, D. Periera, J. Rasmussen, T. Roetigger, H. Terry, P. Thiel, J. Trick, D. Wedan, K. Welke, D. Wenger, J. Wilbur, and S. Yess.


