Genetic Differentiation, Temporal Stability, and the Absence of Isolation by Distance among Atlantic Herring Populations
Present address: Bedford Institute of Oceanography, Department of Fisheries and Oceans, 1 Challenger Drive, Dartmouth, Nova Scotia B2Y 4A2, Canada.
Present address: Bedford Institute of Oceanography, Department of Fisheries and Oceans, 1 Challenger Drive, Dartmouth, Nova Scotia B2Y 4A2, Canada.
Abstract
The genetic variation among 17 spawning groups of Atlantic herring Clupea harengus was assessed at several temporal and spatial scales using nine tetranucleotide microsatellites. Pan-Atlantic samples were drawn from the Scotian Shelf, the Celtic Sea, the Baltic Sea, and coastal Iceland. Significant differentiation was observed between northeastern and northwestern Atlantic herring (FST ∼ 0.065) and among northwestern Atlantic spawning groups (max FST = 0.014) at the spatial scale of the Scotian Shelf. Geographic distance among Scotian Shelf collections did not explain the pattern of genetic differentiation observed (e.g., lack of isolation by distance). The temporal proximity of collections (as measured by days between collections) explained 30% of the pairwise population differentiation (P = 0.0025). Allele frequencies of replicate samples and year-class analyses demonstrate temporal stability at four locations.
Introduction
Atlantic herring Clupea harengus is found in most shelf regions of the northern Atlantic Ocean and several adjacent inland seas. To the west, it ranges from Iceland and Greenland to Cape Cod and to the east from the Bay of Biscay to the Arctic coasts of Norway, Russia, and the Baltic Sea. Herring stocks throughout the Atlantic have undergone large (i.e., orders of magnitude) fluctuations in population size and yield, and this has led to considerable interest in documenting population structure and dynamics with an eye toward minimizing differential exploitation of stock components within what may be a mixed-stock fishery.
Previous studies designed to delineate the genetic population structure of Atlantic herring have frequently used few polymorphic loci, populations, or both (e.g., Kornfield and Bogdanowicz 1987; Safford and Booke 1992; Turan et al. 1998). The ensuing results have been used to make inferences concerning the potential roles of selection, migration, mutation, and genetic drift in shaping the population structure observed. Far less consideration has been given to the ecological mechanisms that may be responsible for producing patterns of differentiation. The majority of previous genetic studies on herring have used individuals of uncertain spawning status (which is arguably insufficient for effective tests of genetic isolation) and have generally concluded that despite the existence of apparently discrete spawning components (Sinclair and Tremblay 1984) and the presumed high degree of spawning site fidelity thought to be characteristic of herring (Iles and Sinclair 1982), gene flow has been sufficient to prevent Atlantic herring populations from becoming reproductively isolated (e.g., Kornfield et al. 1982). Alternatively, it has been postulated that herring may only have begun the process of differentiation in their recent evolutionary history, such that resolvable genetic differences have yet to evolve (e.g., Grant 1984), though this contention appears difficult to test.
In contrast, rejections of the null hypothesis of no genetic differentiation among small numbers of populations of northeastern (NE) and northwestern (NW) Atlantic herring have been reported (Shaw et al. 1999; McPherson et al. 2001b). However, the geographic distances encompassed by the “population” samples used in most contemporary studies have generally been limited, and the potential for temporal variation among allele frequencies within location-specific samples was not explicitly assessed. Establishing the temporal stability of the patterns of genetic differentiation among populations via the use of spawning stage specimens is essential for quantifying population structure; inferences drawn from spatial patterns of variation may be misleading if such patterns vary over short (interannual) time scales.
The first objective of this study was to describe the extent and pattern of population structure of Atlantic herring in the northwestern Atlantic using microsatellite DNA markers. A second objective was to quantify the amount of interannual temporal genetic variation, as recommended by Waples (1998). To do so, we assessed the temporal stability of population structure by considering replicate samples and using comparisons across year-classes (here defined as cohorts). A third objective was to assess the results of genetic analyses within the context of the population models and processes (e.g., isolation by distance) proposed for Atlantic herring.
Methods
Laboratory procedures
Individual fish from spawning aggregates were preferentially collected to maximize the possibility that a spawning population was represented. Tissue samples (blood, fin, or muscle) were collected from spawning stage Atlantic herring at ten locations along the Scotian Shelf, in the Bay of Fundy, and in the Gulf of Maine (Figure 1) in 1998, 1999, and 2000 (Table 1). Analyses of a subset of some of these collections (Bras d'Or Lake, Georges Bank, Devastation Shoal, Eastern Passage, and Three Fathoms Harbour) were previously reported in McPherson et al. (2001b) and discussed in relation to the management of intraspecies genetic diversity along the southern coast of Nova Scotia. Herring from the vicinity of Iceland and the Celtic and Baltic Seas were included in the analyses presented here to provide comparisons of differentiation across the species' range. In all but one case, herring were of spawning stage (Icelandic herring were collected from a prespawning assemblage).
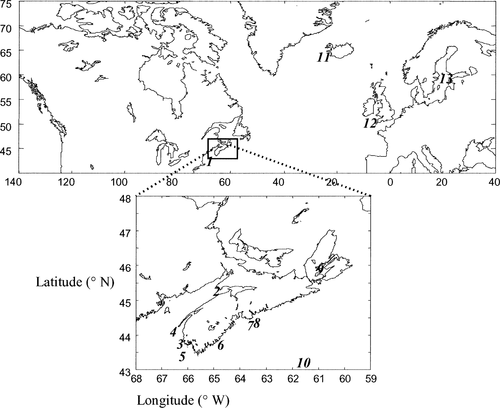
Map showing the locations from which Atlantic herring genetic samples were obtained. The numbers correspond to those in Table 1
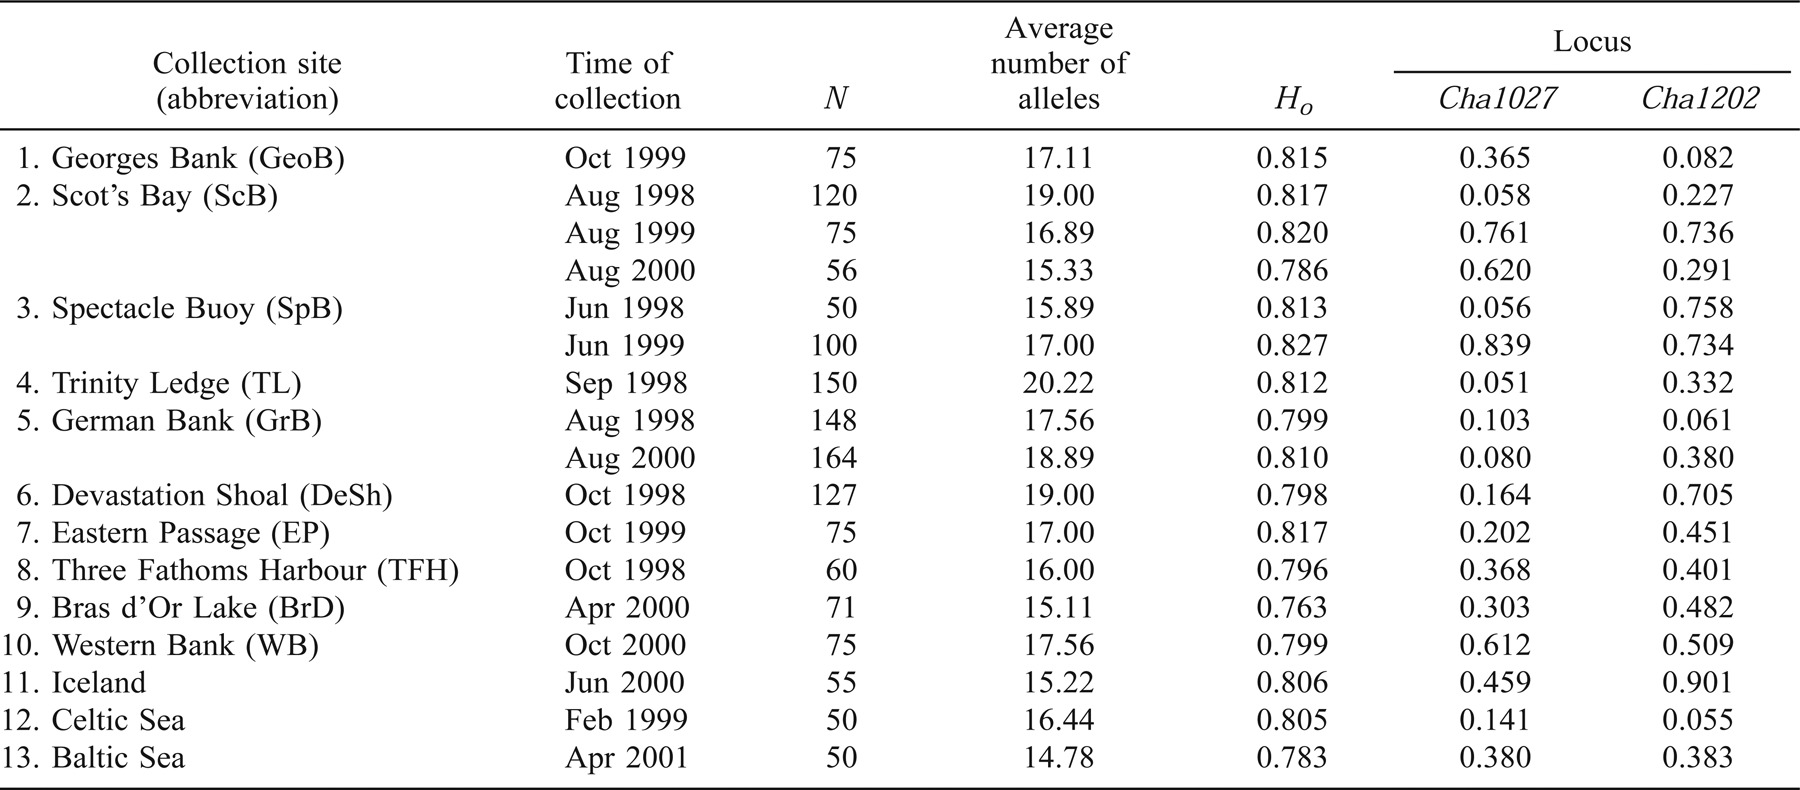
Atlantic herring from three locations were collected in multiple years (Table 1) to assess the temporal stability of allele frequencies. Year-class information, determined by age using the number of annuli in the otoliths collected from the same individuals used for genetic analyses, was provided by St. Andrews Biological Station, Fisheries and Oceans Canada.
DNA was isolated from tissues by means of Qiagen DNeasy genomic DNA extraction methods, and nine microsatellite loci (Cha1027, Cha1020, Cha1059, Cha1202, Cha1017, Cha1045, Cpa108, Cpa113, and Cpa102) were amplified via polymerase chain reaction (PCR). Amplification, electrophoresis conditions, and general locus descriptions for the Cha and Cpa loci are provided in McPherson et al. (2001a) and Olsen et al. (2002), respectively. DNA fragments were visualized with an FMBIO II fluorescent imaging system (Hitachi).
Data analyses
Departures from Hardy–Weinberg expectations (HWE) were tested for each locus and collection using GENEPOP (Raymond and Rousset 1995). Significance (P-value) was estimated for each comparison using the Markov chain method with 2,000 dememorization steps, 200 batches, and 2,000 iterations per batch.
Unbiased estimates of FST (the calculated proportion of total genetic variability that is attributable to the genetic differences between populations; Wright 1951; Weir and Cockerham 1984) between collections and year-classes were calculated using GENETIX (Belkhir 2000), and 1,000 permutations were used to estimate the probability of departure from the null hypothesis of FST = 0. Multidimensional scaling (MDS) of pairwise FST estimates was used to create a two-dimensional illustration of the relative dissimilarities among collections (NCSS97; Hintze 1998). Estimates of RST (a metric that is analogous to FST but that incorporates the stepwise mutation model of microsatellite evolution; Slatkin 1995) between northeastern Atlantic collections and a random subset of northwestern Atlantic collections were also calculated using RST-Calc (Goodman 1997) and 1,000 permutations.
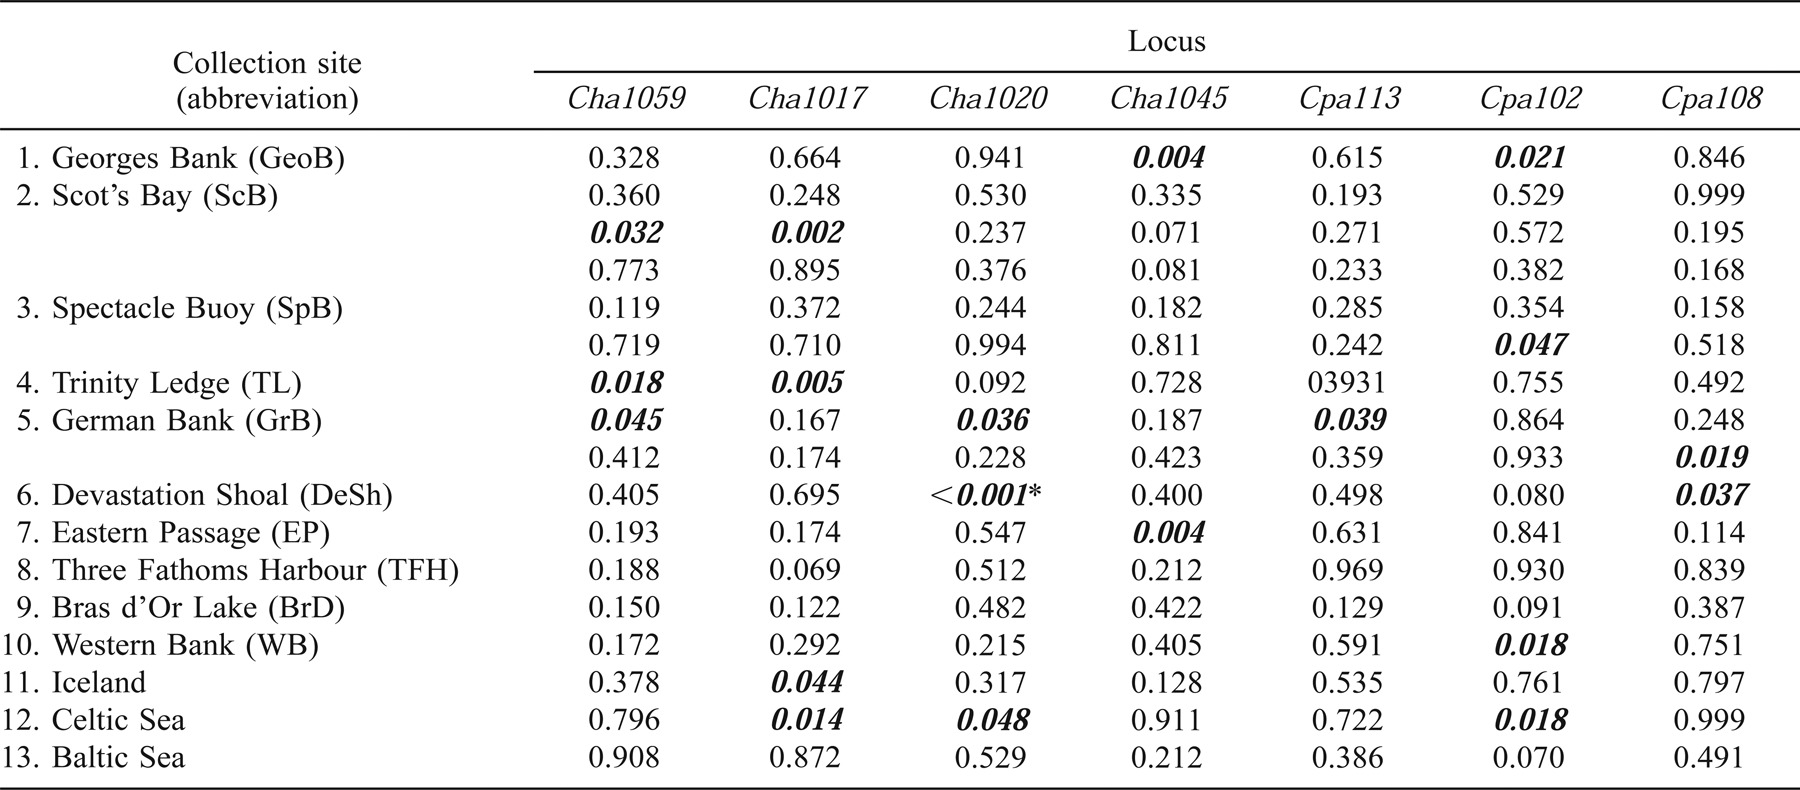
We employed an Exact test (GENEPOP: Raymond and Rousset 1995) to assess the significance of allele frequency differences at individual loci between pairs of collections. Significance was calculated using the Markov chain method as above. For each locus that did not significantly depart from HWE, the number of alleles was tabulated and regressed on the number of significant pairwise comparisons for each locus to test whether the number of differences observed was dependent on the number of alleles observed at each locus.
The temporal stability of allele frequencies was assessed using samples collected from the same location in consecutive years and from samples that comprised multiple year-classes of Atlantic herring. In collections that had a sufficient number of individuals (>15) from at least two year-classes, the individuals were pooled across collections (from the same location) according to year-class. Year-classes were then compared within each location to assess the temporal stability of the allele frequencies. To quantify the temporal stability of allele frequencies, we computed Pearson's correlation coefficients between frequencies for each allele observed in the temporal replicates for the German Bank, Spectacle Buoy, and Scot's Bay collections (following Tessier and Bernatchez 1999). A hierarchical analysis of molecular variance (AMOVA; Excoffier et al. 1992) was used (Arlequin; Schneider et al. 2000) to compare variance (covariance components) within sample collections, among locations, and among year-classes. The significance of the corresponding fixation indices was tested by random permutation (1,000 replicates).
Spatial patterns of genetic variation were investigated by means of a Mantel test (Mantel 1967). The shortest marine distance between populations and FST estimates were used to test for a linear isolation × distance relationship between populations (GENETIX; Belkhir 2000). The time (in calendar days) between collections was regressed on the pairwise FST estimate of each pair of collections within the Scotian Shelf to assess temporal influences on population isolation.
Results
All loci were polymorphic in all sample collections, and levels of average heterozygosity per collection ranged from 0.763 to 0.827 (Table 1). The total number of alleles observed across all Atlantic herring samples ranged from 14 at Cpa108 to 75 at Cpa102. Of the 153 single-locus tests for conformation to HWE, 19 had significance values of P < 0.05, but only one (Devastation Shoal; Cha1020) test showed significant (P = 0.0007) departure from expectations following Bonferroni corrections for multiple tests (Table 1). Multilocus tests for HWE (following Fisher 1954) indicated that only the 1998 German Bank collection departed from HWE (P = 0.005) following Bonferroni correction.
Spatial Comparisons
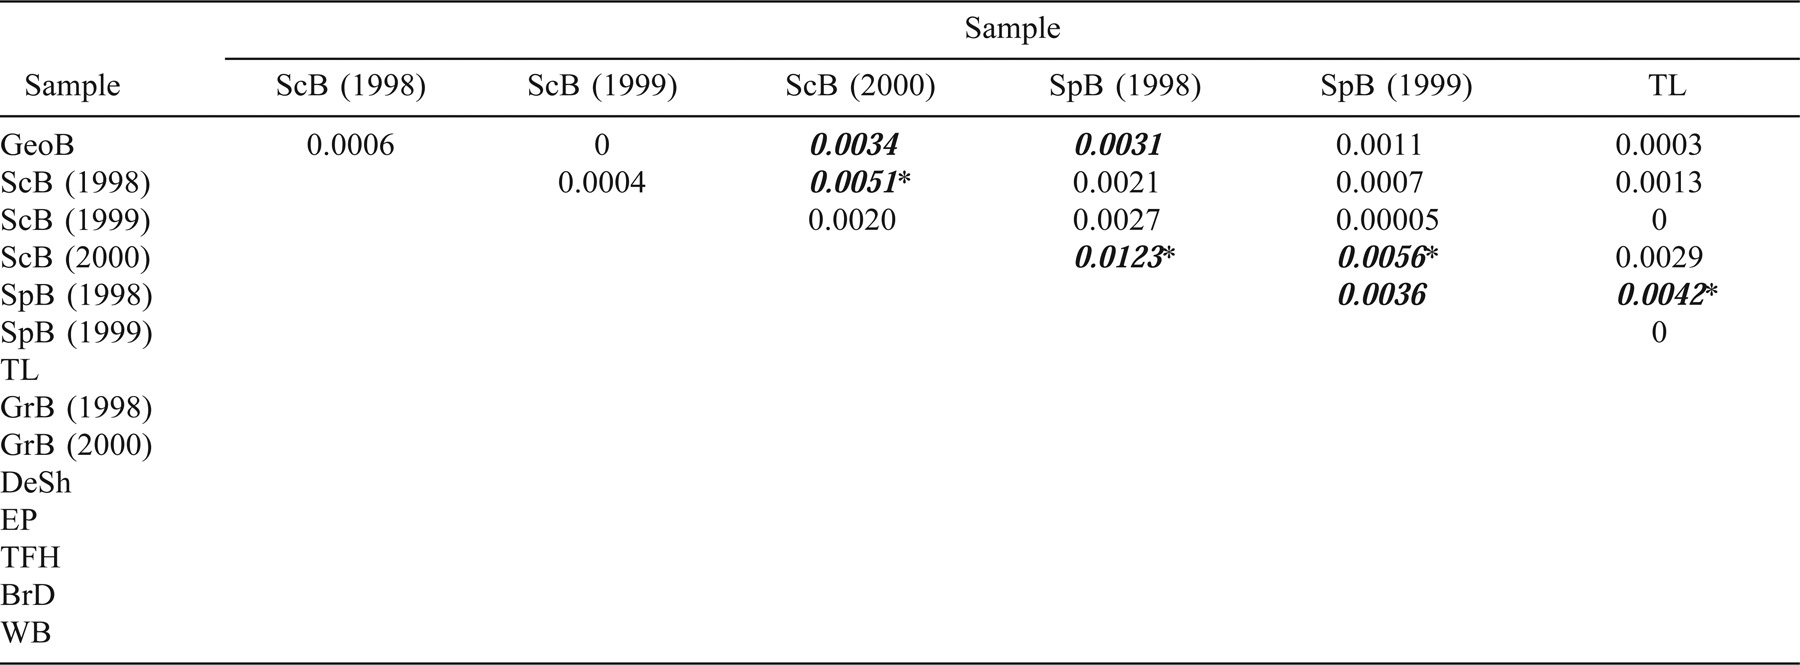
At the pan-Atlantic scale, Baltic, Celtic, and Icelandic collections from the NE Atlantic differed from each other and from the NW Atlantic collections (FST range, 0.0035–0.0681; Table 2). The RST estimates also indicate differences between the NE and NW Atlantic samples (range, 0.009–0.029; Table 2). Multidimensional scaling (Figure 2) of pairwise FST estimates between NE and NW Atlantic herring (pooled by location, with Spectacle Buoy and Bras d'Or Lake removed; see below) illustrates the separation between NW and NE Atlantic herring. The NW Atlantic collections are most similar to the Icelandic collection and then to the Celtic Sea collection; they are most distant from the Baltic Sea collection. This range in relative similarity is what would be predicted based on geographic distance. Further, given that the magnitude of differentiation within the NW Atlantic is comparable to that between the Icelandic and Celtic Sea samples, there is more than twice the variation within the NE Atlantic collections (including the Baltic) than within all NW Atlantic collections. The magnitude of this variation is also reflected in the degrees of substructure (Table 2). In fact, there is twice as much substructure within the NE Atlantic collections than within the NW Atlantic collections when measured using FST. However, the NE and NW Atlantic samples were not collected at comparable geographic scales.
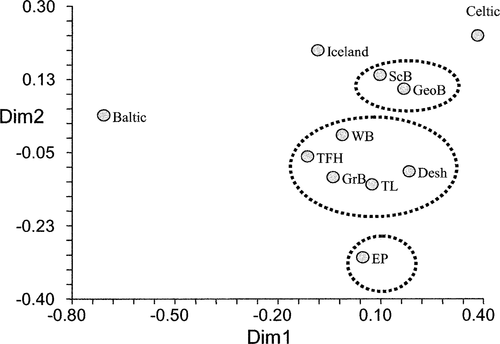
Multidimensional scaling illustration of genetic (FST) dissimilarities among Atlantic herring samples from Celtic Sea, Iceland, Baltic Sea, and northwestern Atlantic collections collapsed by location (abbreviations are given in Table 1). Dashed lines define the hypothesized quasi-isolated groupings. Dimension 1 (Dim 1) explains 69% of the variations, whereas dimension 2 (Dim 2) explains 5%

When the NW Atlantic samples were pooled and compared with the NE Atlantic (Baltic, Icelandic, and Celtic Sea) samples, all FST comparisons revealed differences (Table 2). The magnitude of the differences between the NE and NW Atlantic collections was greater than any substructure estimate within either region (NE or NW). The RST estimates (Table 2) were, in most cases, lower than the corresponding FST estimates. The largest RST estimates were between the Icelandic and Baltic Sea samples (which was inconsistent with FST) and the Icelandic and NW Atlantic samples (which was consistent with FST).
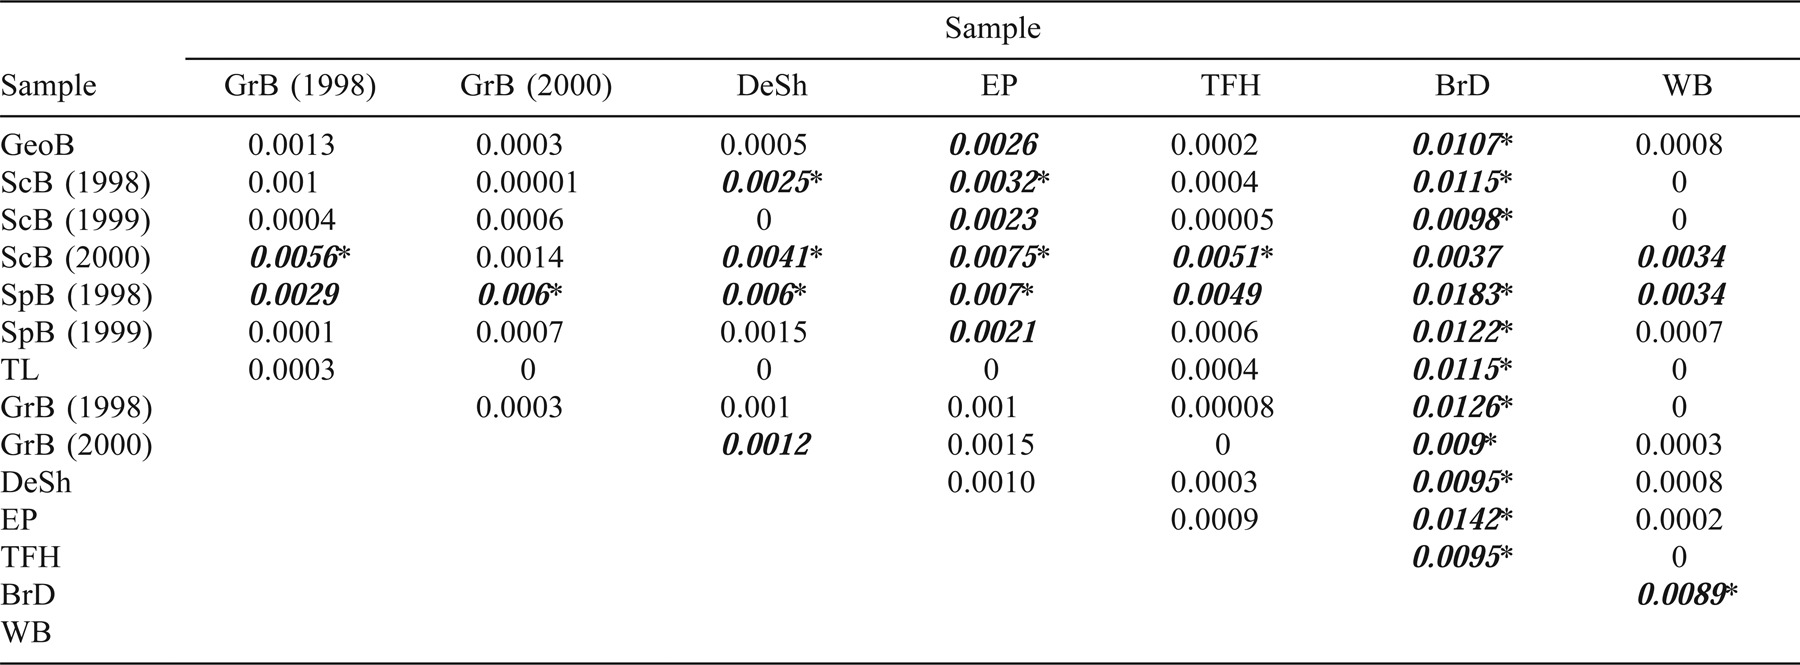
Multilocus FST analyses revealed population structure within the NW Atlantic Scotia–Fundy region (Table 4). Most notably, Bras d'Or Lake Atlantic herring (the easternmost collection) were different from all other regional collections, with pairwise FST estimates ranging from 0.0037 to 0.0142. In all but one (Scot's Bay in 2000) comparison with Bras d'Or Lake, the differences remained significant after Bonferroni corrections for multiple tests. Eastern Passage was the next most eastern collection site within the region, and FST estimates revealed differences between Atlantic herring from this location and herring collected from the interior of the Bay of Fundy (Scot's Bay and Spectacle Buoy) and the Gulf of Maine (Georges Bank). In addition, differences were observed between the collection from Spectacle Buoy in 1998 and many of the herring collections from the southwestern Scotian Shelf region (Trinity Ledge, German Bank, Devastation Shoal, and Three Fathoms Harbour), Georges and Western banks, and Spectacle Buoy in 1999. The majority (56%) of these tests remained significant after the sequential Bonferroni correction was applied.
When Bras d'Or Lake Atlantic herring (which were distinct from all others) were removed from the comparative analyses and from the pairwise FST estimates among spawning groups as visualized using MDS, three quasi-isolated groupings were apparent (Figure 3): the sole Eastern Passage collection; a group that included the majority of the southwestern Nova Scotia spawning groups (German Bank, Devastation Shoal, Three Fathoms Harbour, Trinity Ledge, and Spectacle Buoy in 1999) as well as Western Bank; and a group that consisted of Georges Bank, Scot's Bay, and Spectacle Buoy in 1998 (the relative associations between these groups and the NE Atlantic collections are shown in Figure 2). Because collections from Spectacle Buoy were associated with different groups, and because the inclusion of the Bras d'Or Lake sample collapsed the relative positions of all NW Atlantic collections, the Spectacle Buoy and Bras d'Or Lake collections were omitted from Figure 2.
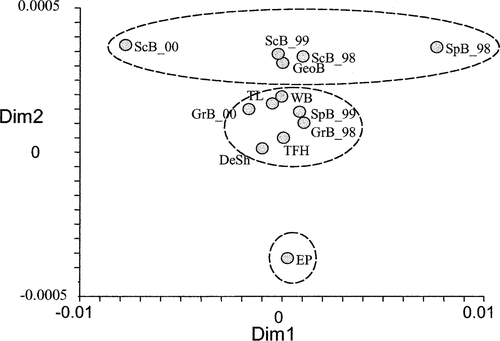
Multidimensional scaling illustration of genetic (FST) dissimilarities among all northwestern Atlantic herring samples except the one from Bras d'Or Lake (abbreviations are given in Table 1; the two-digit numbers after the underbars refer to the years of collection). Dashed lines define the hypothesized groupings discussed in the text. Dimension 1 (Dim 1) explains 66% of the variation, whereas Dimension 2 (Dim 2) explains 4%
A Mantel test using pairwise FST estimates from NW Atlantic herring comparisons and the shortest marine distance among sample locations showed no association between variables (P = 0.72) and thus no evidence of isolation by distance.
No linear relationship was detected between the number of alleles observed at each locus and the number of significant single-locus pairwise results generated for each locus, respectively (P = 0.96).
Temporal Comparisons
When the number of calendar days within a year between NW Atlantic collections was regressed on the corresponding pairwise FST estimates, a positive linear relationship was observed (R2 = 0.30; P = 0.0025).
Samples were collected in sequential years in three locations to test for temporal stability in allele frequencies: Scot's Bay in 1998, 1999, and 2000; Spectacle Buoy in 1998 and 1999; and German Bank in 1998 and 2000. The frequencies of individual alleles for all loci were highly correlated between replicate samples, with correlation coefficients ranging from 0.92 to 0.98 (Figure 4). No differences (based on multilocus FST) were found between the 1998 and 1999 and the 1999 and 2000 Scot's Bay collections or between the 1998 and 2000 German Bank collections (Table 4). However, a significant difference was observed between the 1998 and 2000 Scot's Bay collections (FST = 0.0051; P = 0.001) and a marginal difference (FST = 0.0036; P = 0.02) between the 1998 and 1999 Spectacle Buoy collections.
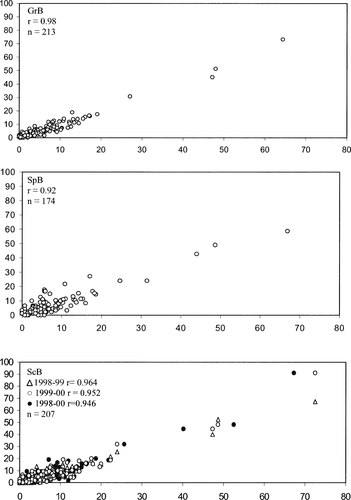
Pearson correlation coefficients of individual allele proportions (%) between temporal replicates taken in 1998 and 2000 at German Bank (top panel), 1998 and 1999 at Spectacle Buoy (middle panel), and 1998, 1999, and 2000 at Scot's Bay (bottom panel). Each panel includes all alleles across loci.
Four year-classes were represented in the German Bank collections, three in the Trinity Ledge and Scot's Bay collections, and two in the Eastern Passage collections. The FST analyses revealed no differences among the year-classes from each location. Although potentially limited by sample sizes (and the resulting loss of power), fewer single-locus differences were detected when samples were compared by year-class than by collection year. These year-class data were also used in an analysis of molecular variation that partitioned genetic variation into intrapopulation differences (defined here in terms of specific year-classes and locations), interannual differences within locations, and interlocation differences. When the results were averaged over nine loci, 99.89% of the variation was found within populations, 0% among year-classes within locations, and 0.11% among locations. Only the F-statistic corresponding to the variance among locations was significant (0.00112; P = 0.014).
Discussion
The results presented above demonstrate population structure in Atlantic herring at the basin, shelf, and bank scales. They also demonstrate interannual stability, as reflected by allele frequency homogeneity and analyses of molecular variance. Further, despite the general agreement between the different methods used to assess temporal stability at sampling locations, comparisons by year-class yielded fewer significant differences than did those using collections made in multiple years.
Atlantic herring displayed a high degree of allelic diversity, with an average heterozygosity approaching 0.80—slightly less than that reported by O'Connell et al. (1998b) for Pacific herring and Shaw et al. (1999) for NE Atlantic herring using dinucleotide microsatellites developed for Pacific herring (O'Connell et al. 1998a). With the exception of the German Bank collection in 1998, all collections conformed to HWE when all loci were combined (following Fisher 1954). Single-locus tests showed departure from HWE only in the Devastation Shoal collection at Cha1020 after Bonferroni corrections. Given the large number of tests conducted, the degrees of significance, and the ensuing corrections, we conclude that overall these genotypic data conform to HWE.
The majority of the significant single-locus differences among collections were found at four loci: Cha1027, Cha1020, Cha1045, and Cpa108. These loci are not the most variable, and Cpa108 was the least variable locus of all those used. Further, there was no linear relationship between the number of alleles at each locus and the frequency of differences in pairwise tests at that locus, which implies that the number of alleles observed at a given locus provides no predictive power regarding the ability of the locus to reveal differences among sample collections.
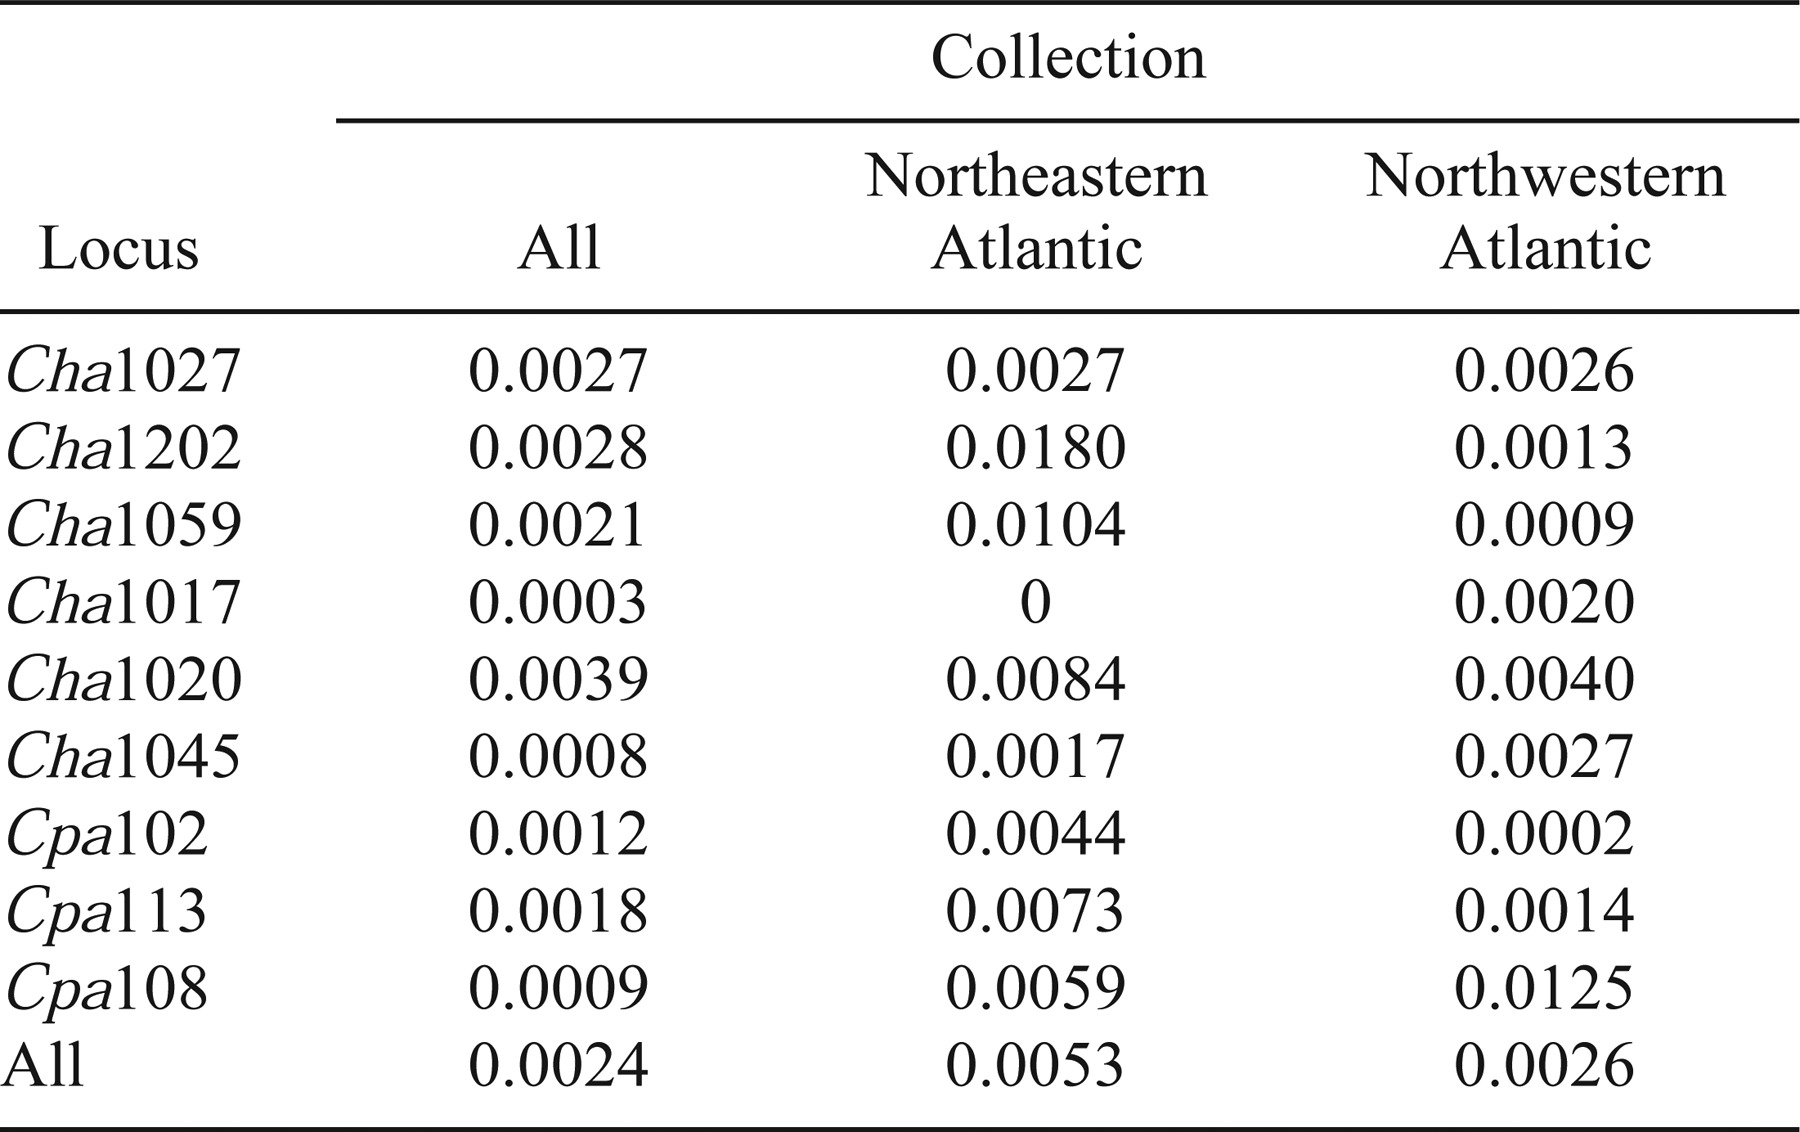
When the degree of substructure within the NW and NE Atlantic collections (as estimated by each locus) is compared (Table 3), opposing trends are observed between the NE and NW Atlantic assemblages. Cha1059 and Cha1202 are among the least variable loci, and they revealed the most substructure within the NE Atlantic herring collections and the least amount of variation within the NW Atlantic collections. This implies that the discriminatory ability of each locus is location specific.
Spatial Pattern
Grant (1984) showed that the magnitude of pan-Atlantic differentiation (based on 40 protein-coding loci) in Atlantic herring was not greater than that estimated among regions on either side of the Atlantic. In contrast, we observed highly significant pan-Atlantic differences based on FST and we thus infer that trans-Atlantic gene flow in herring is rare. The homogeneity among the NE Atlantic collections and all the NW Atlantic collections reported by Grant (1984) may be attributable to balancing selection (at least for some of the allozyme loci; e.g., Pogson et al. 1995) or the lack of divergence through drift due to the time interval of separation. When the NW Atlantic collections in this study were pooled, the differentiation between NE and NW Atlantic herring was twice as great as that detected between NE and NW Atlantic cod Gadus morhua (Bentzen et al. 1996) based on dinucleotide microsatellite markers. It has been suggested (e.g., Carr and Crutcher 1998) that FST results derived from microsatellite markers underestimate the degree of trans-Atlantic differentiation due to homoplasy. However, the results presented here are consistent with the magnitude of pan-Atlantic differences reported for other marine fishes using mtDNA analyses (e.g., Atlantic cod; Carr and Crutcher 1998).
At a smaller spatial scale, Bras d'Or Lake Atlantic herring differed from all of the others included in this study, with the exception of one collection in one year (Scot's Bay in 2000). The degree of differentiation between the Bras d'Or Lake “population” and all others comes as no surprise, as these herring inhabit a relatively closed and unique lake–estuary environment. This finding does contrast with that of Ryman et al. (1984), who found no differences (using allozyme markers) in herring samples collected from populations with differing salinities (e.g., Gulf of Bothnia and oceanic).
There were significant differences among many of the Scotian Shelf Atlantic herring collections; this may be explained by considering the putative populations as belonging to one of three groups within which there are limited differences. The first group encompasses only the Eastern Passage herring, the easternmost population examined on the Scotian Shelf other than that from Bras d'Or Lake. The second group is composed of the herring collected south of Eastern Passage, along the coast of Nova Scotia to Trinity Ledge and offshore to Western Bank. The third group is composed of Georges Bank herring and all three Scot's Bay collections, representing the interior Bay of Fundy and the Gulf of Maine. The one exception to this explanation is the Spectacle Buoy collection from 1998, which was assigned to the Bay of Fundy and Gulf of Maine complex based on FST and MDS. The Spectacle Buoy collection from 1999 falls within the second group, and the location of Spectacle Buoy suggests inclusion with the second. These groupings separate a dimension of the MDS plot (Figure 3). While there are differences among collections between groups (Table 4), there are few instances of significant within-group comparisons after correction for multiple tests.
Temporal Pattern
Allele frequencies were highly correlated between replicate samples taken at Scot's Bay, Spectacle Buoy, and German Bank (Figure 4). However, FST analyses indicate a difference between the collections taken at Scot's Bay in 1998 and 2000. Alternatively, when adequate samples were available, a full year-class analysis (as prescribed by Ward and Grewe 1994) was undertaken and FST revealed no differences among any of the year-classes collected from the same location in different years. Temporal homogeneity was also observed when the variation among year-classes within sample locations was compared with the extent of spatial genetic variation among sample locations. The correlation between allele frequencies of replicate samples and the genetic homogeneity among cohorts from the same location (and in most cases between collections in subsequent years) are consistent with genetic temporal stability at the scale of the spawning group.
Kornfield et al. (1982) concluded that it was doubtful that generational or year-class differences contributed significantly to population differentiation due to the presence of overlapping generations in the collections and the fact that Atlantic herring are iteroparous. However, where Kornfield et al. (1982) did not demonstrate temporal stability among annual collections from the Gulf of St. Lawrence and Gulf of Maine, King et al. (1987) did demonstrate temporally stable patterns of genetic variation in North Sea herring when comparisons were based on year-classes. The contrasting results and interpretations of King et al. (1987) and Kornfield et al. (1982) may simply reflect the different protocols used to assess temporal variation. Although a test of hypotheses related to stability would optimally include samples from each year-class sampled across years (thus allowing a comparison among year-classes through time), the requisite material would be difficult to obtain. Acknowledging the limitations in our data, the results do conform to an explanation based on protocol differences. When comparing samples based on collection year, one is in fact implicitly assuming that there are no differences among year-classes, which is the underlying justification for pooling year-classes and considering the sample as a whole. We therefore suggest that year-class information be included (when possible) when assessing and interpreting genetic temporal stability in marine fishes.
Reconciliation with Herring Population Models
Iles and Sinclair (1982) predicted that the number of geographically stable larval “retention areas” determines the number of genetically distinct Atlantic herring stocks. Accordingly, each distinct gene pool is postulated to encompass all those spawning groups whose larval and postlarval stages come to share (and remain in) the same area of distribution. Such a model implies that natural selection will favor individuals that are “well adapted” (at early life history stages) to remain in population-specific nursery areas and to return to their natal sites for spawning so that progeny have access to these same nursery areas—all in spite of extensive feeding migrations far from the nursery grounds. Herring that do not complete such a life history are considered “vagrants” and do not contribute to the locally adapted gene pool or, importantly, to that of neighboring populations. As proposed by Sinclair (1988), such a process should result in reproductive isolation (and genetic structure) among herring populations.
A more recent conceptual model of population structure for Atlantic herring in the Scotia–Fundy region was proposed by Stephenson (1999) and generalized in Smedbol and Stephenson (2001). The model reorganizes herring spawning groups into complexes that share larval retention areas. The additional layer of complexity (individual–population–complex) also appears in McQuinn (1997), who suggested that environmental instability prevents population isolation and local adaptation in herring and who proposed that the extent of temporal stability (population, habitat, or both) will determine the degree of genetic structuring. McQuinn's (1997) metapopulation (as defined by Hastings and Harrison 1994) model contends that herring persist as a collection of predominantly independent local populations that may be interconnected by migration and subject to extinction and recolonization processes. This population concept differs from that of Iles and Sinclair (1982) because McQuinn contends that the progeny from local populations do not necessarily recruit to their natal populations but may migrate to (and reproduce in) a nearby population.
The contrasting assertions of the retention and metapopulation models allow us to make some generalized predictions about Atlantic herring population structure. The existence of temporally stable genetic differentiation associated with spawning grounds and larval retention areas would support the hypothesis that these areas are essential to the maintenance of population structuring, as proposed by Iles and Sinclair (1982). Alternatively, the absence of temporally stable population differences related to spawning grounds and larval retention areas might indicate that herring population structure is most simply explained by the metapopulation model (at least at the shelf scales considered in this study). McQuinn's (1997) model would appear to be consistent with evidence of isolation by distance, implying that the degree of migration (genetic exchange) is correlated to geographic distance between populations and/or shallow genetic divergence caused by straying and gene flow.
If we attempt to reconcile Iles and Sinclair's model with the data presented, the existence of at least four larval retention sites on the Scotian Shelf and Gulf of Maine region would be necessary. As the Bras d'Or Lake Atlantic herring have limited connections with the Atlantic Ocean (Petrie 1999), it seems reasonable to consider the Bras d'Or Lake as a “stable” larval retention area with limited opportunities for larval dispersal. The inner Bay of Fundy and coastal Gulf of Maine herring complex may also comprise a single larval retention zone. These populations may be separated from the complex that extends south of Eastern Passage to the waters beyond southwestern Nova Scotia. The residual circulation in the Gulf of Maine area (which indicates a recirculation with potential connections to the interior Bay of Fundy, as modeled by Greenberg 1983) and the discontinuity in larval abundance between southwestern Nova Scotia and Scot's Bay (as reported by Sinclair and Iles 1985) are consistent with such a suggestion. The association of the Western Bank herring collections with this southwestern Nova Scotia complex could also be explained by the dispersal pattern of herring larvae and the attendant circulation on the Scotian Shelf, where circulation models and larval length distributions have demonstrated a connection between the offshore banks and the coastal current (Reiss et al. 2000). The relative distinctiveness of herring collected from Eastern Passage is not easily explained. Is it possible that larvae from this location are not entrained and advected in the coastal current? Alternatively, is spawning site fidelity in this location sufficiently strong to preclude straying in spite of larval mixing? Although we are unable to address either of these questions, the availability of temporal replicates in three locations allowed us to consider how allele frequencies vary annually at the scale of the spawning ground. Although allele frequencies between temporal replicates were highly correlated (Figure 4) and spatial genetic variation exceeded temporal genetic variation—which is consistent with the Iles and Sinclair model assuming that there has been sufficient time to accrue differences in the event of reproductive isolation—the magnitude of spatial differentiation was less than would be expected under the scenario of strict natal spawning site fidelity and extremely limited gene flow. While potentially useful in predicting the number of genetically distinct populations or larval retention areas, the retention model may be of limited value in predicting the degree of genetic divergence among herring populations, at least at the spatial scale considered here.
When the Atlantic herring spawning groups are considered within the context of metapopulation complexes, three can be defined (as discussed earlier and shown in Figure 3). In some cases, these complexes can be corroborated with temporal replicates (Figure 3), as two of three sets of temporal replicate samples (Scot's Bay and German Bank) are found in the same groupings. Patterns of population structure do not appear to be spatially random (Figure 3 and discussion above), as the differences detected among populations are largely consistent with impediments to dispersal (gene flow) other than geographic distance (e.g., water circulation). However, McQuinn's (1997) metapopulation model is challenged by the paucity of evidence for isolation by distance (unless McQuinn envisioned dispersal at scales larger than that of the Scotian Shelf–Bay of Fundy), even when Bras d'Or Lake Atlantic herring are excluded because their potential for mixing is arguably limited. This finding is at odds with what would be expected if herring migrated and recruited to neighboring populations and may be a result of nonequilibrium conditions in NW Atlantic herring.
In summary, we have provided evidence for genetic differentiation among spawning groups of Atlantic herring at a number of spatial scales. Replicate samples and year-class analyses, when used to test for the annual temporal stability of allele frequencies at four locations, show stability in the majority of cases. When these results are interpreted within the context of the retention and metapopulation models proposed for herring, we find that neither model is fully consistent with our observations. Dare we suggest the combined use of these models when generating predictions regarding the patterns of spatial and temporal genetic variation in herring?
A positive relationship was observed between pairwise FST estimates and the number of days separating collections. Thus, populations of Atlantic herring in the NW Atlantic may be temporally as well as spatially structured. It is our contention that spawning time, and therefore the presence or absence of spawners from nearby populations, may be responsible for generating population structure in herring of the Scotian Shelf–Bay of Fundy region. The logical consequence is that greater benefit may be associated with harvesting practices that help conserve spawning time (as opposed to spawning location) because it appears that herring migrate and recruit to populations along a temporal (as opposed to spatial) gradient in spawning time; that is, exchange would take place between populations that share a similar spawning time as opposed to a geographic location. An empirical test of this hypothesis may prove challenging, though it might reconcile the inconsistencies among the models and observations we discuss above.
Acknowledgments
We thank R. Stephenson, M. Power, J. Fife, G. Melvin, the Pelagics Research Council (PRC), L. Sullivan, D. Ruzzante, G. Oskarsson, A. Pickle, and many commercial fishers for their assistance in securing samples. We thank K. Spence for laboratory and field assistance, J. Seeb, and J. Olson for providing Pacific herring loci prior to publication, K. Smedbol for stimulating discussions, and P. Bentzen and two anonymous reviewers for comments that improved this manuscript. This work was supported in part by the PRC through Canadian Biotechnology Strategy funding to C.T.T. and E. L. Kenchington and NSERC PGSs to A.A.M.


