Sensitivity of Erythemally Effective UV Irradiance and Daily Exposure to Uncertainties in Measured Total Ozone
Abstract
In this study the sensitivity of the erythemally effective radiation to uncertainties in operationally measured total ozone content of the atmosphere (TOC) was estimated. For this, daily operational TOC measurements from different instruments were applied covering the period from 1997 to 1999. Measurements were gained from space by Earth Probe Satellite, Earth Remote Sensing satellite/Global Ozone Monitoring Experiment and Operational Vertical Sounder and from the ground by Dobson and Brewer spectrophotometers for the locations of Hradec Kralove (Czech Republic, 50°N), Nairobi (Kenya, 1°S) and Springbok (Republic of South Africa, 30°S). The values were used as input parameter to model calculations of erythemally effective irradiance and daily radiant exposure.
The differences due to the use of TOC from different sources were analyzed with respect to the Ultraviolet Index (UVI). The UVI was introduced as a tool for sun protection and health care. Therefore, it is of special importance to know the restriction of accuracy. As a tool of health care, the maximum uncertainties are of interest and are described in using the 95%-percentile and the maximum differences. This study shows that differences, i.e. uncertainties (95%-percentile) are in the order of 1 UVI. Independently on the location, however, extreme differences may overstep 3 UVI. For the daily dose the 95%-percentile is around 7.5 UVI hours (UVIh) but differences higher than 20 UVIh were also found.
Introduction
Stratospheric ozone shields the biosphere from a large part of the solar ultraviolet (UV) radiation by absorbing mainly at wavelengths below 320 nm. It is therefore an essential parameter whenever the photobiological effectiveness of solar UV radiation is studied. The photobiological effectiveness of UV radiation varies from effect to effect, depending strongly on the wavelength and described by the corresponding action spectrum. The higher the action spectrum in the UV-B, the higher is the sensitivity to the total ozone content of the atmosphere (TOC) and to its uncertainties.
The TOC values originate from measurements either from the ground or from space. Spectrophotometers of type Dobson (1,2), Brewer (3), M83/M124 (4,5), the SAOZ (Système d’Analyse par Observation Zénitale) (6), the UV–visible spectrometer (7), the handheld MicrotopsII (8), the UV Multifilter Rotating Shadow Band Radiometer (9,10) and others were designed for terrestrial observations.
For the period covered by the study, three different space-based instruments delivered daily data of TOC on a global scale: the Total Ozone Mapping Spectrometer (TOMS) aboard NASA’s Earth Probe Satellite (EPTOMS) (11), the Global Ozone Monitoring Experiment (GOME) aboard European Space Agency’s (ESA’s) Earth Remote Sensing satellite (ERS-2) (12,13) and the Television Infrared and Observational Satellite (TIROS-N) Operational Vertical Sounder (TOVS) series of instruments (14).
During the past, several studies were undertaken to estimate the accuracy of TOC measurements. The best known, because extensively examined and intercompared, are the properties of measurements gained by the Brewer and the Dobson spectrophotometers (15). For all other instruments many studies are available too. Extensive work was carried out on data from TOMS by Fioletev et al. (16) validating data from Nimbus7 with respect to Dobson, Brewer and M83/M124 instruments. Measurements from all four TOMS instruments and GOME were compared by Bodecker et al. (17) to measurements from the Dobson Network. Lambert et al. (18) examined measurements from EPTOMS, the Advanced Earth Orbiting Satellite (ADEOS) and GOME using data from the Network for Detection of Stratospheric Change including SAOZ, Dobson, Brewer and UV–vis spectrometer. While up to 1997 TOMS and TOVS already had a long tradition starting from 1978, GOME was quite a new instrument. Concerning the ozone retrieval, a great deal of experience was gained in the meantime and the algorithm was significantly improved. In a recent study, Lambert and Balis (19) concluded that TOC of GOME version 4.0 reaches the accuracy of ground-based measurements of well-calibrated Dobson and Brewer instruments (13). Many other intercomparison examples can be found in the literature. Only for TOC from TOVS, intensive comparisons are still missing. From all these studies it became evident that differences and uncertainties may depend on solar zenith angle, geographical position, altitude, cloud properties, cloud coverage, aerosol content and type and ozone vertical profiles as well as the intrinsic design of the instrument.
In general, the biologically effective UV radiation can be estimated either by weighting a measured solar spectrum, by converting measurements from broadband meter or by weighting a modeled spectrum. In many cases modeled values are necessary. Progress in UV model development has led to models, in which the main source of inaccuracy of model calculations (under clear sky) is no more the mathematical method used to solve the radiative transfer equations, but it is the inaccuracy of the input data, i.e. all the variables affecting UV such as ozone, single scattering albedo, aerosols and ground albedo. Uncertainties in model outputs in dependence on several variables were investigated in detail in the past by Schwander et al. (20), Weihs and Webb (21) and others. The TOC is the main input parameter for clear sky.
The UV Index (UVI) was jointly defined in 1995 by the International Commission on Nonionizing Radiation Protection (ICNIRP), the World Health Organization (WHO) and the World Meteorological Organization (WMO) (22) as a measure of the erythemally effective irradiance. The UVI is the internationally agreed (23,24) base for sun protection, risk assessment and health care and widely used in public information campaigns (25). Therefore, it is important to know the accuracy of promoted daily values.
In this paper, we focus on the sensitivity of the erythemally effective UV radiation, the UVI, to the uncertainties in measured TOC. It is not arbitrary which TOC measuring device is the golden standard. For this, measurements of TOC from the ground (Brewer and Dobson spectrophotometer) and from space borne instruments (EPTOMS, GOME, TOVS) for three different locations (50°N, 1°S and 30°S) are used to estimate the influence of measurement uncertainties to the erythemally effective UV radiation.
The sites were selected to examine the influence in dependence of latitude, especially solar height and the length of the day. Additionally, the ozone layer exhibits different behavior over each station. In the tropics, the ozone layer is mainly influenced by photochemistry. The annual mean value of TOC is rather low as well as the fluctuations within the year. In the subtropics, photochemical processes are still obvious but atmospheric dynamics get influenced. TOC values are higher and the annual course shows a higher amplitude. At higher latitudes the main influence is atmospheric dynamics. The TOC mean is the highest and TOC exhibits a strong annual course with high fluctuations.
The considered time series of TOC consist of data from the operational near-real-time data processing systems, which deliver the data within a few hours after the satellites overpass. This kind of data was gathered for the period January 1997 to December 1999. The data are not taken from reanalysis or improved algorithms.
The limitation in accuracy is estimated for the daily maximum irradiance (expressed in units of UVI) and the daily radiant exposure or daily dose. The latter is expressed in units of UVI hours (UVIh) following the suggestions of Saxebøl (26). As UVI is a tool of radiation protection, less attention has to be paid on a mean accuracy than on the highest inaccuracies. High errors in the UVI, especially an underestimation may lead to sun burn of applicants, i.e. an acute injury as well as a risk enhancement for developing skin cancer later on in life.
Materials And Methods
The different TOC data sets are applied separately as an input to model calculations. The resulting differences in calculated irradiance and daily dose are used as a proxy for the limitation in the accuracy in the erythemally effective UV radiation. To explain the resulting differences in irradiance and daily dose, the initial TOC values are intercompared too.
Data of total ozone. The first data set of TOC is derived from NASA’s EPTOMS (11) which has provided data since July 1996. TOMS, on board the Earth Probe Satellite, measures incident solar radiation and backscattered UV sunlight at six near-UV wavelengths. Total ozone is retrieved from these measured spectra. The single retrievals of TOC are then gathered each day and gridded globally. In this study, we used these daily gridded data sets.
The second data set results from the GOME instrument, which has provided trace gas measurements since 1995 aboard the ESA’s ERS-2 (12,27). The instrument has a broad spectral coverage (240–790 nm) which is coupled with a high spectral resolution (0.2–0.4 nm). TOC is retrieved from backscattered solar radiation by Differential Optical Absorption Spectroscopy (28). As global coverage is achieved after 3 days only, daily gridded TOC values are gained by using a spectral statistical interpolation method (29,30).
The third satellite-based data set of TOC is derived from TOVS. The TIROS-N TOVS series of instruments have flown aboard the National Oceanic and Atmospheric Administration's (NOAA) operational meteorological satellites since 1978 (14). They were primarily designed as a source of meteorological data (notably temperature and moisture). Information on the TOC is provided by exploiting the 9.7 µm channel which was originally included to remove ozone effects from the temperature sounding channels. TOVS measures mostly the lower stratospheric ozone and is quite insensitive to middle- and upper-stratospheric ozone. In contrast to TOMS and GOME, TOVS can provide data also during polar night.
The considered time series of TOC consist of data from the operational near-real-time data processing systems, which deliver the data within a few hours after the satellites overpass. Data of this kind were gathered for the period January 1997 to December 1999. The data were not taken from reanalysis or improved algorithms.
Measurements from the ground are performed at the Solar and Ozone Observatory in Hradec Kralove (50.183°N, 15.833°E, 285 m asl), Czech Republic. TOC measurements have a long tradition at this observatory dating back to the 1960s. The instruments are the Brewer Spectrometer MKIV No. 98 and the Dobson Spectrophotometer Beck No. 74 (15).
Springbok (Republic of South Africa, 29.7°S, 17.9°E, 1006 m asl) is the southernmost station of our sample. Data were collected by the South African Weather Service and originated from measurements of a Dobson spectrophotometer (Beck No. 123).
For Nairobi (Kenya, 1.3°S, 36.8°E, 1710 m asl) the measurements of a Dobson spectrophotometer (Beck No. 18), performed at the nearby observatory, are taken. This data set was provided by the World Ozone and Ultraviolet Data Centre (WOUDC). For analysis, only three complete years are taken (1997–1999). No newer data for Nairobi are delivered to the WOUDC and no other equatorial site with a similar longitude as Hradec Kralove and Springbok is on duty. To enable comparability, we have restricted all other data sets to this period.
All these ground-based TOC values are given as daily mean resulting from several measurements during a day. As we use the gridded data from the satellites, they are interpolated for the respective geographical location of the stations from the surrounding grid points.
Limitations of accuracy in estimations of the erythemally effective UV radiation. To quantify the influence of uncertainties in measured TOC to calculations of the erythemally effective radiation, model calculations were performed with a fast spectral UV radiation model. This model was developed at the Institute of Medical Physics and Biostatistics, University of Veterinary Medicine, Vienna, in 1995 (31) following a suggestion by Diffey (32) with several improvements. The radiation model calculates the spectral irradiance at 17 discrete wavelengths between 297.5 and 400 nm with higher resolution in the UV-B than in the UV-A. The calculations based on the database from Bener (33) was gained from spectral measurements made over several years at Davos (46°48′N, 9°49′E, 1590 m asl). A detailed description of the model can be found in Schmalwieser et al. (34). The erythemally effective irradiance is gained by using the Commission Internationale de I'Eclairage (CIE) action spectrum of the erythema (35) for weighting followed by the integration over the whole spectral range. The erythemally effective irradiance is expressed in units of the UVI as defined by WHO, WMO, ICNIRP and CIE (22–24) and widely used in monitoring and forecasting (25). The UVI is gained numerically by multiplying the erythemally effective irradiance given in Weff m−2 by 40; 1 UVI corresponds to 0.025 W m−2. The erythemally effective daily dose is gained by integrating the daily course of the effective irradiance from sunrise to sunset. For the daily dose, a UVIh is used as a unit, following the suggestion of Saxebol (26) and as applied by Schmalwieser et al. (36). A received dose of 1 UVIh is equal to 90 J m−2 or 0.9 SED (standard erythemal dose) (37).
The model was validated in the past by a comparison with other models (31,38,39) as well as by a comparison with measurements made at four continents for irradiance (34) and daily dose (36). These validations have shown that the model has no systemic bias corresponding to solar height and total ozone.
For this work, an aerosol free atmosphere and cloud free sky was assumed to point out the maximum influence as it is important for radiation protection. Therefore, the amount of input parameters is restricted to date, time, geographical position, altitude and TOC.
Using TOC data from each instrument separately as input parameter, the maximum daily irradiance (solar noon) and daily doses are calculated for each day. The statistical analysis of differences in the outcome provides the limitation of accuracy. Analysis of these differences is carried out using the mean bias, the median (50% percentile) of absolute amount of differences (p50), the 95% percentile of absolute differences (p95) and the maximum absolute differences (p100). On a monthly scale, p95 gives the uncertainty which is overstepped on one day per month.
We further compare the different data sets of TOC at each location. The comparison is made for the whole period of collected data in respect to annual, monthly and daily differences to characterize the TOC and uncertainties at the respective locations. The differences in TOC between the measurements of the different instruments are studied using the mean bias, p95 and p100.
Results
Hradec Kralove (50°N)
Total ozone measurements. Total ozone content values of the atmosphere over Hradec Kralove show high seasonal variability (Fig. 1a) ranging from more than 500 DU down to below 200 DU. The highest values of TOC over Hradec Kralove are measured from January to May. Monthly mean values are the highest from February to June and the lowest between October and January. The variability of TOC shows a seasonal pattern as well, with high values from December to March. During this period TOC may vary within a month by more than 200 DU.
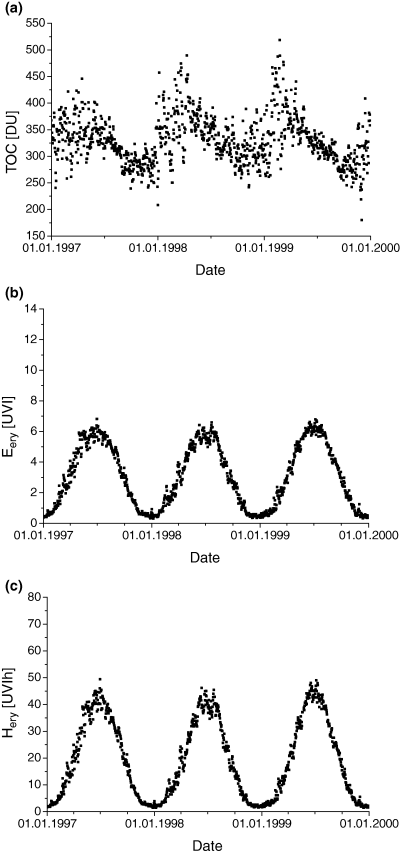
(a) Measurements of TOC taken with the Dobson spectrophotometer at Hradec Kralove (50.2°N, 15.8°E), (b) modeled erythemally effective daily maximum irradiance (Eery) and (c) daily dose (Hery) for clear skies.
The extreme low TOC values are caused by ozone miniholes which appear periodically during the winter at middle and higher latitudes (40) and may raise biological effective radiation significantly (41). Two extremes examples of this event were found in the data sets. The first one showed its minimum value on 1 January 1998 where values from the Dobson, Brewer and EPTOMS lie between 194 DU and 208 DU. GOME and TOVS deliver, on the other hand, values of 234 DU and 245 DU for this date which were also the lowest values in 1998, but significantly higher. The second extreme ozone minihole within the data sets was found around 1 December 1999. This event was recorded by Brewer (180 DU), EPTOMS (200 DU), GOME (201 DU) and Dobson (212 DU). Similar to the first event, TOVS delivered a value of 240 DU for this date.
The mean TOC values over the whole period (1997–1999), calculated for each instrument, are close to each other. Brewer, Dobson, EPTOMS and GOME agree within 1%, delivering 329, 328, 331 and 327 DU, respectively. For TOVS a value of 340 DU was obtained, which is 3% higher than the values calculated for the others.
These low differences do not hold when one considers shorter periods. The differences depend on the time of the year (Fig. 2a). The mean bias between TOVS and all other instruments shows the most obvious and asymmetric (around zero) seasonal course, with a tendency for high values between September and January which reach up to 11%. During spring and summer, the mean bias is quite close to 0%. The differences between GOME and all others show a similar behavior but being slightly smoother and in general symmetrically around zero, the mean bias is between ±4% with extremes around March (+4%) and around October (–4%). Comparisons including the Dobson deliver the smoothest courses, and the lowest amplitude of ±0.9% is found between Dobson and Brewer.
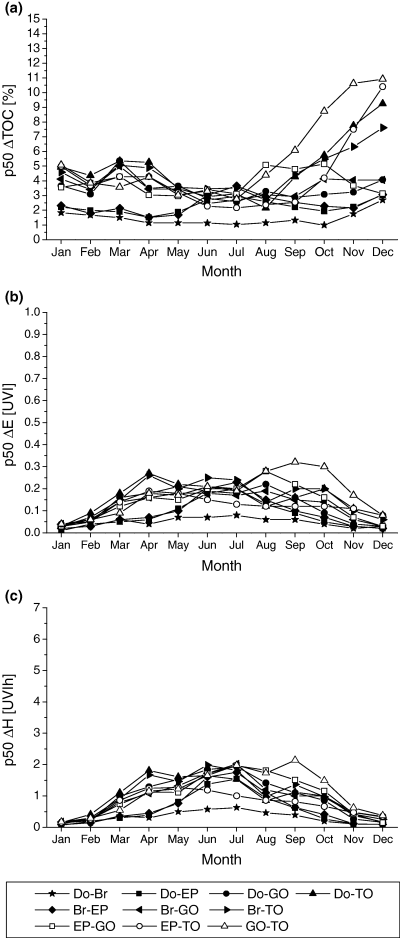
(a) 50%-percentile (p50) of absolute differences (ΔTOC) in TOC measurements between different instruments, (b) corresponding p50 of absolute differences in erythemally effective daily maximum irradiance (ΔE) and (c) daily dose (ΔH) for the location of Hradec Kralove (50.2°N, 15.8°E).
The p95 (Fig. 3a) of absolute differences shows a general trend toward higher values between October and March reaching up to 18.1% (EPTOMS-TOVS, December). The lowest p95 was found for Dobson–Brewer differences (2.7%, July). On certain days between November and February extreme differences (p100) are close to 30% or even above for most of the couples (Fig. 4a).
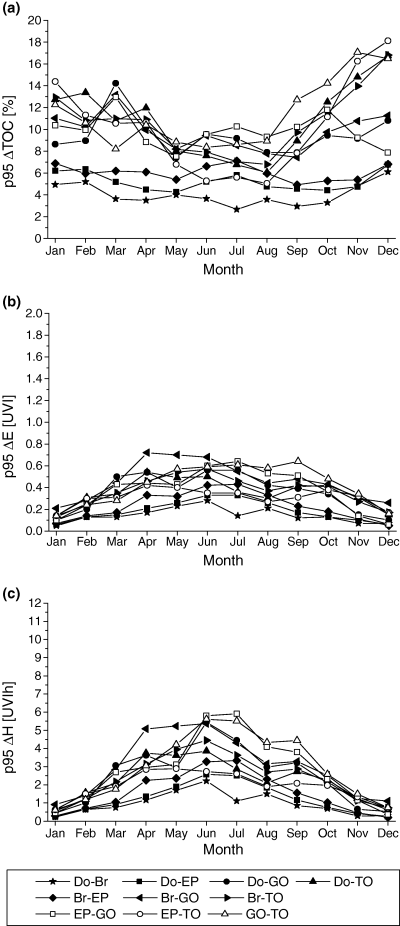
(a) 95%-percentile (p95) of absolute differences (ΔTOC) in TOC measurements between different instruments, (b) corresponding p95 of absolute differences in erythemally effective daily maximum irradiance (ΔE) and (c) daily dose (ΔH) for the location of Hradec Kralove (50.2°N, 15.8°E).
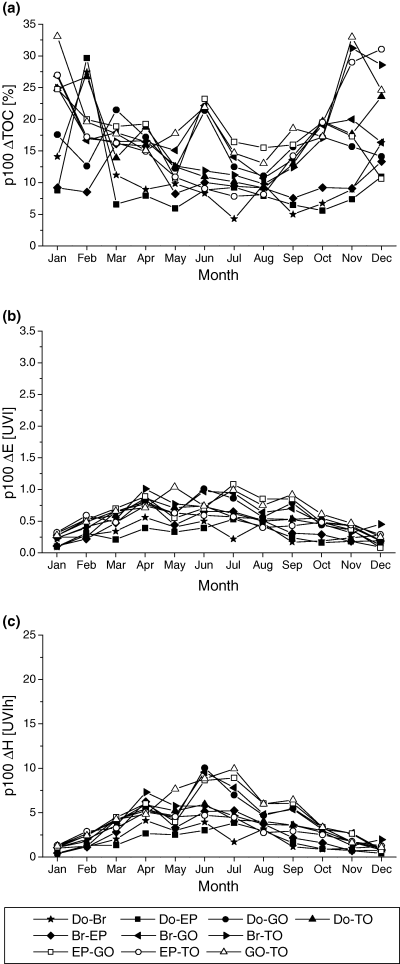
(a) 100%-percentile (p100) of absolute differences (ΔTOC) in TOC measurements between different instruments, (b) corresponding p100 of absolute differences in erythemally effective daily maximum irradiance (ΔE) and (c) daily dose (ΔH) for the location of Hradec Kralove (50.2°N, 15.8°E).
Influence on the modeled erythemally effective UV radiation. Using each TOC data set separately as input parameter, the erythemally effective UV radiation is calculated for clear sky over the whole period of collected data for solar noon and for the whole day. Irradiance and daily dose for the location of Hradec Kralove, modeled with TOC from the Dobson, are shown in Figs. 1b,c. It can be seen that values at solar noon range within a year from 0.5 (December) to 7.0 UVI (June) and the daily dose varies between 2 and 50 UVIh. The annual means are of 3.0 and 19.5 UVIh, respectively for solar noon irradiance and daily dose. The annual mean values of these parameters, derived from different instruments, agree within ±0.3 UVI and ±2.3 UVIh, respectively.
The monthly medians (p50) of absolute differences in irradiance (Fig. 2b) show a significant annual cycle. Differences between Brewer, Dobson and EPTOMS peak generally during June and July. Comparisons including GOME tend to peak in August and September, while comparisons including TOVS deliver the highest medians in April and May. The p50 ranges from 0.01 (Dobson-EPTOMS in January) to 0.32 UVI (EPTOMS-TOVS in September). For daily dose (Fig. 2c), the annual patterns of p50 peak mainly during June or July (beside GOME-TOVS [September] and DOBSON-TOVS [April]), which is associated clearly with the length of the day and are within 0.06 (Dobson-EPTOMS, January) and 2.2 UVIh (GOME-TOVS, September).
Similar to the annual patterns of the p50 are those of the p95 (Fig. 3b,c) which also peak between April and September in dependence on the instruments that are compared. They are below 0.21 (Dobson-EPTOMS, January) and 0.72 UVI (Brewer-GOME, April). The values of p95 in daily dose are below 0.91 (Brewer-GOME, January) and 6.0 UVIh (EPTOMS-GOME, July).
Values of p100 (Fig. 4b,c) are within 0.3 UVI (3.85 UVIh) (December and January) and 1.08 UVI (EPTOMS-GOME, July) for solar noon irradiance and between 3.85 (December and January) and 10.4 UVIh (Dobson-GOME, June) for daily dose. Similar values for irradiance can be found between April and August.
Springbok (30°S)
Total ozone measurements. At Springbok the TOC exhibits a smoother seasonal course than at Hradec Kralove. Values range from 230 to 384 DU (Fig. 5a) and the highest daily TOC values as well as the highest monthly mean values are measured from August to December. The lowest values are found from February to July. From June to October, the TOC shows high variability with values changing by 100 DU within a month.
(a) Measurements of TOC taken with the Dobson spectrophotometer at Springbok (29.7°S, 17.9°E), (b) modeled erythemally effective daily maximum irradiance (Eery) and (c) daily dose (Hery) for clear skies.
The mean TOC values over the whole period (1997–1999) do not agree so well as at Hradec Kralove: GOME 264 DU, Dobson 274 DU, EPTOMS 276 DU and TOVS 287 DU but are within ±5%. TOC values from GOME are generally lower than those measured by the others. The mean bias to Dobson and EPTOMS can be found at a level of −4% varying within the year between −3% and −6%. TOVS generally delivers the highest values which leads to an annual mean bias level of +4% compared with Dobson and EPTOMS. The comparison between GOME and TOVS delivers therefore the highest values of p50 (Fig. 6a), especially during winter (12%, June and July). During summer differences are in the order of 6%.
(a) 50%-percentile (p50) of absolute differences (ΔTOC) in TOC measurements between different instruments, (b) corresponding p50 of absolute differences in erythemally effective daily maximum irradiance (ΔE) and (c) daily dose (ΔH) for the location of Springbok (29.7°S, 17.9°E).
Dobson and EPTOMS agree quite well, with values for p50 lower than 2% with no seasonal dependence. Similarly, the p95 between Dobson and EPTOMS does not show a clear annual course (Fig. 7a) slightly varying around 3%. In contrast to this, the p95 for all other comparisons peaks between May and September reaching up to 19% (GOME-TOVS, June). The p100 values (Fig. 8a) may reach values of up to 24% (GOME-TOVS, May) with a slight tendency for being the lowest from February to March.
(a) 95%-percentile (p95) of absolute differences (ΔTOC) in TOC measurements between different instruments, (b) corresponding p95 of absolute differences in erythemally effective daily maximum irradiance (ΔE) and (c) daily dose (ΔH) for the location of Springbok (29.7°S, 17.9°E).
(a) 100%-percentile (p100) of absolute differences (ΔTOC) in TOC measurements between different instruments, (b) corresponding p100 of absolute differences in erythemally effective daily maximum irradiance (ΔE) and (c) daily dose (ΔH) for the location of Springbok (29.7°S, 17.9°E).
Influence on the modeled erythemally effective UV radiation. The erythemally effective UV irradiance and daily dose under clear sky range from 3 (July) to 11 UVI (December and January) and from 14 to 73 UVIh, respectively. The daily maximum irradiance and daily dose, modeled using TOC values from the Dobson are shown in Fig. 5b,c. The mean values of daily maximum irradiance and daily dose over the period of available data are calculated to be 6.8–7.2 UVI and 40.8–45.5 UVIh, respectively in dependence on the instrument.
The values of p50 do not show very significant annual cycles (Fig. 6b,c). The p50 ranges from 0.05 (Dobson-EPTOMS, June and July) to 0.67 UVI (GOME-TOVS, January and August). For daily dose the annual patterns of p50 values are slightly connected with the length of the day, however, EPTOMS-TOVS and Dobson-TOVS peak in August. They are within 0.3 (Dobson-EPTOMS, July) and 4.8 UVIh (GOME-TOVS, December).
The annual course of the p95 values does not show a significant pattern (Fig. 7b,c). The p95 values for daily maximum irradiance lie between 0.14 (Dobson-EPTOMS, June) and 1.16 UVI (GOME-TOVS, November). The p95 values for daily dose lie between 0.84 (Dobson-EPTOMS, June) and 8.2 UVIh (GOME-TOVS, November).
The p100 in irradiance reach up to 2.0 UVI and may occur all through the year (Fig. 8b). For daily dose p100 reach up to 14.3 UVIh and tend to occur between September and January (Fig. 8c).
Nairobi (1°S)
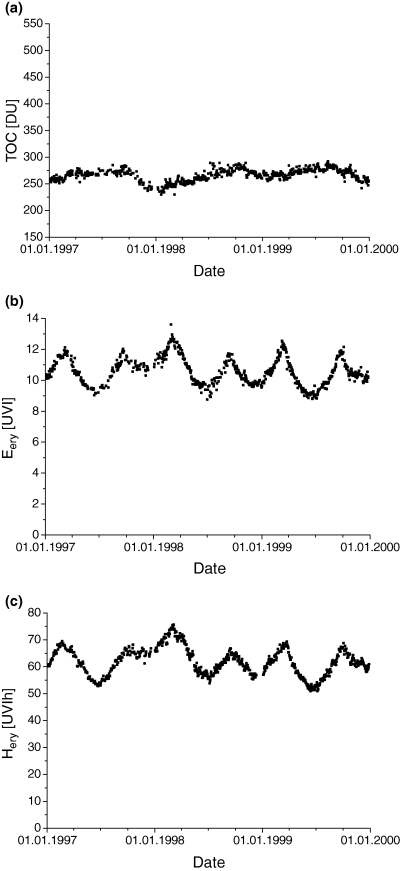
Total ozone measurements. At Nairobi measurements from the Dobson spectrophotometer are available until 1999 and from EPTOMS since mid of 1996, hence the period of comparability ranges from 1997 to 1999. The TOC over Nairobi (Fig. 9a) shows the lowest seasonal variability ranging from 220 (December and January) to 290 DU (August). The highest TOC values are found between July and November and the lowest TOC values occur between November and March. The variability is the highest from September to November, when TOC varies less than 50 DU within a month.
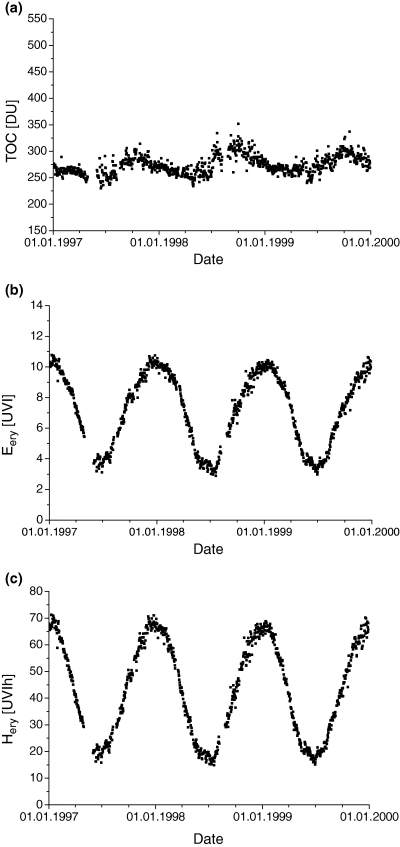
(a) Measurements of TOC taken with the Dobson spectrophotometer Nairobi (1.3°S, 36.8°E), (b) modeled erythemally effective daily maximum irradiance (Eery) and (c) daily dose (Hery) for clear skies.
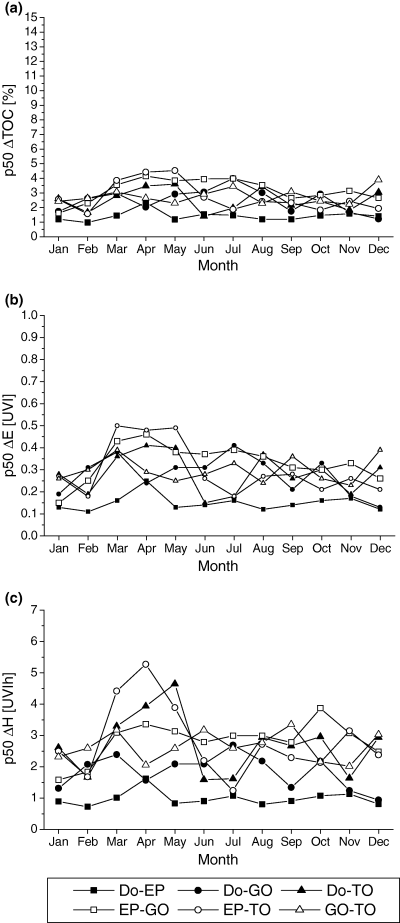
The mean TOC values of each instrument over the whole period agree within 9 DU: GOME 259, TOVS 263, Dobson 266 and EPTOMS 268, respectively ±3.5%. Only the mean biases between EPTOMS, Dobson and TOVS show clear seasonal patterns with higher values from March to May, reflected also in the p50 values of Fig. 10a.
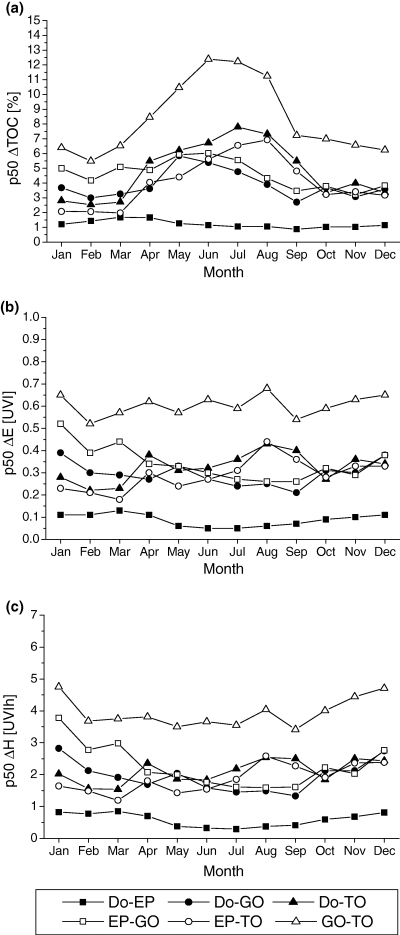
(a) 50%-percentile (p50) of absolute differences (ΔTOC) in TOC measurements between different instruments, (b) corresponding p50 of absolute differences in erythemally effective daily maximum irradiance (ΔE) and (c) daily dose (ΔH) for the location of Nairobi (1.3°S, 36.8°E).
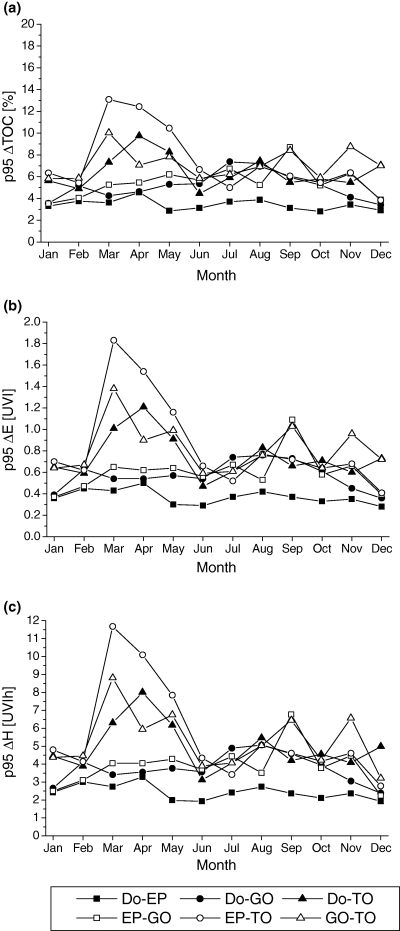
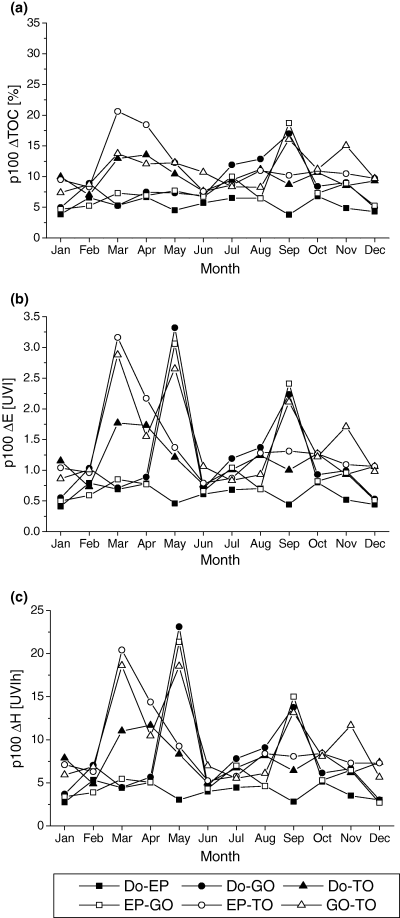
The p95 values (Fig. 11a) range from 2.87% (DOBSON-EPTOMS, May) to 13.1% (EPTOMS-TOVS, March) and are generally in the order of 5%. Higher values are obvious from comparisons including TOVS, for which peaks occur from March to May. The p100 (Fig. 12a) may exceed 18% during March and April (EPTOMS-TOVS) and in September (EPTOMS-GOME).
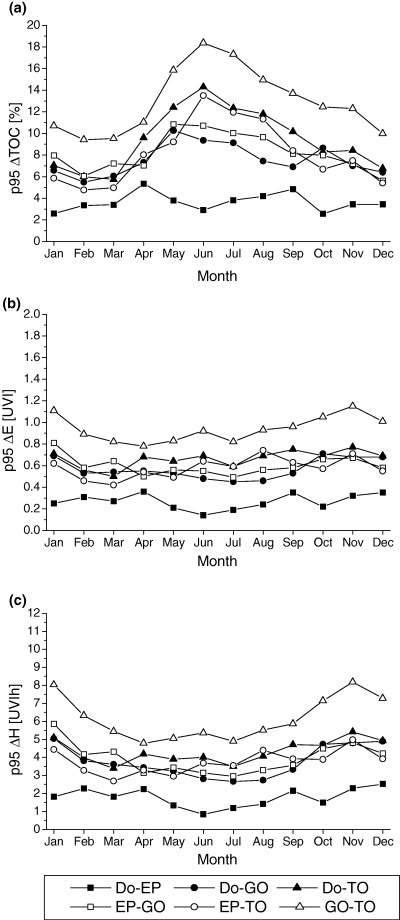
(a) 95%-percentile (p95) of absolute differences (ΔTOC) in TOC measurements between different instruments, (b) corresponding p95 of absolute differences in erythemally effective daily maximum irradiance (ΔE) and (c) daily dose (ΔH) for the location of Nairobi (1.3°S, 36.8°E).
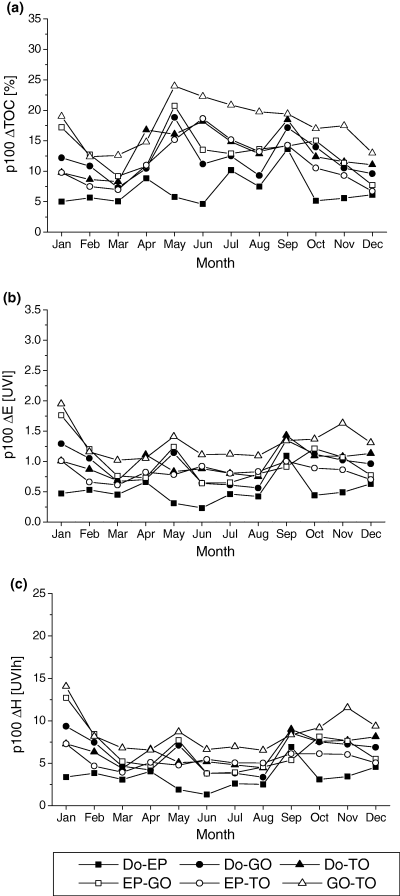
(a) 100%-percentile (p100) of absolute differences (ΔTOC) in TOC measurements between different instruments, (b) corresponding p100 of absolute differences in erythemally effective daily maximum irradiance (ΔE) and (c) daily dose (ΔH) for the location of Nairobi (1.3°S, 36.8°E).
Influence on the modeled erythemally effective UV radiation. The erythemally effective UV radiation at solar noon varies between 9 and 13 UVI. In some extreme cases values up to 14 UVI were calculated. The daily dose values are within 50 and 80 UVIh. Their annual course has naturally two peaks, one in March and the other in September (Fig. 9b,c). As the TOC is close to its maximum in September, the erythemally effective UV radiation is somewhat higher in March. The calculated annual mean values are around 10.5 UVI (62.5 UVIh) and do not differ more than 0.3 UVI (1.8 UVIh).
The highest monthly p50 values of daily maximum irradiance (Fig. 10b), up to 0.50 UVI, were found for comparisons of EPTOMS and TOVS from March to May. In general, the lowest p50 values can be found for differences between Dobson and EPTOMS (0.10 UVI in February to 0.24 UVI in April).
The best agreement in daily dose at the p50 level (Fig. 10c) occurs between Dobson and EPTOMS (0.70–1.62 UVIh) while all other deliver values which are two to three times higher reaching 5.5 UVIh (GOME-TOVS, August).
Similar to the p50 values, the lowest p95 values are found for the couple of Dobson and EPTOMS (0.28–0.50 UVI [June, April] and 1.93–3.28 UVIh [June, April]) (Fig. 11b,c). The highest p95 is found for EPTOMS-TOVS (1.82 UVI and 11.84 UVIh in March). The highest value of p100 (Fig. 12b,c) results from DOBSON-GOME (3.3 UVI and 23.1 UVIh, May). Values of p100 that are higher than 3.0 UVI or 20 UVIh, are found also for EPTOMS-GOME (May) and EPTOMS-TOVS (March).
Discussion
The UVI was introduced as a standardized measure to express the erythemally effective irradiance as a unit less number. From the UVI recommendations for sun protection can be derived (23). Nowadays, current values of the UVI are published in many countries on a daily or even hourly basis as measured and/or modeled values (25). The aim of the UVI, i.e. sun protection, is to avoid health damage. Therefore, it is of special importance to know the accuracy of the promoted UVI values. Errors, especially underestimation, would lead to less sun protection and failure in its goal. In this paper, the limitation of accuracy (sensitivity) is estimated with respect to the uncertainties of measured TOC.
The usage of a certain source for TOC depends on several constraints and requirements like the availability at a certain site on the ground, required temporal or spatial resolution, or on the connection with other atmospheric and radiation parameters which can also be measured by an instrument. In many papers, the quality of TOC measurements was examined. From all these studies it became evident that differences and uncertainties may depend on solar zenith angle, geographical position, altitude, cloud properties, cloud coverage, aerosol content and type and ozone vertical profiles as well as the intrinsic design of the instrument. On the other hand, there is also a variety of studies which estimate the influence of TOC on model calculations of the UV radiation. This work bridges the gap between both fields by calculating the uncertainty in the UVI due to the uncertainty of TOC.
In agreement with earlier studies we find a high agreement in annual mean values of TOC. However, for the purpose of sun care daily values are necessary. Their agreement is much lower. The purpose of sun and health care needs a high degree of safety. It means that the highest errors are more meaningful than mean errors. Therefore, we have calculated the p95 for each month of the year as an indicator of accuracy. The p95 gives the error which may be reached on one day per month.
For this study we have assumed clear sky conditions as most relevant for sun protection. However, even on a cloudy day the duration when the sun is not occulted by clouds is long enough to cause sunburn. As some of us have recently shown for several locations around the world the UVI at solar noon measured under all sky conditions differs less than ±0.5 UVI in about 50% of all cases from clear sky values (34). For daily dose, a difference less than ±2.5 UVIh was for the range between 33% and 60% for all cases (36).
Comparing 3, 7, 11 it becomes obvious that p95 in irradiance and daily dose are much less related to latitude than irradiance and daily dose are. At 50°N the annual course of the p95 in irradiance and dose is dominated by solar height and the length of the day. The high p95 values for TOC in winter raise the uncertainties in this season, but irradiance is by a factor 14 lower than in summer, and daily dose by a factor of 25, respectively. Therefore, solar height and the length of the day are dominators. At 30°S, similar to 50°N, the annual course of the p95 in TOC is the highest during winter and the lowest in summer. However, the relative annual course of irradiance and dose is not as strong. Therefore, the annual pattern of p95 in irradiance and dose shows only a smooth annual course. At the equator, the variation of irradiance at noon and daily dose during the year is rather low. Therefore, the annual pattern of p95 in TOC can be seen clearly in the annual courses of p95 in irradiance and daily dose.
This study shows that for the location at 50°N one has to take into account an error (p95) of 0.7 UVI between April and September, i.e. of 5–6 UVIh. The minimal erythemal dose (MED) for skin type 1 is approximately 2.5 and 3.5 UVIh for skin type 2, 4.5 UVIh for skin type 3 and 5.5 UVIh for skin type 4. Therefore, one can approximate the error in daily dose to be 2 MED (for skin type 1) which corresponds straightforward to an uncertainty in a sun protection factor (SPF) of 2. At 30°S the error is 1 UVI and 7.5 UVIh, respectively for daily maximum irradiance and daily dose. Like before, it results in an uncertainty of 3 MED and 3 SPF.
At the equator the values are quite similar to those at 30°S. Only in March and April, the p95 values of 1.8 UVI and 10 UVIh (4 MED, 4 SPF) could occur when using TOVS TOC. Otherwise the p95 values for daily maximum irradiance and daily dose are below 1.0 UVI and 7.5 UVIh respectively, denoting 3 MED and 3 SPF for skin type 1.
From these results we can summarize that on the global scale the UVI values can be given by ±1 UVI. For a promoted SPF for the most sensitive skin type 1, we recommend to add a value of 3 to the calculated value. Furthermore, the results of our study can be used to estimate the p95 errors for effects other than the erythema by using a radiation amplification factor (RAF). The RAF for a certain photobiological effect describes the change of the effective radiation due to a change or respectively a difference in the TOC. RAFs are frequently given in the literature.


