Morphometric Dual-Energy X-Ray Absorptiometry of the Spine: Report of a Large Series and Correlation with Axial Bone Mineral Density
Abstract
We studied vertebral morphometry and its relation to bone mineral density (BMD) in normal Brazilian women (n = 605). All women (age 22–97 years) were ambulatory and healthy. A lateral spine scan was done for morphometric X-ray absorptiometry using an imaging densitometer. In 429 of these women, BMD of the spine and proximal femur also were measured using dual-energy X-ray absorptiometry. All women were white with mean (± 1 SD) age of 53.7 (± 9.5) years. About 21% of the women over 50 years had a T score for spine BMD lower than –2.5 SD, and 7% had a femoral neck BMD below this osteoporosis threshold. Vertebral heights (anterior, HA; middle, HM; and posterior, HP) and ratios (HA/HP and HM/HP) were assessed. There was no systematic difference between younger (20–49 years) and older (50+ years) women in heights or ratios. The vertebral heights were normalized for those observed in each individual case for the L2–L4 sequence. This normalization was adequate for all vertebral heights; the Z score averaged about +0.1. The average Z score for HA/HP was +0.01, but that for the HM/HP was −0.72, indicating that the latter ratio might differ from the reference population used (white American and European women). We observed a small positive correlation between vertebral heights and spine or femur BMD, but this was due entirely to the influence of body size on BMD. On a group basis, the HM/HP showed a significant association with axial BMD; the 1 SD difference between the lowest and highest quartile was associated with a difference of 8–15% (0.5–1.0 SD) in axial BMD.
INTRODUCTION
OSTEOPOROTIC FRACTURES result in considerable mortality, morbidity, and high medical cost.1, 2 The vertebral body, proximal femur, and distal forearm are among the most commonly affected skeletal sites. In postmenopausal women, the lifetime risk of each of these fractures is approximately 15%.3 Although hip and wrist fractures can be clinically diagnosed and identified unambiguously on radiographs, there are no reliable criteria for identifying osteoporotic fractures in the spine. Vertebral fractures are identified by crush, biconcave, and wedge deformities on plain lateral radiographs of the vertebrae. However, there is considerable difficulty defining a “vertebral fracture,”4, 5 in part because only about 30% of clear vertebral deformities are clinically significant. In this regard, it is often difficult to discriminate between an osteoporotic fracture and normal variation in vertebral shape or a vertebral deformity or fracture that may have occurred a long time ago.
Clinical vertebral fractures are associated with significant morbidity.6-9 However, moderate deformity of a single vertebra might not be a specific indicator of fracture; the involvement of two or more vertebrae, or the occurrence of one severe deformity, might be a better indicator of a symptomatic fracture.9-11 Another aspect of the difficulty is technique variations in the lateral spine radiographs that are used for assessment, including variation in the angulation of the patient and under- or overexposure in different regions.12 The procedure normally requires two lateral exposures (thoracic and lumbar regions) and results in effective radiation dosages of up to 2.1 mSv.13 In addition, there is a high degree of image distortion due to the cone-beam geometry of the imaging system and the difference in focal spot location on each film, typically centered over T8 and L3. The most critical problem, however, is variation in the qualitative assessment of deformity, even among experienced radiologists. In one study, radiologists reached agreement on “fracture” in only one-third of the cases.14 Differences among countries in the prevalence of vertebral fracture may reflect these uncertainties.15
Development of a consistent typology (biconcave, wedge, compression) can aid qualitative evaluation,16 but the major improvement over the past 15 years derives from measurement of the posterior, middle, and anterior heights of the vertebra on lateral spine radiographs, either directly or after digitization.13, 17-30 As an example, six markers manually located on bony landmarks are used for the height definitions. In this quantitative morphometric analysis, deformities may be detected by comparing vertebral height ratios (anterior/posterior or mid/posterior) derived from the measured vertebral heights with reference values in conjunction with a classification system,30 or by direct comparison of the measured heights with predicted normal or reference values.31 When compared with reference values, changes in vertebral height ratios (deformities) are commonly taken as significant if they are substantially below normal at a given vertebral level, usually around 3 or 4 SD below. Less pronounced deformities are poorly associated with clinical manifestations; however, depending on the clinical presentation such deformities might still be generally considered fractures.10 Even with more uniform methods, the use of a standard criterion of abnormality, and vertebral height ratios, there are still substantial uncertainties in assessing subjects of different body size, and there remain inexplicable differences among populations in the prevalence of spinal deformity.15, 26, 32, 33
The recent development of morphometric X-ray absorptiometry (MXA) allows a more uniform acquisition procedure, with little or no magnification, smaller effective dose to the patient, and a more consistent software-guided analysis.34-36 In the present investigation, we have developed reference data for MXA in Brazilian women using an imaging densitometer. We also measured axial bone mineral density (BMD) in these women to examine its association with incipient vertebral deformity. It is well documented that vertebral deformities and fracture are associated with low axial BMD.37-39 As a group, patients with spine fracture have BMD that is ∼3 SD below the level in young normal and ∼1 SD below the level in age-matched patients. In fact, there is a continuous gradient of risk between the frequency of fracture and BMD. However, we wanted to see if an association could be detected in normal women prior to the occurrence of significant anatomical alteration.
MATERIALS AND METHODS
Patients
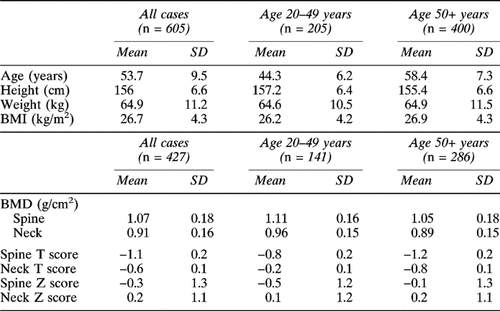
Ambulatory, healthy white women (n = 605) from the São Paulo area volunteered for the study. They were recruited from the gynecologic outpatient clinic of our hospital where they were seen for routine checkup. They did not have any systemic diseases based on a clinical screen, nor were they taking any medication known to affect bone and mineral metabolism. These subjects were part of a larger prospective study that provided BMD reference data for white Brazilian women.40 Their biographic and anthropometric data is presented in Table 1. The ages ranged between 22 and 97 years, but most women were in the range of 40–70 years of age.
Morphometric X-ray absorptiometry
MXA was performed using an imaging densitometer (Expert XL; Lunar Corp., Madison, WI, U.S.A.). This instrument uses the dual-energy X-ray absorptiometry (DXA) method to obtain a lateral image of the spine (thoraco-lumbar segment, T4–L4). It has a fan-beam X-ray source, slit collimation, and a solid-state, linear-array detector.35, 36 The detector has submillimeter spatial resolution. The source and the detector are positioned at opposite ends of a rotatable C-arm. During the acquisition of the image, both source and detector are fixed on the lateral–lateral axis of the patient and moved parallel to the vertical axis of the spine. During the acquisition, the patients were positioned in the supine position, with the knees and hips flexioned in a 90° angle; the arms were flexed with both hands behind the head. Image acquisition required about 40 s with an absorbed radiation dose of ∼1.2 mGy.
The same operator analyzed all scans using the standard software supplied by the manufacturer. Six edge points were placed on the border of the vertebral body using the standard procedure. The point placement protocol used is described in details elsewhere.19, 41 The anterior (HA), middle (HM), and posterior (HP) heights of each vertebral body were measured using the analysis software, and average height (HAVG) was calculated. The wedge (HA/HP) and midwedge (HM/HP) ratios of these vertebral heights were then calculated at each vertebral level for each individual. Adjustments of the brightness and contrast were made in order to improve visualization of vertebras at different spine levels. This is important during analysis because soft tissue attenuation is different along the spine. The reported precision of vertebral heights in repeat scans in vivo is –1 mm (3–4%), while the precision for ratios is –0.05 mm (5%).41-44


This normalization approach reportedly equalizes vertebral height data from white subjects of widely divergent stature and had even been shown to adequately normalize results for Asian women. Given the large number of individuals involved in the present investigation, we could examine the adequacy of the normalization procedure for vertebral heights in our sample of Brazilian women. It is important to note that the ratios (HA/HP and HM/HP) are not normalized and that we did not perform an iterative trimming procedure used in other reports.21, 26
Bone densitometry
Vertebral (lumbar vertebrae L2–L4) and femoral neck, Ward's triangle, and trochanter BMD were measured by DXA using a DPX-L (Lunar Corp.), as described previously.45, 46 Most of the patients were scanned for MXA and DXA on the same day, but in a few cases, scans were done up to 30 days apart. Because of local limitations, BMD values were only obtained in 429 patients. However, the anthropometric data on these patients were not significantly different from the whole population of 605 patients (data not shown). We have previously shown that spine and femur BMD in Brazilian women is almost identical to values for women in the U.S.A. and Europe.40
BMD and vertebral deformities
We grouped the patients in terms of their vertebral height and ratios and then correlated the results with BMD. This was done in terms of absolute deviation from the reference values and also after normalization for size (Z scores).
Statistical analysis
All statistical tests used in the analysis of the data are appropriately indicated and were performed using the Prime Statistical Software.
RESULTS
Morphometric reference data
The heights (156 ± 6.6 cm) and body weight (64.9 ± 11.2 kg) were typical of Brazilian women; the average body mass index (BMI) was 26.7 (Table 1). The age changes of spine and femoral neck BMD were entirely normal compared with reference values. The Z score for spine BMD was –0.5 in women under 50 years, but the corresponding value for femoral neck BMD was 0.1. Only 20.6% of women over age 50 years had a T score for spine BMD lower than –2.5 SD; for the femoral neck, this percentage was even lower at 6.9%.
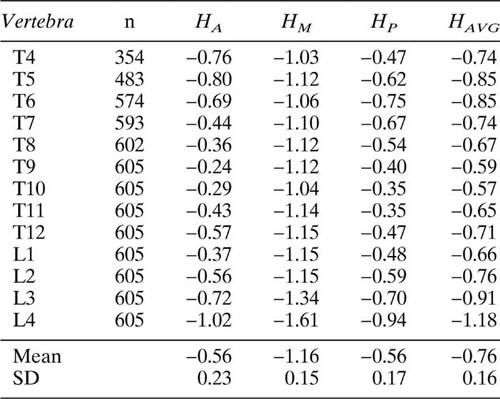
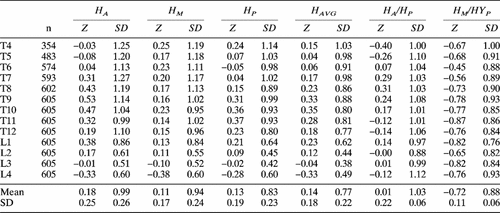
Table 2 displays anterior, middle, posterior, and average vertebral heights. Figures FIG. 1., FIG. 2. show the heights and ratios profiles according to the vertebral level. The HA and HP averaged 5% (−0.56 T score) lower than values expected from reference data, but HM was almost 10% lower (T = −1.2) (Table 3). The HAVG was about 2 mm (or 6%) lower than reference values (T = −0.76). The postnormalization Z score was close to zero for all heights and for HA/HP (Table 4). In contrast, the HM/HP averaged about 0.04 lower than the reference values, or about −0.72 SD. The pattern of heights and ratios along the spine was close to that expected, with the exception that L4 had lower heights and ratios than expected.

Anterior, middle, and posterior vertebral heights of Brazilian women.

Anterior-posterior and middle-posterior vertebral height ratios of Brazilian women.
We examined the SD of the Z scores for heights at individual vertebral levels. Theoretically the Z score should be zero and the SD of the Z score should be about 1 (for the normalized vertebra T4–L1) if the normalization procedure is adequate. We observed an average SD of 0.99, 0.94, and 0.83 for HA, HM, and HP, respectively (Tables 4 and 5).
Influence of age
The average vertebral height in women over 50 years was 0.2 mm less than in women 20–49 years. The correlation of HAVG with age was low (r = 0.15), but significant (p < 0.001). The regression coefficient was 0.02 mm/year. The lower HAVG reflected in part the slightly lower stature (2 cm) of the older women. The HAVG correlated fairly well (r = 0.58; p < 0.001) with stature. The regression coefficient was 0.10 mm for each centimeter of stature, so the 2 cm difference between younger and older women would correspond to a difference of 0.2 mm in HAVG. The T scores for heights were slightly lower in the older women (Table 5), but the Z scores were almost identical to those for younger women, showing that the Z score compensated for the group difference in stature.
Vertebral heights and BMD
The linear regression of HA/HP, and HM/HP for individual vertebral levels with spine BMD and with femoral neck BMD showed low correlations (−0.1) (data not shown). We then calculated the average Z score for the ratios for each individual (based on all observed vertebrae in each subject) and correlated these with BMD. The correlation coefficient between HA/HP and spine BMD was 0.05 (NS), while that for femur neck BMD was 0.09 (p = 0.04). The corresponding correlations for HM/HP were 0.21 and 0.25; while the correlations were low, both were highly significant (p < 0.001).
An alternative approach is to examine the association in grouped data between vertebral heights and BMD. The T score for HAVG was below −1 in 30% of subjects. The average BMD values in these subjects was 10% lower than BMD values in subjects with a T score for HAVG > 0. In other words, bigger subjects had higher BMD values. However, there was no clear association when the HAVG was expressed as a Z score (Table 6). There was only a 2–3% difference of BMD between the quartile with the lowest Z scores and those with the highest Z score for HAVG (Fig. 3A). The chi-squared tests showed no significant trend. In contrast, there was a strong association between femur BMD and Z scores for HM/HP. The chi-squared tests were significant (p < 0.05 and p < 0.01) for femoral neck and Ward's triangle, respectively, but not for trochanteric BMD. The quartile with the highest Z score for HM/HP had axial BMD levels 8–15% above the lowest quartile (Fig. 3C). There was only a slight tendency for HA/HP to increase with BMD (Fig. 3B); the chi-square tests for trend were not significant.

Axial BMD in quartiles of MXA variables relative to the lowest quartile: (A) average height, (B) anterior-posterior ratio, and (C) middle-posterior ratio.
DISCUSSION
Ascertainment of vertebral fracture is important, both clinically and epidemiologically, because it allows the assessment of bone fragility independent of BMD and the evaluation of treatment efficacy. Quantitative methods provide greater objectivity for assessment of vertebral fracture than the qualitative methods. The images obtained in the present investigation were of sufficient resolution to allow satisfactory identification of anatomical details, even though there was less spatial resolution than conventional radiography. In our hands, this limitation was evident in the upper thoracic vertebrae (approximately between T4 and T6), where the superposition of soft tissue, particularly the lung and the branchial tree, as well as ribs, hindered the visualization of the vertebral borders as well as the intervertebral spaces. As a result, only ∼58% of T4 and ∼80% of T5 were measurable; 95% of T6 vertebrae could be measured. These figures are comparable to a recent report where MXA was also used.47 It is important to note, however, that image quality is dependent on the BMI and bone density of the subjects. Therefore, identification of anatomical details is expected to be further impaired in obese and/or osteoporotic patients.
The analysis of the data indicated a decrease of only 0.2 mm in vertebral heights in older women, that was due entirely to their 2 cm smaller stature. The decrease was small because there was only a 14-year difference between the average age of the younger and older women. Rea et al.44 reported a larger decrease (0.5 mm) in vertebral heights of older women using MXA, but like us, they found no influence of age on vertebral ratios. Diacinti et al.48 found a large decrease in vertebral heights and ratios with age in Italian women using radiographic morphometry. Sone et al.49 reported a decrease in both HA/HP and HM/HP in older Japanese women using radiographic morphometry. Apparently the aging effects seen in radiographic morphometry may be less evident using MXA.
Vertebral heights in Brazilian women averaged 8% lower than the reference population consisting of American and European women, but this difference was adequately compensated for in the normalization procedure used in the analysis software. The Z score for normalized heights had a mean close to 0 and an SD close to 1, which conforms to theoretical expectations. Our normalization was based on the entire L2–L4 sequence, rather than on T4 as proposed by others.31 T4 is difficult to measure, even when it can be visualized, and hence is not useful.27 L4 can also be used to normalize height results. However, our experience shows that L4 is sometimes difficult to measure, and is often highly deviant, as noted by Blake et al.34 The L2–L4 sequence may be superior to L4 alone.
Our results for HA/HP were very close to those expected, but the actual ratio differs from those observed using radiographic morphometry and MXA with other devices. The reported HA/HP and HM/HP for Hologic (Waltham, MA, U.S.A.) MXA results on white European women (n = 1019) were about 0.02 and 0.07 higher than our values44; values for radiographic morphometry on HA/HP are slightly lower than ours, and HM/HP values are similar.9, 29 The SDs for heights and ratios were close to expected, and similar to those observed in other studies using both MXA and radiographic morphometry.
There was no significant association of vertebral heights with axial BMD. Larger individuals had slightly higher BMD values and larger vertebrae, but this association disappeared when the vertebral heights were normalized (see Table 6). We observed no trend of HA/HP with BMD in these healthy women (with normal BMD and without significant deformity). In contrast, there was a modest association between HM/HP and BMD on an individual basis (r = −0.2), and a significant trend on a group basis. The approximate 1 SD difference between the lowest and highest quartile for HM/HP was associated with an 8–15% (0.5–1.0 SD) difference of BMD. This association of low BMD and low HM/HP needs to be explored in greater detail in normal postmenopausal women. Several groups have shown that axial BMD correlates better with HM/HP than with HA/HP if abnormal cases are included in the postmenopausal sample.11, 49, 50
In conclusion, our results indicate that MXA assessment of vertebral deformity can be considered together with axial BMD in patient evaluation and may provide better prediction of future clinical fracture than either variable alone.51, 52
Acknowledgements
We are grateful to Lunar Corporation for the skilled help of Howard Barden and Richard Mazess in the analysis of data, and editing of the manuscript, and also for the assistance of Donald Settergren in the complex merging of several patient databases.


