A Discrimination Method and Experimental Study for Predicting the Failure Strength of Saturated Sandstone Based on RVSD
Abstract
The Ordos coalfield contains shallowly buried coal seams, with sandstones in the overlying strata. Mining activities induced extensive fissures in the overlying rock and on the surface; thus, groundwater and surface water migrated through these fissures, accumulated within the mines and working faces, and diminished the surrounding rock strength. To reveal the failure patterns of the overlying sandstones and to explore a reliable method for monitoring rock layers and providing early disaster warnings, sandstones from the No. 2-3 coal seam in the Naoerhao Coal Mine were studied. With electrical resistivity and acoustic emission data acquired during the loading processes, experiments were conducted on the sandstones from the coal seam roof in both dry and water-saturated states. A method for predicting the failure strength of the water-saturated sandstones using the response of the resistivity standard deviation (RVSD) was developed. The results indicated that (1) the mechanical properties of the sandstone samples decreased significantly after water saturation; (2) a very strong correlation was observed among the acoustic emission, electrical resistivity, and stress during the loading process of the water-saturated samples; (3) introducing the RVSD to determine the rock closure strength and its combination with the corresponding stress level relative to the peak stress was an effective way to estimate the peak strength of the rock samples; and (4) based on the change in the number of acoustic emission hits within a unit of time, the locations of the precursor points to failure for sandstone were determined. Our proposed method for determining the characteristic points during the loading process of rock samples conforms to the principles of electrical resistivity and acoustic emission testing and can be easily adopted. This study can provide a reference for early warning systems for the sandstone roof failure in shallowly buried coal seams.
1. Introduction
The coal fields in the Ordos region, which are characterized by a simple structure, a consistent seam occurrence, a low gas content, and shallow burial, can be developed with a simple development approach and are the main focus in China’s coal mining industry [1]. According to the precipitation data of Inner Mongolia provided by the National Meteorological Science Data Sharing Service Platform of China, the annual total precipitation in Ejin Horo Banner, Ordos, has increased from 332 mm in 2005 to 513 mm in 2022. The increase in precipitation has led to more surface water, resulting in a rise in groundwater levels, which affects the safe mining of shallowly buried coal seams. Current research on the mining of shallowly buried coal seams primarily focuses on the failure patterns of overlying strata, the development models of fracture zones, and the stability of mining faces [2]. Accurate calculations of the height to which water-conducting fracture zones develop have been made, and mechanical models for fracture propagation have been established, providing a rich theoretical foundation for strata control techniques in shallowly buried coal seams [3]. The Ordos region is extensively covered by Quaternary eolian sands, and the strata immediately overlying the coalfield are primarily sandstones with relatively poor rock mass stability. High-intensity coal mining activities trigger the movement of the overlying strata and generate fractures. These fractures connect groundwater and surface water, allowing for the long-term accumulation of fissure water in mines and working faces, which poses a continuous threat to the stability of the surrounding rock at the workface [4]. Numerous studies have clearly indicated that water affects the mechanical properties and deformation behavior of rocks, especially sedimentary rock layers [5–7]. Therefore, accurate identification of the loading stages of rock layers is beneficial for guiding practical engineering efforts and enhancing the accuracy of early disaster warnings.
To address the weakening effect of water on rocks, Zhou et al. conducted systematic explorations via physical experiments and theoretical analysis. They examined the mechanical properties and microstructure of rocks to deduce the softening characteristics of the rocks under different water saturation conditions, revealing dynamic changes in their microstructure [8, 9]. Xiong [10] et al. studied the strength and deformation characteristics of different rocks after water saturation through Brazilian splitting, uniaxial compression, and conventional triaxial compression tests, summarizing the softening coefficients for sandy mudstone and sandstone. Vásárhelyi, together with Ván, investigated the weakening effect of water on the tensile strength of rocks [11] and proposed a calculation method for the degree of strength weakening in water-bearing sandstone. In addition, some scholars have explored the impact of water immersion pressure on the interaction between water and coal rock, concluding that the fracture morphology of coal rock gradually changes as the immersion pressure increases [12]. The interaction between water and rock significantly affects the safety of coal mining and has become one of the key issues in the sustainable development and utilization of coal resources.
Currently, various methods have been proposed and researched to improve the monitoring and early warning of rock failure under loading, including acoustic emission (AE) and electrical resistivity [13, 14]. As AE monitoring has been applied to the study of rock damage processes, numerous scholars have conducted analytical research on parameters of AE signals such as the energy, ringing counts, rise time, and central frequency [15, 16]. Scholars have investigated the AE characteristics of rocks under splitting, uniaxial, biaxial, and triaxial loading conditions, observing a clear correspondence between AE signals and the state of rock fracture during the loading process and suggesting precursory relationships [17, 18]. Liu et al. suggested that AE signals are closely related to the load and deformation of rocks, with the AE ringing counts peaking at the peak stress and decreasing after rock fracture [19]. Geng et al. conducted uniaxial compression experiments on rocks in different water-saturated conditions and utilized AE technology for real-time monitoring of deformation and failure [20]. It has been found that AE signals have a significant advantage in studying rock loading and fracture processes. However, during the initial stage of loading before plastic deformation occurs in rocks, the response of AE signals is relatively weak, making it difficult to fully capture and characterize the initial loading stage.
Electrical resistivity, as an important physical parameter of rocks, reflects the rock conductivity. When rocks undergo crack closure and fracture due to external pressure, their conductivity is affected accordingly [21]. Research on the characteristics of rock’s electrical resistivity has gradually developed since Archie’s law was proposed in 1942 by American well-logging engineer Archie [22]. Subsequently, the application of resistivity testing gradually expanded to the study of rock deformation characteristics under loading. Gengye Chen investigated the relationship between rock strain and resistivity through uniaxial compression tests and proposed a state equation to describe the rock compression process [23]. Wu et al., based on the relationship between sandstone resistivity and porosity, established a relevant damage model for sandstone under uniaxial loading and unloading [24]. İbrahim Sertçelik et al. conducted research on the physical and electrical properties of various rocks and concrete and demonstrated a strong correlation between resistivity and compressive strength [25]. Moreover, due to the high sensitivity of resistivity to the development of fractures in water-bearing strata, Zhong et al. applied resistivity testing to auxiliary early warning systems in underground engineering to enhance mining safety levels [26]. Resistivity has been proven to be closely related to the loading state of rocks, yet most scholars still engage in only qualitative discussions based on direct resistivity measurement observation, without further statistical analysis and data organization.
As monitoring technologies advance, utilizing different detection methods to analyze the rock failure process from multiple perspectives can improve efficiency and allow for cross-validation. Gao et al. employed a combination of AE and electromagnetic radiation methods to collect data on the failure process of water-immersed rocks, investigated the load-bearing conditions of damaged rocks under water immersion and discussed early disaster warning implications [27]. Sandstone, a characteristic rock commonly encountered in the mining of shallow coal seams, is prone to wetting by fissure water when serving as the roof of a coal seam. Research on monitoring and early warning systems for sandstone aligns with the practical needs of safe and efficient coal mining. In addition, there is a wealth of theoretical research on both resistivity and AE, and the related parameters are relatively easy to measure. Therefore, the present study focuses on the sandstone roofs of the No. 2-3 coal seam at the Ordos Naoerhao Coal Mine as the research subject. Uniaxial compression tests were conducted to simultaneously collect resistivity and AE data, and the resulting stress–strain curves were compared to analyze the patterns of change in resistivity and AE during the loading process. A prediction method for the failure strength of water-saturated sandstone based on the resistivity standard deviation (RVSD) index is proposed, and the mechanisms controlling the variation in AE and RVSD are discussed for three types of sandstone. This research holds significant reference value for improving the accuracy and efficiency of monitoring of water-saturated sandstone roofs in coal mines for early disaster warning.
2. Experimental System and Sample Preparation
2.1. Specimen Preparation and Basic Properties
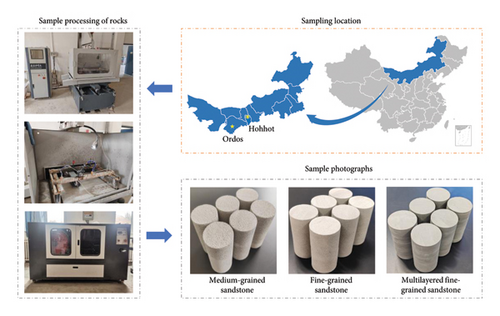
Rock samples were obtained from the medium-grained sandstone, fine-grained sandstone, and multilayered fine-grained sandstone of the roof strata in the No. 2-3 coal seam at the Naoerhao Coal Mine in Ordos: cores were extracted by drilling in a laboratory. In accordance with the standards set by the International Society for Rock Mechanics (ISRM), the samples were processed into standard rock samples measuring Φ50 × 100 mm.
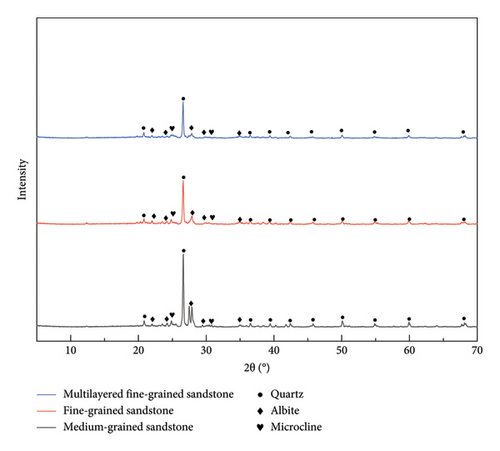
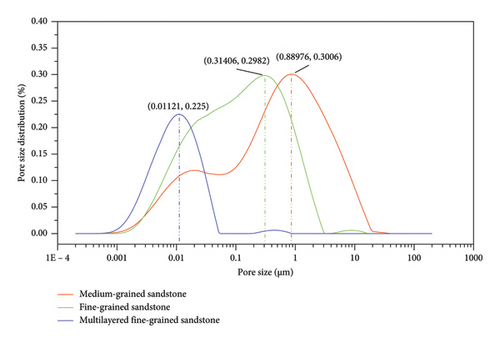
The mineral compositions of the three types of sandstone were determined using an X-ray diffractometer, as shown in Figure 1, with the primary minerals identified as quartz, albite, and microcline. All the samples were placed in an oven and dried at a constant temperature of 105°C for 24 h before being removed and allowed to cool. Subsequently, dry density and ultrasonic longitudinal wave velocity measurements were made. The rock samples were divided into three groups according to their type, and based on the principle of maintaining similar dry densities and longitudinal wave velocities, six samples were selected from each group. As shown in Figure 2, a total of 18 rock samples were chosen. For each group, three rock samples were placed in a vacuum saturation tank to saturate them with water. The samples were weighed every 24 h until the difference in mass between consecutive measurements was less than 0.01 g. Table 1 presents the grouping and basic physical parameters of the rocks used in this experiment. ma denotes the mass after drying, mb denotes the mass after water saturation, ρa represents the density after drying, ρb represents the density after water saturation, and vL represents the longitudinal wave velocity of the intact samples. The rock disintegration indices of the three types of sandstone were determined using a rock disintegration tester, as shown in Table 2. The pore size distributions of the three sandstone types were also determined using nuclear magnetic resonance (NMR), as shown in Figure 3. According to the pore size classification method proposed by Yao et al. [28], the medium-grained sandstone primarily consists of large and medium-sized pores with fewer small pores, the fine-grained sandstone is dominated by small and medium-sized pores, and the multilayered fine-grained sandstone mainly contains small pores.
| Rock type | Rock sample ID | ma/g | mb/g | ρa/g·cm−3 | ρb/g·cm−3 | vL/m·s−1 |
|---|---|---|---|---|---|---|
| Medium-grained sandstone (A) | A1 | 387.30 | — | 1.97 | — | 1474.39 |
| A2 | 389.92 | — | 1.99 | — | 1462.86 | |
| A3 | 388.82 | — | 1.98 | — | 1443.99 | |
| AW1 | 382.93 | 424.77 | 1.95 | 2.16 | 1450.23 | |
| AW2 | 382.42 | 424.75 | 1.95 | 2.16 | 1489.76 | |
| AW3 | 383.53 | 425.35 | 1.95 | 2.17 | 1455.65 | |
| Fine-grained sandstone (B) | B1 | 397.13 | — | 2.02 | — | 2644.90 |
| B2 | 397.14 | — | 2.02 | — | 2592.51 | |
| B3 | 398.05 | — | 2.03 | — | 2599.35 | |
| BW1 | 396.83 | 436.76 | 2.02 | 2.22 | 2635.21 | |
| BW2 | 397.41 | 438.45 | 2.02 | 2.23 | 2602.97 | |
| BW3 | 398.17 | 439.16 | 2.03 | 2.24 | 2622.87 | |
| Multilayered fine-grained sandstone (C) | C1 | 450.16 | — | 2.29 | — | 2309.18 |
| C2 | 451.81 | — | 2.30 | — | 2311.76 | |
| C3 | 451.06 | — | 2.30 | — | 2310.75 | |
| CW1 | 453.68 | 477.64 | 2.31 | 2.43 | 2356.56 | |
| CW2 | 454.14 | 478.77 | 2.31 | 2.44 | 2297.23 | |
| CW3 | 453.13 | 477.06 | 2.31 | 2.43 | 2285.63 | |
| Rock type | Total mass of the cylinder and specimen (g) | Cylinder mass (mm) (g) | First disintegration index Id1 (%) | Second disintegration index Id2 (%) | ||
|---|---|---|---|---|---|---|
| Initial mass (m0) | Mass after the first cycle (m1) | Mass after the second cycle (m2) | ||||
| Medium-grained sandstone | 2504.03 | 2476.12 | 2448.94 | 1968.36 | 94.79 | 89.72 |
| Fine-grained sandstone | 2490.50 | 2481.55 | 2470.99 | 1968.36 | 98.29 | 96.26 |
| Multilayered fine-grained sandstone | 2502.06 | 2497.82 | 2494.05 | 1968.36 | 99.21 | 98.50 |
2.2. Experimental System
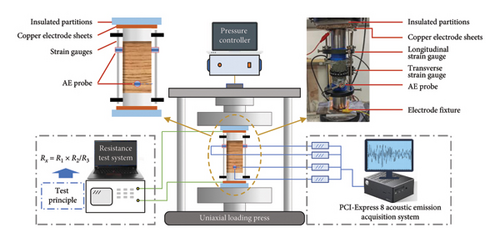
The experimental testing system is illustrated in Figure 4. The system is composed of three main parts: a rock loading system, an AE signal acquisition system, and a resistivity testing system. The rock loading system was a Changchun Xinte YAS-600 microcomputer–controlled electrohydraulic servo high-stiffness uniaxial compression testing machine, with a maximum load capacity of 600 kN. With this machine, the load can be controlled by displacement and stress, and strain data during the experiment were collected using the MEAS 100 MHR-4160 displacement sensor. The AE signal acquisition system used was a PCI-Express 8 AE collection system developed by Physical Acoustics Corporation, which primarily consists of AE sensors, preamplifiers, and analysis software. The resistivity testing system adopted was a TH2830 digital bridge system, which includes the TH26048A four-terminal test fixture, digital bridge mainframe, and YGJ-LCR 2.0 control software.
2.3. Experimental Procedure
- 1.
Instrument setup and connection procedure: Initially, transverse and longitudinal strain gauges are mounted on the rock sample. Four AE sensors are positioned on the sample on the basis of the principle of alternating on the same plane but staggering on different planes. These sensors are divided into two groups and placed 15 mm from the top and bottom end faces of the rock sample. To ensure optimal contact between the AE sensors and the sample, a suitable amount of coupling agent is applied between the sensors and the rock sample, reducing the acoustic impedance between the probes and the rock sample to ensure complete acoustic signal collection. The sensors are subsequently bonded securely to the rock sample with hot melt adhesive and electrical tape to prevent detachment during the experiment. The rock sample was positioned in the middle of the upper and lower steel loading columns. An appropriate amount of high-efficiency conductive agent was applied to the contact surfaces between the rock sample and the steel loading columns to increase the accuracy of the resistance measurements. Copper electrode sheets were placed on the sides of the steel loading columns that were further away from the rock sample. The two electrode jigs of the TH2830 digital bridge are clamped onto the copper electrode plates at both ends of the sample, with a conductive agent applied to the contact surfaces of the electrode plates and the steel loading columns. Finally, the strain gauges, AE sensors, and electrode jigs are connected to the signal acquisition system.
-
(a) The rock sample was installed within both the transverse and longitudinal strain gauges. (b) Four AE sensors were selected and arranged based on the principle of “alternating on the same plane and staggering on different planes.” These four sensors were divided into two groups and placed 15 mm from the top and bottom end faces of the rock sample. To ensure good contact between the AE sensors and the sample, an appropriate amount of specialized coupling agent was applied between the sample and the sensors to reduce the acoustic impedance difference between the probes and the rock sample, thereby ensuring the completeness of the acoustic signal collection. The sensors were then tightly secured to the rock sample with hot melt adhesive and electrical tape to prevent detachment during the experiment. (c) The rock sample was positioned in the middle of the upper and lower steel loading columns. An appropriate amount of high-efficiency conductive agent was applied to the contact surfaces between the rock sample and the steel loading columns to enhance the accuracy of resistance measurements. Copper electrode sheets were placed on the sides of the steel loading columns that were further away from the rock sample. The two electrode clamps of the TH2830 digital bridge were respectively attached to the copper electrode sheets at both ends of the sample, with an appropriate amount of conductive agent applied to the contact surfaces between the electrode sheets and the steel loading columns. Finally, the strain gauges, AE sensors, and electrode clamps were connected to the signal acquisition system.
- 2.
Debugging the equipment and setting parameters: Prior to initiating the test, the rock loading system, AE signal acquisition system, and electrical resistivity testing system are activated. Calibration is performed to ensure that the collected stress–strain data, AE signals, and electrical resistivity values are temporally synchronized. Using the YAS-600 control software, the press is adjusted to ensure intimate contact between the loading plate and the rock sample. The loading rate for all the rock samples is set to 0.003 mm/s. The main amplifier of the AE system is set to 40 dB, with the AE signal threshold set to 40 dB. In accordance with the requirements of the standard SYT 5385-2007 “Laboratory measurement and calculation methods for rock resistivity parameters,” resistivity information is continuously acquired using the TH2830 digital bridge control software.
- 3.
Initiate the experiment: The test systems for preheating are activated, and a no-load test is conducted to measure the noise from the press and testing environment. At the onset of loading, both the AE signal acquisition system and the electrical resistivity testing system commence data collection simultaneously, only stopping when the stress applied to the sample has decreased below 50% of the peak stress.
3. Experimental Results and Analysis
3.1. Mechanical Properties of the Rock Samples
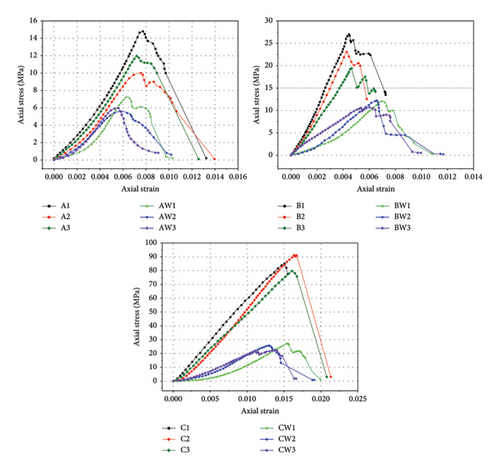
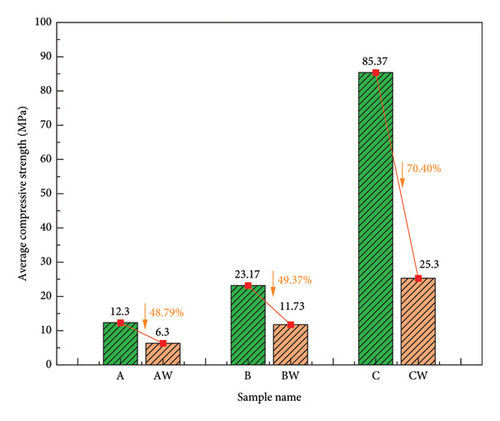
The uniaxial compressive stress–strain curves of the medium-grained sandstone, fine-grained sandstone, and multilayered fine-grained sandstone are shown in Figure 5. The peak strength of these rocks in the dry state is greater than that in the water-saturated state, indicating that all three rock types exhibit significant weakening after water erosion. The change in compressive strength elucidates the impact of water saturation on the mechanical properties of rocks. As shown in Table 3, the average peak strengths of the dry medium-grained sandstone, fine-grained sandstone, and multilayered fine-grained sandstone are 12.30, 23.17, and 85.37 MPa, respectively. After water saturation, the peak strengths of these three types of sandstone decrease to 6.30, 11.73, and 25.30 MPa, respectively. The degrees of peak strength weakening are illustrated in Figure 6, with multilayered fine-grained sandstone experiencing the most significant reduction in peak strength, decreasing by approximately 70.36%, followed by a 48.79% decrease in medium-grained sandstone and a 49.37% decrease in fine-grained sandstone.
| Rock sample | Compressive strength (MPa) | Elastic modulus (MPa) |
|---|---|---|
| A1 | 15.00 | 2521 |
| A2 | 10.00 | 1851 |
| A3 | 11.90 | 1712 |
| AW1 | 7.30 | 1979 |
| AW2 | 5.60 | 1379 |
| AW3 | 6.00 | 1518 |
| B1 | 27.00 | 6591 |
| B2 | 19.50 | 4168 |
| B3 | 23.00 | 4343 |
| BW1 | 12.20 | 2515 |
| BW2 | 12.20 | 2399 |
| BW3 | 10.80 | 1890 |
| C1 | 85.20 | 5856 |
| C2 | 91.20 | 6046 |
| C3 | 79.70 | 5131 |
| CW1 | 27.30 | 2880 |
| CW2 | 26.00 | 2768 |
| CW3 | 22.60 | 2406 |
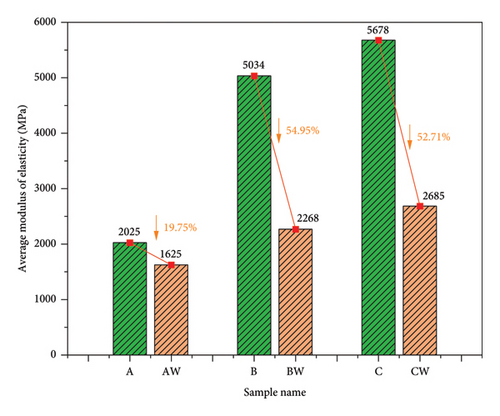
The calculated change in elastic modulus due to water saturation is depicted in Figure 7. In the dry state, the average elastic moduli of the samples increase in the order of medium-grained sandstone, fine-grained sandstone, and multilayered sandstone. Water saturation treatment leads to a reduction in the intergranular bonding strength among rock particles, resulting in a reduction in the elastic modulus for all three rock types. These findings indicate that water ingress softens the rock samples, reducing their capacity to resist elastic deformation [29]. The fine-grained sandstone exhibited the greatest reduction in elastic modulus, with a decrease of approximately 54.95%; the elastic modulus of the medium-grained sandstone decreased by 19.75%; and the elastic modulus of the multilayered fine-grained sandstone decreased by 52.71%.
3.2. Analysis of the AE Signal Characteristics of Water-Saturated Sandstone Under Loading
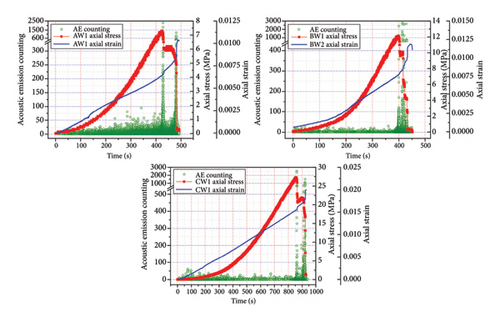
The extent of rock deformation and failure can be interpreted from the quantity, magnitude, and frequency of the rock’s AE signal responses [30]. Among the AE parameters, the ringing count, which is the number of AE pulses exceeding a certain threshold, can reflect the degree of internal cracking within a material [31]. AEwin software was used to statistically analyze the AE waveforms collected during the testing process. The oscillation count of each waveform crossing the preset threshold was extracted as the AE ringing count, with higher values indicating a greater number of cracks generated within the specimen. The AE response characteristics were similar across the three parallel samples of each rock group; therefore, one sample from each group was selected for further analysis of the test results. Figures 8 and 9 illustrate the variations in the AE counts for the three types of rocks under both dry and water-saturated conditions, respectively.
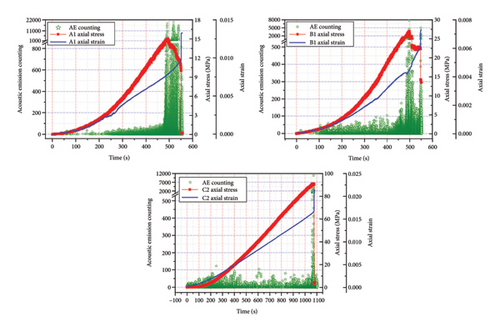
As shown in Figure 8, under dry conditions, the AE ringing counts for all three types of rock generally showed a gradual increase before rock failure, with each type of rock exhibiting unique characteristics in their AE signal profiles based on their inherent properties. Specifically, the dry medium-grained sandstone (sample A1) exhibited a low AE ringing count before 250 s. At 250 s, fluctuations in axial strain occurred, which coincided with a gradual increase in the AE ringing count. The AE ringing count increased to 22,000 as the stress peaked, indicating extensive damage within the rock sample and a subsequent reduction in the load-bearing capacity. Throughout the postpeak stage, the AE ringing count continued to increase until the rock sample completely failed. The pattern of AE signal changes for the dry fine-grained sandstone (Sample B1) was similar to that of the dry medium-grained sandstone. Before 350 s, the AE ringing count remained below 100. At 350 s, coinciding with the fluctuations in axial strain, there was an increase in the AE ringing count. A concentrated increase in the AE ringing count occurred just before the rock sample reached the peak stress. As the stress peaked, the rate of axial strain increased rapidly, and the AE ringing count reached a peak of approximately 8000. In the postpeak stage, the AE ringing count continued to increase until the rock sample completely failed. The dry multilayered fine-grained sandstone (Sample C2) exhibited a relatively dense AE ringing count distribution during the initial compression stage below 20 MPa. Subsequently, the increase in the AE ringing count became more gradual until a jump in the AE ringing count occurred within 100 s before the rock sample reached the peak stress. When the peak stress was reached, there was a steep increase in axial strain, and the AE ringing count reached 12,000. At this point, the rock sample instantaneously lost its load-bearing capacity and completely failed.
Figure 9 indicates that under water-saturated conditions, the overall AE ringing counts for the three types of rock samples decreased. However, the characteristics of the AE signals from the water-saturated rock samples remained similar to those of the dry rock samples. Specifically, the axial strain of the water-saturated medium-grained sandstone (Sample AW1) fluctuated at 130 s, corresponding to a higher AE ringing count. Subsequently, the AE ringing count gradually increased, with the AE ringing count increasing as the peak stress increased. At the peak stress, the axial strain began to accelerate, and the AE ringing count abruptly shifted to a maximum value of approximately 2300. The AE ringing count was densely distributed until 480 s, when another surge occurred at the point of complete rock sample failure. The water-saturated fine-grained sandstone (Sample BW1) exhibited a consistent gradual increase in the AE ringing count throughout the stress increase process, not just before the rock sample reached its peak stress, reaching a maximum value of approximately 3000 at the peak stress. As the rock sample’s load-bearing capacity decreased in the postpeak stage, the AE ringing count also decreased. The water-saturated multilayered fine-grained sandstone (Sample CW1) exhibited a dense distribution of AE ringing count for approximately 370 s during the initial compression stage below 5 MPa. Then, the response of the AE ringing count became more gradual. Upon reaching the peak stress, there was a sudden change in axial strain, accompanied by a sharp increase in the AE ringing count. In the postpeak stage, both the axial strain and AE ringing count rapidly increased until the complete failure of the rock mass.
The following conclusions can be drawn: The change patterns of the AE of the dry medium-grained sandstone and dry fine-grained sandstone samples under loading are similar, with the AE ringing count gradually increasing and then suddenly changing at the peak stress. This is because the smaller grains that make up the medium- and fine-grained sandstones have intergrain distances that are larger than the sizes of the grains themselves, which leads to a significant amount of AE signals generated under loading due to the compaction of friction between the grains. The multilayered fine-grained sandstone has finer grains, resulting in fewer frictional effects between particles. However, due to the numerous laminations, a compacting effect on the layer boundaries occurs during the initial loading phase, leading to a concentration of AE signals. Moreover, since the multilayered fine-grained sandstone sample is dense, with strong interparticle bonding, a significant amount of energy is stored internally during loading. This results in pronounced brittle failure when the rock fractures, which is also reflected in the steep drop-off of the corresponding stress curve. The vacuum saturation treatment of these rocks leads to a reduction in the load-bearing capacity due to the softening effect of pore water on the rock. In addition, the filling and lubricating effects of water in the rock crevices result in a significant decrease in AE ringing count compared to when the rock samples are in a dry state [32]. The experimental data from the three types of rocks indicate that before reaching the point of failure, there is a relatively dense distribution of AE signals over a certain threshold, suggesting that microvibrations within the rock mass are quite active during this time and result in an increased number of AE signals.
3.3. Analysis of the Variation Characteristics of the Electrical Resistivity in Water-Saturated Sandstone Under Loading
During the compression and fracturing process, rock samples experience changes in electrical resistivity due to the dilation and closure of internal cracks and the compaction and friction of the particles [33]. Consequently, the electrical resistivity of rocks varies with the extent of compression. In the following experiments, electrical resistivity response data were collected during the loading process of the rock samples. Figures 10 and 11 illustrate the changes in electrical resistivity for the dry rock samples and water-saturated rock samples under compression, respectively.
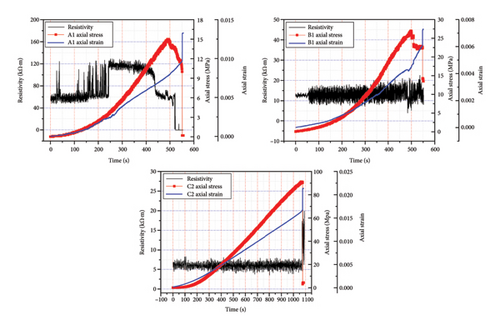
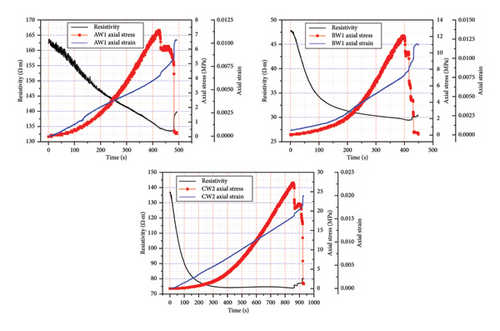
The initial values of electrical resistivity for the six sets of rock samples are shown in Table 4. Rocks in a dry state have higher electrical resistivity. To represent the data more visually, the rate of change in electrical resistivity was used to denote the electrical state of the rocks under dry conditions. Figure 10 reveals that the test data for the electrical resistivity of rocks in a dry state exhibit significant fluctuations. This is attributed to the conductivity of dry rocks, which primarily depends on the connectivity of internal mineral grains. At this stage, the lack of stable conductive pathways within the rock is influenced by the characteristics of the rock pores and the intrinsic properties of the mineral grains [34]. Specifically, the electrical resistivity of the dry medium-grained sandstone (Sample A1) initially stabilized and then fluctuated as the change in the rock structure transitioned from pore compaction to frictional grain interaction. At 250 s, where axial strain fluctuations occurred, there was a concomitant surge in resistivity, indicating a localized redistribution of internal grain positions influenced by the load, which could be considered a characteristic of the rock entering the plastic phase. Near the peak stress, the drastic changes in resistivity correspond to the fracturing process of the rock mass. The electrical resistivity of the dry fine-grained sandstone (Sample B1) initially stabilized and then fluctuated, continuing until the point of rock failure, when the resistivity exhibited unstable fluctuations. The dry multilayered fine-grained sandstone (Sample C2), with its densely packed particles, exhibited minimal changes in electrical resistivity, as the particle distribution remained largely unaltered during loading. Consequently, the characteristic change in resistivity was only slow until the rock reached failure, at which point a significant shift in resistivity occurred. The following conclusions were drawn: The electrical resistivity of the three types of sandstone measured in a dry state all exhibited significant fluctuations. However, upon failure, both the medium-grained sandstone and fine-grained sandstone displayed distinct resistivity characteristics that were different from those of the previous stages, whereas the multilayered fine-grained sandstone experienced an abrupt change in resistivity.
| Rock sample | Resistivity (Ω·m) |
|---|---|
| A1 | 54,838 |
| B1 | 12,384 |
| C1 | 6734 |
| AW1 | 169 |
| BW1 | 47 |
| CW1 | 136 |
Figure 11 reveals that the electrical resistivity of rocks measured after undergoing water saturation treatment exhibited a significantly enhanced stability. This was attributed to the combined effect of water in the rock fractures and soluble salts within the rock, which collectively improved the sample’s conductivity [35]. Specifically, the electrical resistivity of the water-saturated medium-grained sandstone (Sample AW1) gradually decreased with increasing applied pressure. Concurrently, as the pressure continued to rise, the resistivity curve became smoother, indicating that under pressure, the internal cracks within the medium-grained sandstone progressively dilated and participated in moisture exchange, leading to the formation of a uniform conductive network throughout the rock sample. Due to the higher porosity of the medium-grained sandstone, its resistivity exhibited a linear decreasing trend. When the stress reached its peak, the rate of decrease in resistivity began to slow, and ultimately, there was a sudden increase in resistivity when the rock completely failed. The electrical resistivity of the water-saturated fine-grained sandstone (Sample BW1) progressively decreased with increasing applied pressure, and the rate of resistivity reduction gradually decreased as the pressure continued to increase. Moreover, upon failure, the resistivity of the rock exhibited a pronounced fluctuation. The water-saturated multilayered fine-grained sandstone (Sample CW1) exhibited the fastest rate of decrease in electrical resistivity. As the pressure continued to increase, the rate of resistivity reduction gradually stabilized and maintained this trend until rock failure occurred. The following conclusions were drawn. For medium-grained sandstone, fine-grained sandstone, and multilayered sandstone in the water-saturated state, the electrical resistivity decreases with increasing axial pressure. The greater the density of the sandstone is, the faster the rate of decrease in resistivity. Under the action of pressure, the change in resistivity ultimately stabilizes. However, after rock failure, there is a sharp increase in resistivity.
4. Predicting the Failure Strength of Water-Saturated Sandstone Based on the RVSD and AE Ringing Count
4.1. Determination of the Closure Strength of Water-Saturated Sandstone Based on RVSD
- 1.
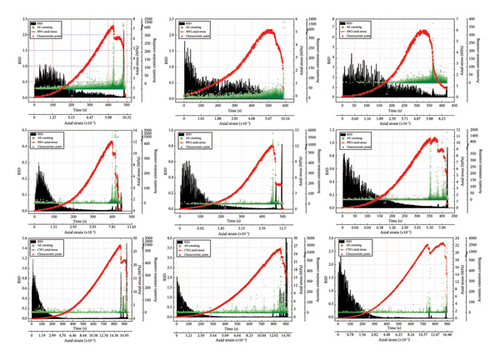
For the water-saturated medium-grained sandstones (AW1, AW2, and AW3), the RVSD values show a pronounced response in the early stages of compression and gradually stabilize later on. Taking the AW1 sample as an example, the RVSD value initially increases, indicating significant fluctuations in the resistivity of the rock sample during this stage. The RVSD decreases at 24.66% of the peak stress, which is 1.80 MPa, and then increases steadily until the failure of the rock sample. Moreover, starting at approximately 1.80 MPa, the AE ringing count gradually increases, suggesting that this point marks the end of the compaction stage of AW1. AW2 and AW3 show similar patterns; the RVSD value for the AW2 sample stops decreasing after 1.30 MPa and subsequently remains unchanged below 0.5. For the AW3 sample, the rapid decrease in the RVSD value ends at 1.50 MPa and is followed by a dense AE ringing count distribution, indicating the end of the compaction stage.
- 2.
The overall pattern of RVSD changes for the water-saturated fine-grained sandstones (BW1, BW2, and BW3) is similar to that for the saturated medium-grained sandstones. After the reduction in RVSD, there is a gradual increase in the AE ringing count. The difference lies in the stress level at which the RVSD value stabilizes, which is lower for the water-saturated fine-grained sandstones than for the saturated medium-grained sandstones. Taking the BW1 sample as an example, the RVSD value stabilizes after decreasing to 2.20 MPa, which is 18.03% of the peak stress, and the subsequent variation in RVSD values is more gradual than that of the saturated medium-grained sandstones.
- 3.
The RVSD values of the water-saturated multilayered fine-grained sandstones (CW1, CW2, and CW3) also exhibit the same pattern. For instance, after the decrease in the RVSD of the CW1 sample, it remains at a peak stress of 9.16%. Subsequently, the RVSD is very stable, indicating a uniform decrease in the resistivity of the rock sample after the compaction stage until a sudden change occurs in the RVSD value following the failure of the rock sample.
In summary, the RVSD values for all three types of sandstone samples show a distinct response phase in the early stages of compression. This can be considered a characteristic of the resistivity response during the compaction stage of the rock samples (marked with a purple pentagram in Figure 12). The point at which the RVSD tends to stabilize indicates the end of the compaction stage. As the stress level gradually increases, the RVSD decreases, and there is a concomitant increase in the AE ringing count response. Before the rock sample fractures, the RVSD reaches its minimum value, followed by a sudden change in the RVSD at the moment of sample failure. Table 5 summarizes the closure strengths of the three types of rocks and their corresponding stress levels. Statistical analysis revealed average closure strengths corresponding to stress levels relative to the peak stresses of 24.29% for the water-saturated medium-grained sandstone, 18.84% for the water-saturated fine-grained sandstone, and 9.65% for the water-saturated multilayered fine-grained sandstone.
| Rock sample | Closure strength σcc (MPa) | Peak stress σf (MPa) | Corresponding stress level relative to the peak stress y (%) | (%) | Calculated peak strength σF (MPa) |
|---|---|---|---|---|---|
| AW1 | 1.80 | 7.30 | 24.66 | 24.29 | 7.41 |
| AW2 | 1.30 | 5.60 | 23.21 | 5.35 | |
| AW3 | 1.50 | 6.00 | 25.00 | 6.18 | |
| BW1 | 2.20 | 12.20 | 18.03 | 18.84 | 11.68 |
| BW2 | 2.10 | 12.20 | 17.21 | 11.15 | |
| BW3 | 2.30 | 10.80 | 21.29 | 12.21 | |
| CW1 | 2.50 | 27.30 | 9.16 | 9.65 | 25.91 |
| CW2 | 2.50 | 26.00 | 9.62 | 25.91 | |
| CW3 | 2.30 | 22.60 | 10.18 | 22.59 | |
Therefore, based on the response characteristics of the RVSD values, a method for predicting the failure strength of water-saturated sandstones is proposed here. This method is based on the following formula: , where σF represents the calculated peak strength, σcc denotes the closure strength of the sample, and is the average closure strength stress level recorded during the experiment for each group of sandstone samples.
Specifically, the calculation steps for are as follows: First, the actual peak strength (σf) of each group of sandstone samples is determined on the basis of the mechanical test results. Next, the closure strength (σcc) of each sample within the group was identified by analyzing the variation trend of the RVSD values. Then, the closure strength stress level y for each sample is calculated as the ratio of σcc to σf. Finally, all the y values are summed, and their average is computed to obtain .
According to this statistical principle, the larger the number of samples in each group is, the more accurately the calculated value reflects the characteristics of that group of sandstone. The calculated strengths are shown with the actual peak strengths obtained from the experiments in Figure 13.
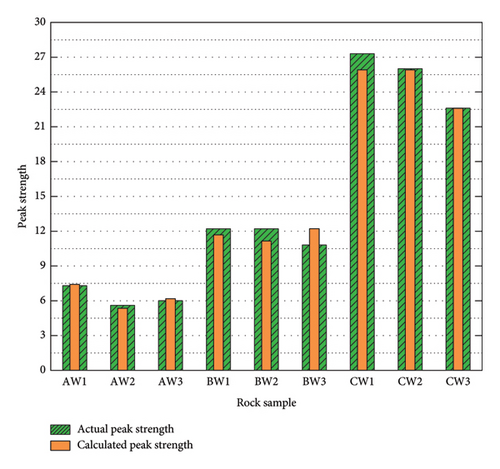
Figure 13 indicates that the calculated peak strengths derived from the closure strength σcc, determined by the RVSD values, generally differ slightly from the actual peak strengths of the rock samples. The closest correlation is observed for the water-saturated medium-grained sandstone, with an average error of only 2.93%. A comparison of the calculated peak strengths with the actual peak strengths for the three types of sandstones reveals that using RVSD and the corresponding stress level relative to the peak stress to determine the closure strength σcc provides a relatively accurate estimation of the peak strength of rock samples and warning of failure for saturated sandstone using RVSD value characteristic points.
4.2. Determining the Precursor Point of Failure for Water-Saturated Sandstones Based on AE Hits Per Unit of Time
The essence of rock damage is the gradual reduction in interparticle bonding forces under stress, along with the continuous initiation, expansion, and penetration of internal cracks [38]. AE signals are a response to the internal damage of rocks under load and are closely related to the rock fracture process. In the process of rock compression, as the stress increases, the AE signals gradually become more frequent and intense. This phenomenon reflects the continuous formation and propagation of internal cracks within the rock. Particularly near the peak stress, rapid coalescence and expansion of these internal cracks occur, leading to a significant increase in the number of AE signals. This finding indicates that AE signals are sensitive indicators of the rock’s impending attainment of peak stress [39]. Given that AE ringing counts exhibit dense responses prior to rock sample failure, the number of AE rings occurring per unit of time (AE hits per unit of time) was statistically analyzed. A time unit of 0.5 s was used; the number of AE ringing counts within each 0.5 s interval was calculated. The statistical results were then used to construct a correlation between AE hits per unit of time and time, as shown in Figure 14.
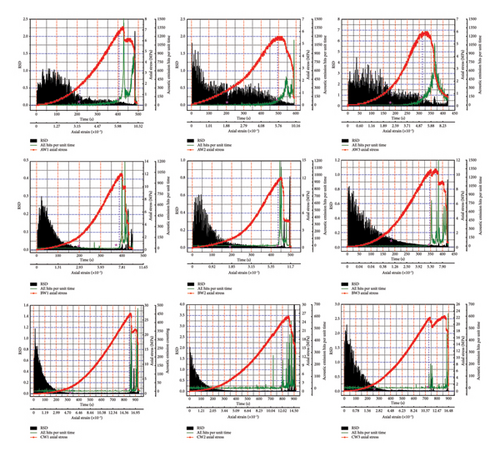
In Figure 14, the green lines represent the variations in AE hits per unit of time, revealing a strong similarity of the AE hit rate curves among the three types of rock samples. Before the peak stress, all three types of samples exhibit a curve of AE hits per unit of time that increases with time, where the point of maximum curvature is considered the precursor point of the rock sample’s failure, marked by a purple star in the Figure 14. In addition, as the density of the sandstone increases, the curvature of the curve becomes more pronounced, bringing the precursor point closer to the peak stress point of the rock sample.
4.3. Analysis of the Variation Mechanisms of RVSD and AE Signals
The three types of rocks (medium-grained sandstone, fine-grained sandstone, and multilayered fine-grained sandstones) sourced from the Naoerhao Coal Mine in Ordos exhibit similar patterns of change in AE ringing count and resistivity after undergoing water saturation treatment. The intensity of the AE ringing count in the water-saturated rock samples decreases, while the measured resistivity variations become smoother. During loading, the AE signals from the water-saturated samples and the RVSD values derived from the resistivity statistics show varying degrees of activity at different deformation stages, peaking in response to rock failure and instability. Although both signals originate from the fracturing of the rock sample, their generation mechanisms differ. AE is a phenomenon of elastic wave release during material fracture, while changes in resistivity are related to the migration of pore water within the rock microfissures. However, both are closely associated with the expansion of microfissures. Water saturation weakens the mechanical properties of rocks, leading to a decrease in parameters such as the elastic modulus and compressive strength, making the prediction of rock failure under water-rich underground conditions particularly critical to understand.
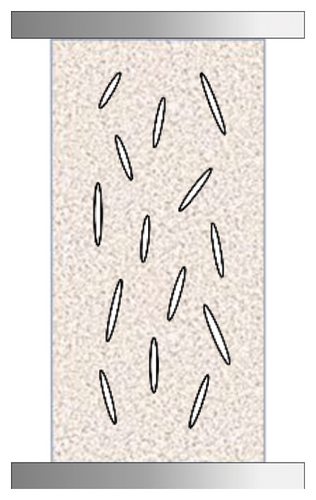
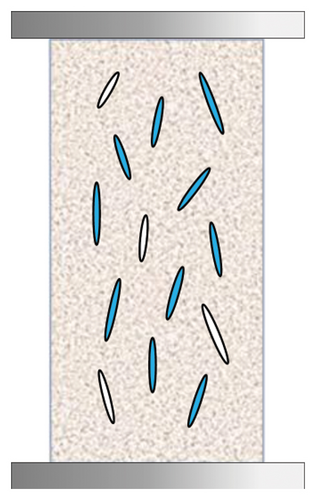
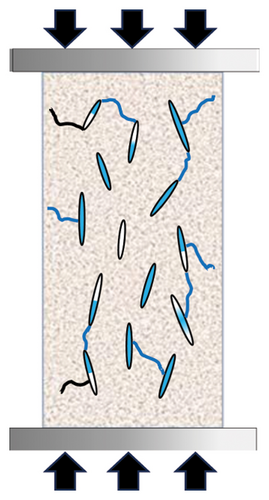
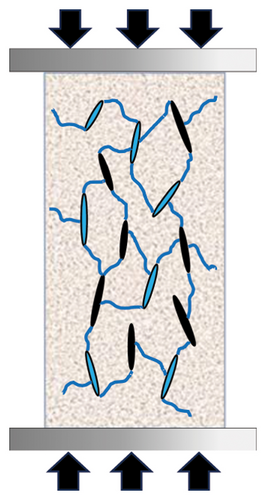
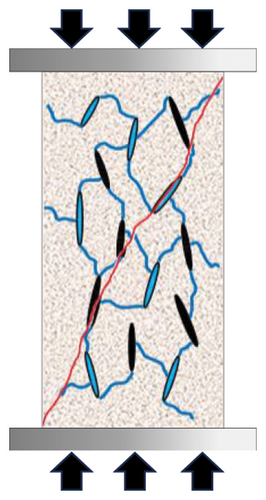
Figure 15 reveals the microscopic change mechanism of sandstone during the stress application process. In the dry state, the internal pores of the sandstone are uniformly distributed (Figure 15(a)). After the pressurized water saturation treatment, the pores begin to fill with water, and the sample gradually reaches a saturated state. At this point, all open pores are filled with water, and there are a few isolated or closed pores (Figure 15(b)). The measured resistivity at this state is the initial resistivity of the water-saturated rock sample. Once pressure is applied, the sample enters the compaction stage. The pore pressure develops as the stress increases, leading to the initiation of microcracks around some pores. These microcracks enable the exchange of water molecules between more pores. Therefore, the RVSD shows a strong response during this stage due to frequent water exchange (Figure 15(c)). Notably, since fewer microcracks form at this stage, the AE ringing count response is relatively weak. As the applied pressure increases, the microcracks in the sample continue to develop, and the pores gradually close completely; consequently, the water within the sample is entirely in the microcracks. Thus, the RVSD of the rock sample stabilizes as the exchange of water between pores ceases. Simultaneously, the AE ringing count progressively increases due to the frequent generation of microcracks within the rock sample (Figure 15(d)). Once most of the preexisting pores in the sample are connected by cracks, and with a further increase in stress, a network of cracks forms, leading to the creation and expansion of macrocracks. Once the macrocracks penetrate through the rock sample, complete failure of the sample is observed (Figure 15(e)), which is accompanied by fluctuations in the RVSD value and a sharp response in the AE ringing count.
The experimental results indicate that for three different types of sandstone, the characteristics of various loading stages can be extracted by analyzing the response of the RVSD values and AE hits per unit of time during the rock sample loading process. Based on Section 4.1, the closure strength σcc during the rock compaction stage can be obtained in real time by monitoring the response of the RVSD index and AE ringing count. This enables the estimation of the peak strength of the rock sample by combining the derived closure strength and corresponding stress level relative to the peak stress. In addition, there is a strong correlation between the RVSD, AE ringing count, and stress–strain curve at the moment of sample fracture. According to Section 4.2, analysis of the curve of the AE hits per unit of time during the loading process of the rock sample allows for the extraction of the precursor point to rock failure. This approach offers the possibility of predicting rock failure using these two testing methods. The experiments on three types of saturated sandstones demonstrated that when the sandstone samples are continuously loaded, the internal cracks gradually increase in size and interconnect with each other. Moreover, the opening of internal cracks in rock samples causes an increase in volume, the commencement of pore water circulation, and a decrease in the overall bearing capacity; that is, strain-softening characteristics are exhibited. Considering the strain softening and dilation effects of rocks, the introduction of relevant elastoplastic criteria can refine the behavioral characteristics of rocks before the peak [40, 41]. In addition, by combining research on the AE signals and RVSD during the rock fracturing process, quantitative indicators can be provided for research on the entire life cycle of rock fracturing. In the context of the research presented in this paper, simultaneously acquiring AE signals generated by rock mass movement and RVSD information generated by changes in the electric field allows mutual verification of the two datasets and complementary data. Such a comprehensive nondestructive data acquisition approach not only gathers detailed information about the rock strata but also provides more accurate and effective early warnings of disasters.
5. Conclusion
- 1.
The water saturation treatment affected the mechanical properties of the rocks. After saturation, the average compressive strength of the medium-grained sandstone decreased by approximately 48.8%, and the average elastic modulus decreased by approximately 19.8%. For the fine-grained sandstone, the average compressive strength decreased by approximately 49.0%, and the average elastic modulus decreased by approximately 47.8%. In the case of the multilayered fine-grained sandstone, the average compressive strength decreased by approximately 70.36%, and the average elastic modulus decreased by approximately 52.71%. The smaller the grain size of the sandstone was, the greater the reduction in the mechanical properties due to water saturation.
- 2.
Both the AE and resistivity produced by the rock samples under loading corresponded well with the stress change. After water saturation treatment, the signal response strength of the AE significantly weakened, but the overall trend remained unchanged, showing a gradual increase in the AE signals with increasing stress, with a sharp increase at rock failure. The change in resistivity after water saturation treatment was much more gradual, generally showing a gradual decrease in resistivity with increasing stress, with a sudden change at the rock failure.
- 3.
A method was proposed for determining the closure strength σcc of the three types of saturated sandstones during the loading process using the RVSD index. By combining the closure strength and corresponding stress level relative to the peak stress obtained from experimental statistics, it is possible to estimate the peak strength of a rock sample early in the loading phase. The applicability of using the RVSD to determine the closure strength σcc for strength estimation was validated through experiments on the three types of saturated rock samples. The results showed that the estimation accuracy for the peak strength of the saturated medium-grained sandstone was the highest, with an average error of only 2.93%.
- 4.
During the loading process of rocks, the number of AE hits per unit of time increased nonlinearly over time, and the point of maximum curvature of this curve could be used as a precursor to rock failure. For the medium-grained sandstone, the trend of the curve of AE hits per unit of time was relatively gentle, and its point of maximum curvature was relatively far from the peak stress point. However, as the density of the rock increases, the point of maximum curvature approaches the peak stress point of the rock sample. Overall, for all three types of rocks, the failure precursor point extracted from the curve of AE hits per unit of time has a significant reference value for the study of rock failure–related disaster warnings in similar environments.
Nomenclature
-
- RVSD
-
- Resistivity standard deviation
-
- AE
-
- Acoustic emission
Conflicts of Interest
The authors declare no conflicts of interest.
Author Contributions
Rongpeng Ren and Bo Yin contributed equally to this paper.
Funding
This work was supported by the National Natural Science Foundation of China (Grant nos. 52264009 and 52378348), the Natural Science Foundation of Inner Mongolia Autonomous Region, China (Grant no. 2020LH05006), and the Basic Scientific Research Business Expenses Projects of Colleges and Universities Directly Under Inner Mongolia Autonomous Region, China (Grant nos. JY20220049 and JY20220051).
Acknowledgments
This work was supported by the National Natural Science Foundation of China (Grant nos. 52264009 and 52378348), the Natural Science Foundation of Inner Mongolia Autonomous Region, China (Grant no. 2020LH05006), and the Basic Scientific Research Business Expenses Projects of Colleges and Universities Directly Under Inner Mongolia Autonomous Region, China (Grant nos. JY20220049 and JY20220051).
Open Research
Data Availability Statement
The data used to support the findings of this study are included within the article.


