Research on Health Condition Monitoring for Glass Panel of Hidden Frame Glass Curtain Wall Under Wind Load Using Fuzzy Comprehensive Evaluation
Abstract
Under the excitation of strong wind load, the hidden frame glass curtain wall leads to the attenuation of safety performance, the fragmentation of glass panel, and the shedding of glass panel, which has a serious impact on the economic and social development and people’s safety. In this paper, a new health monitoring method was proposed for the glass panel of hidden frame glass curtain wall. The fuzzy comprehensive evaluation theory was used to establish the comprehensive evaluation model of the hidden frame glass panel. The factor set of the comprehensive evaluation model was established by the air tightness, deflection, natural frequency, and vibration amplitude of the hidden frame glass panel. The safety performance was divided into four levels of evaluation set, and the weight of each factor was calculated by analytic hierarchy process. The vibration signals of glass panel under different wind load conditions were processed by using the method of Hilbert vibration decomposition and envelope spectrum analysis, and the peak value and area of envelope spectrum were extracted to judge the vibration amplitude of glass panel, which was used as the evaluation index. The fuzzy comprehensive evaluation matrix was calculated by using the appropriate fuzzy operator, and the safety level of the glass panel was judged by using the principle of maximum membership degree for the calculation results. The feasibility of the method is proved by experiments, and it provides a theoretical basis for the subsequent health status monitoring of hidden frame glass curtain wall.
1. Introduction
The hidden frame glass curtain wall is mainly composed of glass panel, aluminum alloy supporting frame, and sealing structural adhesive. The glass panel and the aluminum alloy profile are completely adhered to each other by the sealing structural adhesive [1, 2]. Due to the complete exposure to the natural environment during the service process, the glass and its curtain wall components are damaged due to the long-term influence of wind load, temperature load, sunlight and rainwater erosion, and vibration load. The main failure modes of the glass panel, support frame, and connecting member are air leakage, rainwater leakage, corrosion, loosening, and deformation of the support frame. When extreme weather occurs, the glass panel may burst and fall off due to excessive wind pressure or the impact of sand and gravel, affecting the health of the glass curtain wall and threatening the lives of the people [3, 4]. Because of the particularity of the structure of the hidden frame glass curtain wall itself, and because of its light weight, the influence of vibration load and temperature load on it is negligible compared with the influence of wind load on it. For buildings using hidden frame glass curtain wall as the outer envelope, the glass panel will directly bear the pressure of wind load on the glass panel [5]. Compared with the aluminum alloy support frame, the strength value of the glass panel is lower. Under extreme wind load conditions, the panel will break up, and more seriously, it will lead to accidents such as high-altitude falling and injuring pedestrians [6]. For example, in 2008, the glass curtain wall of an office building in Fuzhou City fell off due to the aging of the structural adhesive and hit many cars parked on the roadside. In 2011, a building in Shanghai had four safety accidents due to the damage of the curtain wall panel and its components within half a year. In September of the same year, a high-rise building in Hefei failed due to the rust of the fasteners and crashed from high altitude to damage the vehicles parked on the roadside [7]. In 2018, the fixed panel outer sheet of the hidden frame glass curtain wall and the open fan panel outer sheet of an office building in Fuzhou fell off, which seriously affected the safety of the curtain wall [8]. In 2018, Typhoon Mangkhut made landfall in Hong Kong, China, causing varying degrees of damage to the glass envelopes of several of its buildings and causing serious economic losses [9]. In 2018, a sudden glass curtain wall falling accident occurred in the teaching building of a vocational college in Guangdong, resulting in the injury of many students [10]. It can be seen that the health status monitoring of glass curtain wall is of great significance to ensure the safety of people’s lives and property and the normal operation and development of society and economy.
In reference [11], the modal curvature was used to identify the damage location for the first time, and the modal curvature before and after the damage was compared to determine the damage location. At the same time, the change value of modal curvature was used to determine the damage degree. This method was used to monitor the health status and damage identification of simply supported beams, and the feasibility of this method was verified. Jin and Kang [12] took the natural frequency as a sensitive index of structural integrity and analyzed the relationship between natural frequency and structural integrity. The results show that the natural frequency can only determine whether the structure is damaged, and it is difficult to locate the damage location. In reference [13], the relationship between the imaginary part of the frequency response function and the modal flexibility was analyzed by using the frequency response function as the damage location index. An experimental study on a thin plate with local damage was carried out. The results show that different boundary conditions and damage degrees will affect the results of damage location. In reference [14], a baseline model reflecting the actual behavior of the structure was established, and the specific location of the damage was identified by analyzing the change of the modal participation rate in the baseline model before and after the damage. The relationship between the damage degree of the baseline model and the change of modal participation rate was studied to judge the damage degree of the structure and enrich the structural health monitoring method. In order to study the health status monitoring of glass curtain wall, Efstathiades et al. [15] mainly used artificial neural network technology to locate and identify the all or part of its connection with load-bearing structure. Based on the finite element model and artificial neural network, the parameter analysis and damage identification of glass curtain wall were carried out, respectively, and the influence of sensor position on the recognition effect was studied.
In [16–18], the health status of in-service building curtain walls was evaluated from the aspects of curtain wall panels, fasteners, supporting frames, and sealants. The relationship between the service time of each part of the curtain wall and the overall service time of the curtain wall was established, and the existing health monitoring methods of building curtain walls were studied. In reference [19], the evaluation model was established from three aspects: mechanical properties, physical properties, and appearance damage of glass curtain wall. The weight of each factor was solved by area method and uncertain analytic hierarchy process. This method was applied to practical engineering, and its health assessment was carried out, which proved the scientificity and applicability of the method. According to the evaluation process and evaluation results, the evaluation model was improved and optimized. Reference [20] focuses on the identification of structural adhesive damage of glass curtain wall, the method of combining EMD algorithm and vibration transmissibility was used to extract structural damage characteristics by calculating and comparing the vibration transmissibility of different components before and after damage, so as to judge the damage degree of structural adhesive of glass curtain wall. In reference [21], the displacement of glass panel under different wind loads was measured by digital photographic deformation measurement technology, and the deformation displacement cloud map of glass panel was drawn. The distribution of deformation displacement field of glass panel was analyzed, which provided a new measurement method for measuring the deformation of glass curtain wall and components.
It can be seen from the previous research results that although the current vibration monitoring technology has been widely used in the engineering field, there are relatively few studies on the health monitoring of hidden frame glass curtain wall under wind load by using vibration monitoring technology. In addition, in the health status monitoring of glass curtain wall, there are many factors affecting the health status of glass curtain wall and they are uncertain. Because of the mutual influence between various evaluation factors, it is difficult to establish an accurate model to monitor the health status of glass curtain wall.
Therefore, this paper proposed a new health condition monitoring method for the glass panel of hidden frame glass curtain wall under wind load. Firstly, the fuzzy comprehensive evaluation method was used to establish the comprehensive evaluation model of hidden frame glass curtain wall. Then, the Hilbert decomposition and envelope spectrum analysis were used to process the signal, and the envelope spectrum peak and envelope spectrum area were extracted to judge the vibration amplitude of the glass panel, which was used as an index to evaluate the health status of the glass curtain wall. Finally, the feasibility of the method was proved in the self-built glass curtain wall health monitoring test bench, which provided a theoretical basis for the health monitoring and evaluation of the glass curtain wall. At the same time, it will help the staff to effectively carry out daily maintenance and troubleshooting of the glass curtain wall and reduce the occurrence of safety accidents.
2. Stress Analysis of Glass Panel Under Wind Load
2.1. The Basic Equations of Mechanics of Thin Plate
Such components with a size much larger than the thickness in the long and wide directions are called plates. The thickness is the distance between the top surface and the bottom surface, and the middle value is taken as the distance. The surface parallel to the top surface and the bottom surface corresponding to the middle value is called the middle surface. The minimum size ratio b of thickness m and length-width size is used as the classification standard. If 1/80 ≤ l/b ≤ 1/5, it is called thin plate. An important index to measure the degree of bending is deflection. If the thin plate is bent during use, the vertical displacement of each point distributed on the middle surface during bending is defined as the deflection of the thin plate. The small deflection theory is that the deflection value is much smaller than the thickness value when the transverse load is applied, and the various deformations in the middle plane are ignored when analyzing the deformation of the thin plate.
- 1.
The straight line perpendicular to the middle plane before deformation remains vertical after the plate is bent.
- 2.
The length of the normal line of the middle plane is unchanged after deformation.
- 3.
When the deformation occurs, the points distributed on the middle plane have no displacement parallel to the middle plane; according to hypothesis (2), εz = 0; then
()
It can be seen from formula (20) that the deflection surface expression w(x, y) of the middle surface of the thin plate can be obtained by solving the equation under the given load and boundary conditions.
2.2. Navier Solution of Simply Supported Rectangular Thin Plate
The research object of this paper is the hidden frame glass curtain wall. According to the supporting conditions of the hidden frame glass curtain wall, it can be calculated by simply supported on four sides, and the Navier solution is used to solve the glass panel model.
3. Health Monitoring Method of Glass Curtain Wall
3.1. Establishment of a System of Evaluation Factors
According to the research of relevant researchers [23], the performance of the glass curtain wall’s air tightness and wind-pressure resistance could be attenuated due to the glass panels’ tendency to crack and break when subjected to extreme weather conditions or oversized loads, as well as due to the phenomena of corrosion, loosening, and aging of the supporting structure and barge components. The glass panel was a thin plate structure with low panel bending stiffness, which was prone to transverse vibration and has a large amplitude.
The air tightness, deflection, natural frequency, and vibration amplitude were taken as the evaluation indexes of the health status of the glass curtain wall.
3.2. Fuzzy Comprehensive Evaluation Method
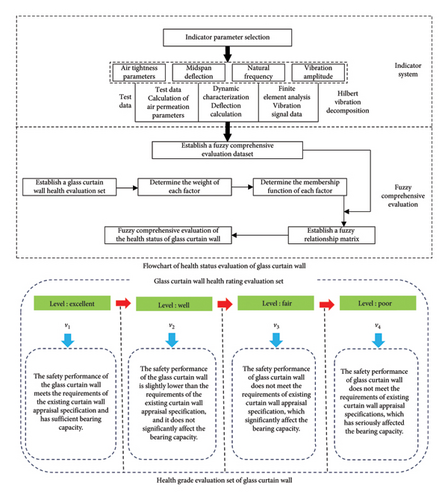
The health status of glass curtain walls was affected by multiple unknown elements. It was challenging to develop an accurate model to monitor the health status of glass curtain walls due to the mutual impact of various evaluation parameters. In order to fulfill the health status monitoring of glass curtain walls, this research used a fuzzy comprehensive evaluation approach to assess the hidden frame glass curtain wall’s health level. In Figure 1, the evaluation procedure is depicted. The steps for creating a fuzzy comprehensive assessment model were listed as follows. See Table A1 for parameter symbols.
3.2.1. Establishment of Judgment Sets
According to the reliability appraisal and reinforcement procedure of existing glass curtain wall [24], combined with the characteristics of glass curtain wall and the health characteristics of glass curtain wall, the evaluation (health) grade of glass curtain wall was divided into a = excellent, b = well, c = fair, and d = poor, like V = {v1, v2, v3, v4}, and each grade was specified as shown in Figure 1.
3.2.2. Determination of Factor Weights
The evaluation object factor set U was decomposed into n subfactor sets, that is U1, U2, …, Un and can be calculated by .
By comparing the weight of the factor set U1, U2, …, Un relative to the evaluation object, it was recorded as w1, w2, …, wn and satisfies . First of all, the factors were divided into several levels and quantified according to their importance to the evaluation objectives. The five-level quantitative method of 1∼9 scale was adopted [25], as shown in Table 1.
| Importance | Valuation | Explanation |
|---|---|---|
| Two factors are equally important | 1 | The same contribution of two factors to a property. |
| One factor is fairly important to the other | 3 | One of the two factors contributes a little more. |
| One factor is quite important to the other | 5 | One of the two factors contributes significantly. |
| One factor is pretty important to the other | 7 | One of the two factors is dominant. |
| One factor is very important to the other | 9 | One of the two factors is absolutely important. |
The weight vector w = (w1, w2, …, wn) can be obtained.
3.2.3. Fuzzy Comprehensive Evaluation
3.2.3.1. Selection of Synthesis Operator
In the fuzzy comprehensive calculation formula shown in formula (4), “。” was a fuzzy synthesis operator. The four types of common fuzzy synthesis operators were as follows, as shown in Table 2.
| Compare the situation | Operator | |||
|---|---|---|---|---|
| M(∧, ∨) | M(∧, ⊕) | M(·, ∨) | M(·, ⊕) | |
| Name | Main factor determining type | Unbalanced average type | Main factor prominent type | Weighted average model |
| Embody the role of weight | Not obvious | Not obvious | Obvious | Obvious |
| Using the information of membership degree | Insufficiency | Slightly sufficient | Insufficiency | Full |
| Comprehensive degree | Feebleness | Feebleness | Strong | Strong |
Different fuzzy operators represented different operation modes between weight matrix and fuzzy relation matrix, and their evaluation results were also different. Therefore, when evaluating the health status of the glass curtain wall, it was necessary to select the weighted average fuzzy operator with strong resolution and less information loss according to the characteristics of the glass curtain wall.
3.2.3.2. Determination of Membership Function
- 1.
Membership function of air tightness.
()()()() - 2.
Membership function of midspan deflection.
()()()() - 3.
Membership function of natural frequency.
()()()() - 4.
Membership function of vibration amplitude.
()()()()
3.3. Characterization Method of Vibration Amplitude of Glass Curtain Wall
During the long service period, the dynamic response signal of glass curtain wall has the characteristics of nonstationary and nonlinear due to the influence of external excitations such as traffic load, seismic load, and wind load for a long time, and the above excitations are uncertain and nonstationary loads. Therefore, Feldman proposed an analysis method for nonstationary signal processing—Hilbert vibration decomposition (HVD) [29].
3.3.1. Basic Principles of HVD
- 1.
Calculate the instantaneous frequency and amplitude of the original signal.
-
Firstly, the Hilbert transform was used to get the instantaneous amplitude A(t) and instantaneous frequency f(t) of signal x(t).
() - 2.
Using low-pass filtering, the maximum component frequency of the amplitude is calculated.
-
Firstly, the multicomponent nonstationary signal x(t) was reconstructed, and the Hilbert transform was used to calculated the amplitude a(t) and instantaneous frequency f(t) of the original signal x(t). Then, only the instantaneous frequency f1(t) of the maximum amplitude component was retained after the high-frequency oscillation part of the instantaneous frequency f(t) had been filtered using the low-pass filter.
()()()() -
where ag(t)—the amplitude of the gth component; fg(t)—the frequency of the gth component; θg—the initial phase of the gth component; and m—the number of original signal components.
- 3.
Use the synchronous detection method to calculate the corresponding instantaneous amplitude and phase.
-
The instantaneous frequency f1(t) was used as the reference frequency fr(t), and then the original signal was multiplied by the two reference orthogonal signals, respectively, to obtain the codirectional output x1(t) and the orthogonal phase output x2(t). Finally, the instantaneous amplitude ar(t) and phase θr(t) at this instantaneous frequency were obtained.
()()()() -
where ar(t)—the instantaneous amplitude of the rth component; fr(t)—the instantaneous frequency of the rth component; and θr(t)—the initial phase of the rth component.
- 4.
Determine whether to meet the stop criterion.
-
Firstly, the maximum amplitude component of the original signal x(t) was calculated, and then the original signal x(t) was subtracted from the calculated maximum amplitude component x1(t). Finally, the iterative calculation stopped when the normalized standard deviation of the residual signal component was σ < 0.001.
()()

3.3.2. Analysis Method Based on HVD and Envelope Spectrum
- 1.
Input the original vibration signal x(t) and set the parameters of cutoff criterion σ.
- 2.
Using HVD method to decompose the signal.
- 3.
Analyzing the decomposed signals’ envelope spectra, respectively.
- 4.
Comparing and selecting the optimal component envelope spectrum to determine the vibration amplitude of the glass curtain wall.
4. Mechanical Behavior Analysis of Glass Panels in Hidden Frame Glass Curtain Wall
4.1. Static Analysis
The numerical model of finite element analysis was established in ABAQUS, and the parameters of glass panel are shown in Table 3. The glass panel was assumed to be a uniform load under wind load, and a uniform load of 200 Pa was applied to the glass panel. The translational degrees of freedom in three directions were constrained on the four sides of the bottom surface, and the eight-node linear hexahedron element was used to mesh it, as shown in the first diagram of the second line in Figure 3.
| Parameters | |
| Types of glass | Tempered glass |
| Density (kg/m3) | 2560 |
| Young’s modulus (Mpa) | 7.2 × 10⁴ |
| Poisson ratio | 0.22 |
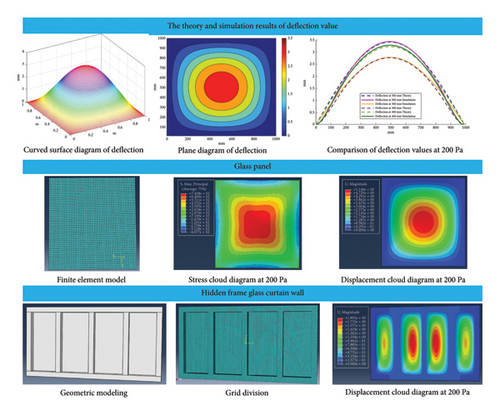
The stress of the glass panel under uniform load is determined by the stress, strain, and deformation of the static analysis. Therefore, the static analysis was carried out by using the established finite analysis model, and the stress, strain, and deformation of the glass panel were obtained. By applying loads to the glass panel, the glass panel will produce a certain bending deformation. The stress cloud diagram and displacement cloud diagram are shown in the second and third diagrams of the second line in Figure 3. The analysis of the stress cloud diagram shows that the maximum stress is distributed in the center of the glass panel. The stress of the glass panel is parabolic in the diagonal direction, with the minimum stress values at both ends and the maximum stress value at the center. By analyzing the displacement cloud diagram, it can be seen that the maximum deflection of the glass panel is distributed in the central area of the glass panel when the glass panel is subjected to wind load impact. By comparing the deflection surface after finite element analysis with the deflection surface after numerical calculation and simulation, it is found that both are approximately hemispherical and the maximum deflection is at its center.
To better compare the differences, set the shape of the glass panel to square. Because it is a centrosymmetric figure, when using theoretical calculation and finite element calculation to calculate the deflection, it is only necessary to analyze the variation trend of the deflection value at the center side of the glass plate. Therefore, in this paper, the deflection values at 300 mm, 400 mm, and 500 mm from the edge of the glass panel were taken, respectively, and the results of the two solutions were compared, as shown in Figure 3 in the first line of the third figure.
It can be seen from Figure 3 in the first line of the third figure that under the action of wind loads, the deflection value between any set of opposite sides of the glass panel increases first and then decreases, and the growth rate changes from fast to slow. The curvature at the center of the glass panel is almost 0. Because the panel is centrally symmetrical, its physical strain deflection is also symmetrically distributed, so it decreases in the opposite trend.
By extracting the deflection of the midspan measuring point calculated by finite analysis and numerical simulation in the third figure of the first line in Figure 3, a comparative analysis is performed, as shown in Table 4.
| Positive pressure | 200 Pa | 300 Pa | 400 Pa |
|---|---|---|---|
| The midspan deflection value in finite element analysis | 3.432 mm | 5.152 mm | 6.864 mm |
| The midspan deflection value calculated by numerical simulation | 3.412 mm | 5.124 mm | 6.836 mm |
| The midspan deflection value measured by the test | 1.81 mm | 2.72 mm | 3.62 mm |
| The relative error between the finite element results and the experimental results | 47.26% | 47.2% | 47.26% |
Through the analysis of Table 4, it is found that the reason for the large relative error between the finite element analysis and the test results is that the glass panel is adhered to the aluminum alloy profile by the structural adhesive due to the hidden frame glass curtain wall during the test. In addition, the displacement of the glass panel measured by the displacement sensor is affected by both the structural adhesive and the aluminum alloy frame, while the finite element model only considers the stress and displacement of the glass panel after loading. The relative error between the finite element method and the numerical method is very small. It can only approximately simulate the distribution of stress and deformation of the glass panel in the hidden frame glass curtain wall under load and cannot be used for the overall static analysis of the hidden frame glass curtain wall. Subsequently, the overall finite element model of the hidden frame glass curtain wall was established for further analysis.
The size of the hidden frame glass curtain wall is 4000 × 2000 mm during the health condition monitoring test. The glass panel of the hidden frame curtain wall is tempered glass with a thickness of 6 mm. The supporting frame of the glass panel is an aluminum alloy profile. The material parameters are shown in Table 5. After modeling and meshing, it is shown in the first and second figures of the third line in Figure 3.
| Parameters | |
| Types | Aluminum alloy |
| Density (kg/m3) | 2857 |
| Young’s modulus (Mpa) | 7 × 10⁴ |
| Poisson’s ratio | 0.33 |
When considering the influence of aluminum alloy support frame on the deflection of glass panel, the finite element numerical analysis model of hidden frame glass curtain wall is established and its midspan deflection is analyzed. The displacement cloud diagram is shown in the third line of Figure 3.
The midspan deflection of the glass panel obtained by the finite element numerical simulation was compared with the midspan deflection measured during the wind pressure monitoring test. The results are shown in Table 6.
| Positive pressure | 200 Pa | 300 Pa | 400 Pa |
|---|---|---|---|
| Midspan deflection during wind pressure monitoring test | 1.81 mm | 2.72 mm | 3.62 mm |
| Midspan deflection in finite element analysis (considering frame) | 1.892 mm | 2.832 mm | 3.785 mm |
| The relative error between the finite element results and the experimental results | 4.5% | 4.0% | 4.7% |
- 1.
According to the results of the finite element model numerical simulation calculation and the results of the experimental measurement and processing in the wind pressure monitoring, it is found that the relative error values of the two are not more than 5%, which further illustrates the correctness of the finite element model and can meet the needs in the project.
- 2.
The main reasons for the error between the finite element model and the test results are as follows. In the actual working conditions and tests, the wind does not act vertically on the glass panel, but has a certain angle and is not uniform. In the finite element numerical model, it is assumed that the wind load is uniformly distributed and acts vertically on the surface of the glass panel; the deformation of silicone sealant under load is very complicated in the actual structure of hidden frame glass curtain wall. The influence of compression and tensile deformation on glass panel is difficult to judge. Therefore, the influence of silicone sealant on the finite element model of hidden frame glass curtain wall is not considered, which leads to relative error.
- 3.
Outside the hidden frame glass curtain wall panel, the deflection of the glass panel is an oval part, and the displacement at the center of each plate is larger. The deflection of the part near the aluminum alloy frame is smaller, and the displacement trend of each glass plate is the same.
- 4.
The deflection trend of finite element numerical analysis of single glass panel and the whole hidden frame glass curtain wall is the same, so the finite element model of the whole hidden frame glass curtain wall is more reasonable, and it has certain guiding significance for engineering practice.
4.2. Analysis of Dynamic Characteristics
In order to analyze the dynamic characteristics of the glass panel of the curtain wall and calculate the natural vibration frequency, the finite element analysis model of the glass panel was established to analyze the vibration characteristics of the glass panel, and then the vibration characteristic parameters were obtained. Due to the wide variety of glass curtain walls and the small difference in connection methods, the common hidden frame glass curtain wall was selected for modal analysis. The boundary condition was set to be simply supported on four sides, and then the finite element model was established. Because the finite element model of the glass panel was relatively simple, the eight-node linear hexahedron was selected to mesh it. After meshing, the mesh was checked.
The finite element simulation model of the glass panel was solved, and the first 10 order resonance frequencies and the vibration modes of the glass panel are shown in Figure 4.
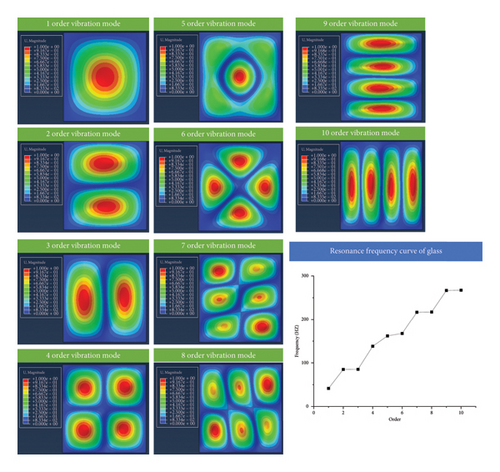
From Figure 4, we can see the vibration of the glass panel in each mode. The vibration of the glass panel was mainly in the Z direction, which was perpendicular to the glass panel. The first vibration mode of the glass panel was a single direction vibration perpendicular to the glass plane, and the vibration mode after the higher order was a symmetrical vibration in the upper and lower directions perpendicular to the glass panel. The modal analysis of the glass panel of the curtain wall provides a theoretical basis for understanding its dynamic characteristics and analyzing the vibration state and provides strong data support for the monitoring and evaluation of the health status of the glass curtain wall.
5. Monitoring Test of Health Status of Glass Curtain Wall
5.1. Test Scheme
The health monitoring test of glass curtain wall was mainly used to monitor the air tightness, water tightness, and wind pressure resistance of glass curtain wall and the vibration signal of glass curtain wall under wind load.
5.1.1. Air Tightness Test
The air tightness of the glass curtain wall refers to the performance of the glass curtain wall to prevent indoor and outdoor air circulation when there is a pressure difference between indoor and outdoor. When the air tightness is better, the indoor thermal insulation effect is better. In the air tightness monitoring test, the additional air permeability and total permeability of the glass curtain wall are monitored, and the air permeability per unit area is calculated by using the monitoring results and used as an important index to evaluate the air tightness of the glass curtain wall.
5.1.2. Water Tightness Test
The water tightness of the glass curtain wall means that the rainwater cannot penetrate into the room through the glass curtain wall under a certain wind load. Its performance directly affects the use function and service life of glass curtain wall. The wind pressure is divided into two methods: one is stable pressure and the other is fluctuating pressure. Because the curtain wall monitored by the test bench is mainly in nontropical and typhoon areas, the stable pressure method is adopted.
5.1.3. Wind Pressure Test
The wind pressure resistance of glass curtain wall means that the deformation and deflection of curtain wall panel and support system should meet the national standards [30] and design requirements [32] under the action of extreme wind load. Before monitoring, a displacement meter should be installed. The displacement meter should be installed at the large deformation of the curtain wall panel and the support frame and ensure that the displacement meter and the installation bracket are strong enough to ensure that the test results are not affected by other factors. The monitoring process is mainly divided into three parts: first deformation monitoring, second repeated pressure monitoring, and third safety monitoring. The type of glass curtain wall monitored by this test bench is hidden frame glass curtain wall.
5.2. Setting of the Test
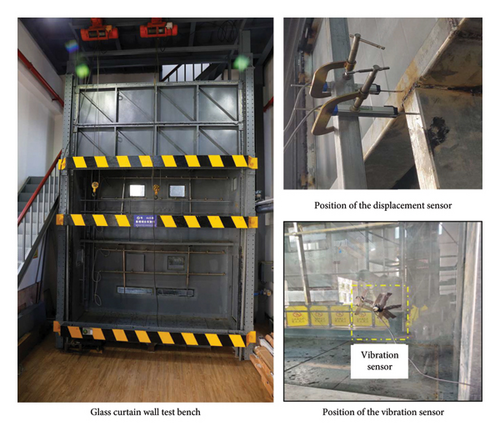
The health status monitoring test bench of the glass curtain wall is shown in Figure 5, and then the test method was used to verify the practicability and superiority of the proposed method. The test bench was controlled by the electric control box to control the fan speed, and the air flow entered the static pressure box through the positive and negative pressure switching device, the air pressure adjustment system, and the air pipeline system in turn. The air pressure and gas flow in the static pressure box were mainly controlled by the air pressure regulation system and the fan speed. The pump frequency converter was used to control the operation of the pump, and the water flow enters the water flow regulation system through the flowmeter, and then the water flow regulation system was used to accurately change the water flow rate. The main components of the test bench are shown in Table 7, where the acceleration sensor was placed at the edge of the glass panel, and the sampling frequency was set to 10 kHz and the sampling time was 10 s.
| Test bench equipment | Type | Function |
|---|---|---|
| Static pressure box | — | Installation location for glass curtain wall |
| Centrifugal fan | 9-19-710D | Provide wind pressure for glass curtain wall monitoring |
| Three-phase asynchronous motor | Y200L2-2 | Provide power for the rotation of centrifugal fan |
| Water pump | 32LG6.5-45 | Provide water pressure for glass curtain wall monitoring |
| Control cabinet | — | Power supply and control of the entire system |
| Spray pipeline | — | Provide sprinkler pipes |
| Reversing valve | — | The positive and negative pressure of the wind pressure is switched |
| Displacement sensor | KTC-75 | Measuring the deformation of glass curtain wall and its components |
| Air pressure sensor | Model 3051 capacitive (micro) differential pressure transmitter | Measure the change of air pressure in the chamber |
| Air flow sensor | SS20.502 | Monitor the air flow in the pipeline |
| Rotary glass flowmeter | LZB-80 | Monitoring of water flow |
| Fixture for displacement sensor | — | Fixed displacement sensor position |
| Acceleration sensor | CT1010L | Acquisition of vibration signal of glass curtain wall |
6. Processing and Analysis of Test Data
6.1. Data Processing of Air Tightness and Deflection
The air tightness, water tightness, and wind pressure resistance tests were carried out on the hidden frame glass curtain wall, and the air permeability data and displacement data were measured by the test. Then the air permeability and deflection of the glass curtain wall were calculated by referring to the physical three-property detection method of the curtain wall [30, 31], and the results are shown in Table 8 and Figure 6.
| Parameter type | Positive pressure | Negative pressure |
|---|---|---|
| Air permeability of integral curtain wall specimen qs (m3/h) | 1.3 | −15.5 |
| The overall air permeability of the specimen under standard conditions ql (m3/h) | 1.28 | −15.32 |
| Air permeability value per unit area ±qV (m3/(m2·h)) | 0.03 | 0.22 |
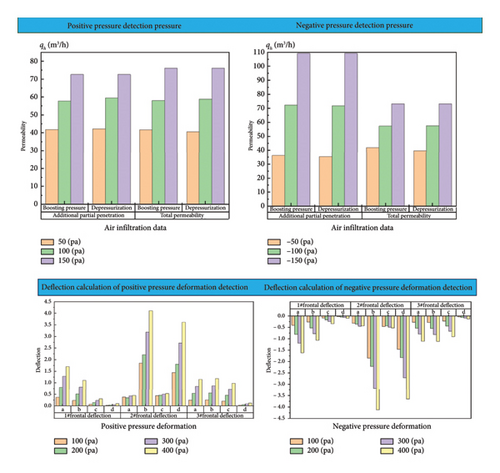
6.2. Comparative Analysis of Test Signals
According to the characteristics of the vibration signal of the hidden frame glass curtain wall structure, the HVD method was used to decompose and reconstruct the acceleration response signal of the hidden frame glass curtain wall under external excitation. The original vibration signal of the hidden frame glass curtain wall was obtained during the air tightness test. The HVD method was used to decompose and reconstruct the original vibration signal to obtain its time domain and spectrum diagram, as shown in Figure 7. It can be seen from the figure that when the hidden frame glass curtain wall was subjected to a single wind load, it was difficult to see the damage characteristics of the reaction glass curtain wall due to the influence of background noise by using the time domain diagram and spectrum diagram decomposed by the HVD method, and it was more difficult to judge its vibration amplitude. Therefore, it was necessary to analyze the envelope spectrum of each component after decomposition. The peak value and envelope spectrum area of the envelope spectrum analysis were used to judge the vibration amplitude of the hidden frame glass curtain wall, and the results are shown in Figure 7. Through comparison, it was found that the third layer of detail signal envelope spectrum has higher resolution and richer detail information.
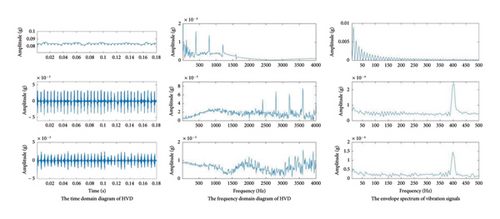
The vibration signal measured during the air tightness and water tightness monitoring test was subjected to HVD. The vibration signal was decomposed and reconstructed in three layers, and the three-layer detail component signal was obtained as shown in Figure 8. The first few layers of components contain important health information. The envelope spectrum analysis of the multilayer signal components was performed, and the health status characteristics of the glass curtain wall were found by comparing the corresponding amplitudes of different spectra.
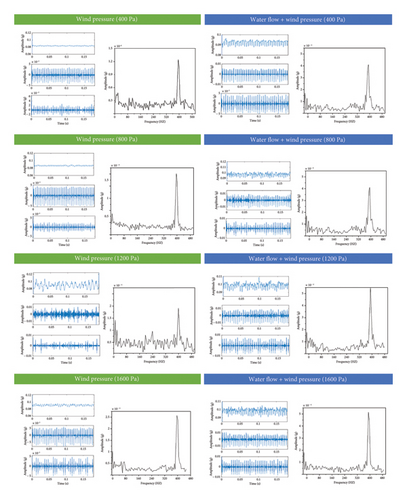
The acceleration signal under different load conditions had no obvious law, which cannot reflect the vibration amplitude of the glass curtain wall. Therefore, it was necessary to decompose the vibration signals under different excitations using HVD to obtain multilayer signal components. The signal components can represent not only the high-frequency characteristics of the vibration signals of the glass curtain wall but also the main energy in the vibration signals of the glass curtain wall. The greater the load on the glass curtain wall, the greater the vibration amplitude of the glass panel, and the richer the high-frequency characteristic information in the vibration response signal. Through the envelope analysis, the characteristic information in the signal was analyzed to determine the vibration amplitude of the glass curtain wall.
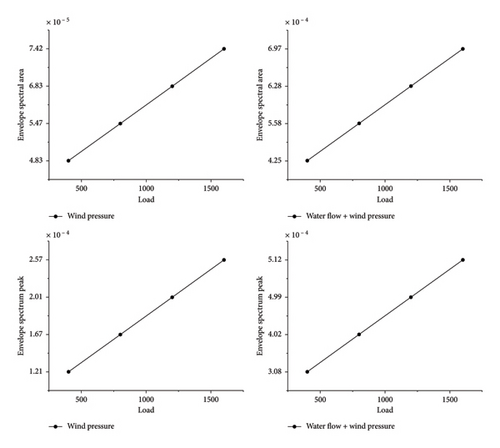
It can be seen from Figure 8 that when only the wind load is applied and the wind pressure is 400 Pa, the peak value of the envelope spectrum is 1.21 × 10⁻⁴. When the wind pressure is 1600 Pa, the peak value of the envelope spectrum is 2.57 × 10⁻⁴. When the water flow and wind pressure are 400 Pa, the peak value of the envelope spectrum is 3.08 × 10⁻⁴. When the water flow and wind pressure are 1600 Pa, the peak value of the envelope spectrum is 5.12 × 10⁻⁴. That is, as the external excitation of the glass curtain wall increases, the peak value in the envelope spectrum also increases. Whether it is only affected by the wind load or the combined action of water flow and wind load, the amplitude of the envelope spectrum increases with the increase of the load. The vibration response signal of the glass curtain wall is decomposed by Hilbert vibration, and the characteristics of the vibration signal of the glass curtain wall are identified and amplified, which makes it easier to judge the vibration amplitude of the glass curtain wall.
Through the comprehensive analysis of Figures 8 and 9, it can be found that with the increase of the external excitation of the glass curtain wall, the peak value and the area of the envelope spectrum in the envelope spectrum increased, respectively, indicating that with the increase of the external load excitation, the vibration amplitude of the glass panel increased. Therefore, when monitoring the health status of the glass curtain wall, the peak value and the area of the envelope spectrum can be used as an indicator to determine the vibration amplitude of the glass curtain wall.
6.3. Health Status Evaluation of Glass Curtain Wall
6.3.1. Determining the Weight of Each Factor
The pairwise judgment matrix of each factor was established to solve the weight of each factor, as shown in Table 9.
| Midspan deflection | Amplitude of oscillation | Natural frequency | Gas tightness | |
|---|---|---|---|---|
| Midspan deflection | 1 | 3 | 4 | 5 |
| Amplitude of oscillation | 1/3 | 1 | 2 | 3 |
| Natural frequency | 1/4 | 1/2 | 1 | 2 |
| Air tightness | 1/5 | 1/3 | 1/2 | 1 |
| Weight | 0.545 | 0.232 | 0.138 | 0.084 |
6.3.2. Fuzzy Comprehensive Evaluation of Glass Curtain Wall
By establishing the evaluation index system of “midspan deflection,” “vibration amplitude,” “natural frequency,” and “air tightness,” the evaluation grade of the safety state of the glass curtain wall was established, and then the membership functions of the corresponding evaluation indexes were constructed, respectively, and the weight of each index was determined by analytic hierarchy process. The safety status evaluation model of glass curtain wall was established in this process, as shown in Figure 10.
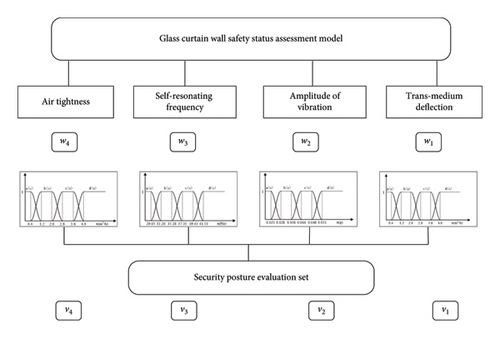
The wind pressure monitoring test value of 0.83 mm was substituted into its membership function to obtain the membership vector of the “midspan deflection” factor to the evaluation set Y; According to the vibration monitoring of the glass curtain wall in the health monitoring test of the glass curtain wall, the vibration amplitude of the glass curtain wall under different wind pressure and wind pressure and water pressure was solved. It is found that the risk value of the vibration amplitude of the glass curtain wall is 0.051. Using 0.031 as the evaluation value, it was substituted into the corresponding membership function to obtain the membership vector of the corresponding evaluation set of “vibration amplitude.” According to the vibration modal analysis results of the glass curtain wall, the membership vector of the “natural frequency” to the evaluation set Y is obtained by substituting 31.1 Hz as the evaluation value into its membership function. Through the air tightness monitoring test of the health status monitoring of the glass curtain wall, the air permeability data of the glass curtain wall under a certain load were obtained and processed. Taking 0.22 m3/(m2·h) as the evaluation value, the fuzzy processing was carried out to obtain the membership vector of the “gas tightness” factor to the evaluation set.
According to the target membership vector of this evaluation, the fuzzy results were identified by the model. According to the principle of maximum membership degree, it is concluded that the maximum membership degree of the result vector corresponds to the y1 level of the health status evaluation set Y = {y1, y2, y3, y4}.
According to the reliability appraisal and reinforcement procedure of existing glass curtain wall [24], GB/T 15227-2019 [30] and GB/T 31433-2015 [32], it is evaluated that the glass curtain wall is in the range of “excellent” grade at this time. Therefore, it is proved that the safety performance of the glass curtain wall meets the requirements of use and has no effect on the subsequent use, so as to complete the health status monitoring of the glass curtain wall.
7. Conclusion
- 1.
HVD and envelope spectrum analysis were performed on the vibration signals collected under different wind pressures. The envelope spectrum peak and envelope spectrum area were extracted to characterize the vibration amplitude of the glass curtain wall. The vibration amplitude index can better reflect the health status of the glass curtain wall under different actions.
- 2.
The finite element analysis model of the glass panel was established, and the vibration characteristics of the glass panel were analyzed. The dynamic characteristics of the glass panel of the curtain wall were analyzed and the natural frequency was calculated, and the vibration characteristic parameters were obtained. The finite element simulation model of the glass panel was solved, and the first 10 order resonance frequencies and modes of the glass panel were obtained. It provided a theoretical basis for understanding its dynamic characteristics and analyzing the vibration state and provided strong data support for monitoring and evaluating the health status of the glass curtain wall.
- 3.
The fuzzy comprehensive evaluation model of glass curtain wall was established. The factor set of air tightness, deflection, natural frequency, and vibration amplitude of glass curtain wall was established to evaluate its health status, and the evaluation set was established. The weight of each index was solved by the AHP method, and the fuzzy comprehensive evaluation model was established. Combining the test results and finite element analysis results, the fuzzy relationship moments were calculated to judge the health status of the glass curtain wall, which made the evaluation results more intuitive and credible and proved the feasibility of the method.
- 1.
The pressure supply system in the test rig can be improved in the future work to meet the demand for instantaneous wind pressure change.
- 2.
In the future research work, factors such as seismic wave and spatter can be considered to carry out more in-depth monitoring of glass curtain wall.
- 3.
In terms of glass curtain wall health monitoring, there are many factors that affect the health of glass curtain wall, which can be taken into account in the fuzzy comprehensive evaluation model of glass curtain wall in the future.
Conflicts of Interest
The authors declare no conflicts of interest.
Author Contributions
Letian Ding and Wei Cao contributed equally to this work and should be considered co-first authors.
Funding
This research was supported by the National Science Foundation of China (Grant No. 52175113), Special Research Program of the Shaanxi Provincial Department of Education (Grant no. 23JK0480). The Outstanding Thesis Cultivation Fund of Xi’an University of Technology in 2024 (Grant No. YS202404), and the Service Program for Foreign Experts of Shaanxi Province of China (grant no. 2025WZ-YBXM-41).
Appendix A: Nomenclature
| Parameter | Symbol |
|---|---|
| Health level | V |
| Factor sets | U |
| Weight number | w |
| The relative matrix of two factors | aij |
| Fuzzy vector | R |
| Membership function of air tightness | yg(xg) |
| Membership function of midspan deflection | yd(xd) |
| Membership function of natural frequency | yf(xf) |
| Membership function of vibration amplitude | ya(xa) |
| Instantaneous amplitude | A(t) |
| Instantaneous frequency | f(t) |
| Original signal | x(t) |
| Reference frequency | fr(t) |
| Phase | θ |
| Convolution | h |
Open Research
Data Availability Statement
The data used to support the findings of this study are available on request from the corresponding author.


