Quasi-Periodic Motion of a Strip During Rolling With 1:6 Internal Resonance
Abstract
The nonlinear vibrations developing in sheets and strips during rolling are of practical technological importance and of theoretical interest. However, the existing numerical methods adopted in research are plagued by problems such as computational inefficiency, difficulty in dealing with bifurcations, slow convergence and frequency cancellations. This study develops an analytical method for solving the problem of rolled strip quasi-periodic motions in the resonant state. First, the conventional incremental harmonic balance method is used to analyze the periodic response of a strip. Its nonlinear frequency response curve is obtained and the type of bifurcation along with its location is determined. Second, the quasi-periodic motion spectrum of the strip is characterized utilizing the fact that the adjacent frequencies in the side bands are equidistant from each other and contain two incommensurable fundamental frequencies. The fundamental frequencies of the strip quasi-periodic motion, as well as all of the frequency components and their corresponding amplitudes, are accurately resolved, especially the quasi-periodic motion response near the critical point. Finally, several numerical examples of the nonlinear vibrations exhibited by the rolled strip in the presence of internal resonance are investigated in depth to validate the proposed method performance and accuracy. These examples are concerned with the internal resonance with an even inherent frequency ratio of 1:6, which may arise during the rolling process, but remains relatively unexplored. The newly proposed method will add to the arsenal of available analytical techniques, expanding the capabilities of both researchers and practicing engineers.
1. Introduction
The problem of nonlinear vibrations in sheets and strips during rolling is a critical technological issue that affects surface quality and production stability [1–7]. Since the 1950s, a large amount of analytical research has been performed on the periodic responses of strips, which usually have a single fundamental frequency and a positive integer frequency-to-frequency ratio [8, 9]. However, a quasi-periodic response can be stimulated by specific conditions during rolling due to the strong nonlinearity of strip vibrations, and there are many irreducible frequencies in the spectrum diagrams [10–12]. With research on quasi-periodic motion, it is important to understand the nonlinear vibration characteristics of the strip rolling process and to recognize the plate belt transition state from a periodic response to a chaotic response to improve the rolling process theory and improve product quality.
Pham and Hong [13] compiled a survey of the existing dynamical models for axially moving systems. Liao et al. [14] overviewed the analytical continuation and stability methods for quasi-periodic nonlinear systems. Currently, in the study of nonlinear system dynamics, the quasi-periodic motion characteristics near a bifurcation point are obtained from the system periodic responses using numerical solutions. Lau et al. [10] proposed a harmonic equilibrium method with a multi-timescale to calculate the quasi-periodic free vibrations of damped simple beams. Based on this, Ling [15] described the quasi-periodic motion of a system in a multi-excitation state using the “hitting target method” numerical solutions. The quasi-periodic motion of the nonlinear Mathieu equation in a weakly-damped state was studied by Guennoun et al. [16]. Avramov et al. [17] analyzed forced rotor vibrations by building a four-degree-of-freedom nonlinear dynamics model and observed the coexistence of periodic and quasi-periodic motion during the vibration process. Qian et al. [18] comprehensively analyzed the factors influencing vibrations in a tandem cold-rolling mill. Alshaqaq and Hawwa [19] investigated nonlinear vibrations of an axially moving small beam subjected to an electrostatic force. Cheng et al. [20] derived a boundary stability criterion for a nonlinear axially moving beam. Zhang et al. [21] and Zhang et al. [22] examined the internal resonances and dynamic stability of an axially moving beam subject to a dual-frequency parametric excitation. Raj et al. [23] presented an analysis of a nonlinear traveling beam with longitudinally varying axial tension and variable velocity affected by parametric and internal resonances.
To avoid the inefficiencies of numerical methods that do not handle bifurcation types well, some researchers used the multiscale method within the classical perturbation method to calculate the quasi-periodic motion of nonlinear systems [24, 25]. However, the multiscale method is generally applicable to weakly nonlinear systems with relatively few degrees of freedom. For this reason, Summers [26] combined the multiscale method with the harmonic equilibrium method and proposed a new harmonic equilibrium method for finding periodic solutions, and the method was extended to quasi-periodic motion. Villanueva [27] proposed a new averaging-extrapolation method that facilitated refining the quasi-periodic frequencies. Huang et al. [28] obtained quasi-periodic solutions for a damped nonlinear Mathieu equation. As in the Fourier transform method, the analysis of quasi-periodic motion using a multitimescale method based on certain frequencies may result in other irreducible frequency deletions. Additionally, convergence is difficult to achieve by selecting two incommensurable frequencies using methods such as the harmonic balance method [29, 30]. Based on the problems exposed by the above studies, the two-timescale incremental harmonic balance (IHB) method, which has a higher accuracy, lower time consumption, and wider applicability than the other methods, is adopted in this study.
The quasi-periodic motion characteristics of rolling plate belts, which are axial motion systems, have not been thoroughly studied because there are internal resonances between the system modes during rolling. There are more than two irreducible frequencies for the quasi-periodic motion of a strip. Due to the internal resonance between the rolling systems during strip rolling, there is a relationship between the incommensurable frequencies of the quasi-periodic motion in the intervals between any two adjacent frequencies at the fundamental frequency are equal in size [31–33]. Therefore, a two-timescale IHB method is established in this study to determine all frequency components of the system by taking the fundamental frequency of the strip, ω, and the interval frequency of two adjacent frequencies, ωd, as the two timescales.
A vibration control equation for the strip vibration during the rolling process is developed during this study. Periodic and quasi-periodic solutions for the rolled strip are obtained using the two-timescale IHB method when the Galerkin method is used to separate the time variables. This method has two timescales and is an effective and accurate semianalytic method for analyzing the quasi-periodic motion of nonlinear systems. The results show that all the frequency components and their amplitudes obtained using the two-timescale IHB method are consistent with the results obtained using the Runge–Kutta method (a numerical solution).
This paper is organized as follows. In the section that follows, the governing equations of the problem are established. Subsequently, the two-time scale IHB method is derived. The newly proposed approach is then applied to several problems, including the analyses of periodic motions of plate bands, principal harmonic resonances occurring during quasi-periodic motions and quasi-periodic motions under subharmonic resonance. In-depth qualitative and quantitative analyses of these examples are presented alongside the verification of the proposed method performance and accuracy. Finally, a set of conclusions rounds up the study.
2. Equations
The mechanical model for the strip rolling process is shown in Figure 1, where K represents the rolling stiffness factor, Fox is the strip tension, the rolling force is Fz(t)(Fz(t) = Fδ(x − a)|a=Lcos(ω t)), and δ(x − a) is the Dirac function.

In equation (7), ρ represents the mass density of the strip, w is the lateral displacement, h is the thickness of the strip, V is the axial velocity of the strip, Fox is the tension of the strip, DM is the bending stiffness, and DN is the tensile stiffness.
3. IHB Method With Two Timescales
- 1.
The first improvement is the introduction of two timescales, τ1 = ωt and τ2 = ωd t. ω represents the fundamental frequency of the quasi-periodic motion of the strip and ωd is the difference between the fundamental frequency and the adjacent frequency. q(t) is a function of τ1 and τ2, namely, q(t) = q (τ2, τ2). The following operator relationship can be obtained:
()() -
As in the original IHB processing method, the two-timescale IHB method is analyzed first. q0, ω0 and ωd0 are the solutions of equation (11), and their neighborhood points are denoted as q = q0 + Δq, ω = ω0 + Δω, and ωd = ωd0 + Δωd. By substituting the neighborhood points into equation (11) and neglecting the higher-order minima, incremental equations are obtained in which Δq, Δω and Δωd are the unknown quantities:
() -
where
() - 2.
The second improvement is to expand q0 into a dual Fourier series form with two time variables, τ1 and τ2:
() -
In (18), Nm represents the number of fundamental frequency terms in the Fourier series, and and represent the harmonic term coefficients. The side bands of the quasi-periodic spectrum are concentrated on the frequency, ω, and its integer multiples, and the distances between adjacent frequencies in the side bands are equal. The frequency components of the quasi-periodic motions of all the strips can be expressed as 0, ωd, 2ωd, …, nfωd, ω, ω ± ωd, ω ± 2ωd, … , ω ± nfωd, … , ncω, ncω ± ωd, ncω ± 2ωd, … , ncω ± nfωd, where nc is the number of terms corresponding to harmonic terms in integer multiples of the frequency, ω, and nf represents the number of terms corresponding to harmonic terms in integer multiples of the side bands of the frequency, ω. Then (18) can be expressed as shown in (19):
() -
where
() -
The increment Δqj can also be converted into a Fourier series form:
() -
where
() -
Therefore, the modal and incremental matrices of the strip can be expressed in terms of the Fourier coefficient matrix, A, and the Fourier incremental coefficient matrix, ΔA, as shown in (16):
() -
where
() -
Using the Galerkin averaging process to unbalance the harmonic term in equations (13) and (18) is obtained:
() -
Substituting q0 and Δq from equation (23) into (25) yields a linear system of equations with ΔA, Δω, and Δωd as unknown quantities.
() -
In equation (26), KA is the tangent matrix, R is the correction matrix, and Rω and Rωd are the imbalance vector matrices corresponding to the variations in ω and ωd, respectively, where
() -
in which
() - 3.
The third improvement is to set two control variables so that they satisfy the solvability condition of equation (26) to obtain the response solution of the quasi-periodic motion of the strip. When the external excitation amplitude is fixed, the number of unknown increments (ΔA, Δω, and Δωd) is two more than the number of equations in equation (26). Therefore, the other two increments must be set in advance during each iteration. The initial solution for the quasi-periodic motion must be found from the unstable solution for the plate strip periodic motion using the Floquet theory [39, 40]. In addition, during the iterative process, the modulus of vector R can generally be taken as less than 10−10 as a condition for convergence.
4. Results and Analysis
In this study, the method described above is used to investigate an example. The specific parameters of the rolled strip are L = 8 m, h = 0.008 m, V = 8.76 m/s, ρ = 7800 kg/m3, E = 2 GPa, and T = 5000 N/m [41]. There are also three dimensionless parameters, η1 = 0.5653, η2 = 0.2, and ξ = 3.2929, and the inherent frequency ratio of the strip is ω10 : ω20 = 1:6.
That particular inherent frequency ratio was selected because whereas extensive research exists on internal resonances with odd ratios (1:1, 1:3, and 1:5) [42–47], during the rolling process, controlled by the rolling speed, internal resonances with even frequency ratios (such as 1:6) may arise. The latter remain relatively unexplored. In the case of odd frequency rations, the odd harmonics are excited, while the amplitudes of the even harmonics remain zero. Energy is exchanged between modes over time, e.g., if the highest amplitude of the first mode appears at frequency ω, then the corresponding highest amplitude of the second mode appears at frequency 3ω. However, in the case of an even frequency ratio, even harmonics of the first fundamental frequency ω1 are excited and energy exchange occurs between even harmonics. For instance, the highest amplitude of the first mode may appear at ω and the corresponding highest amplitude of the second mode at 4ω. Near the second fundamental frequency ω2, the energy exchange occurs similarly to the cases of odd internal resonance ratios.
4.1. Periodic Motion of the Plate Bands
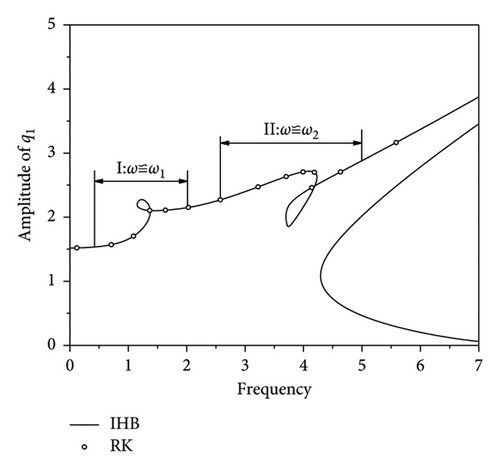
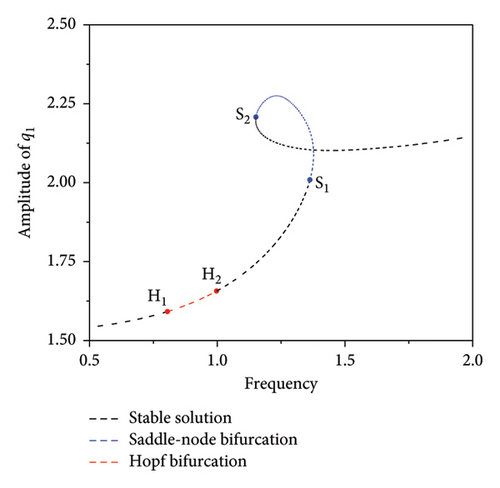
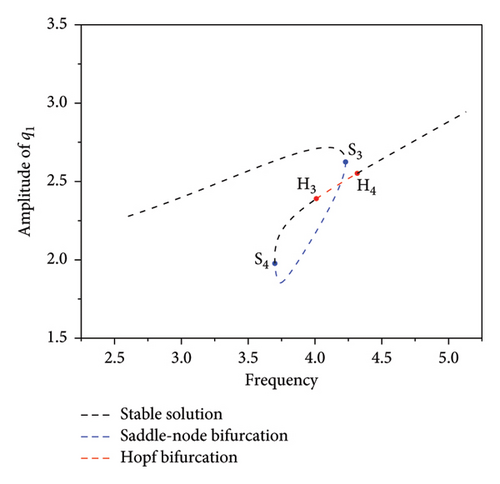
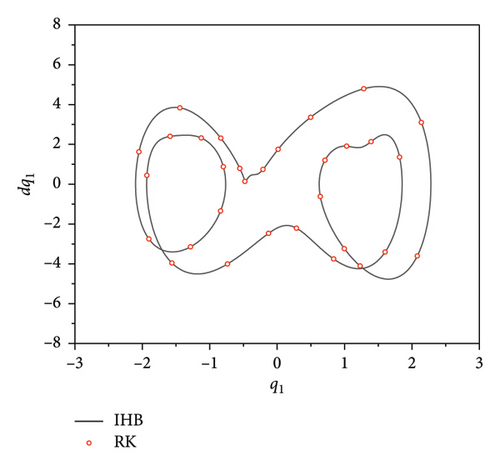
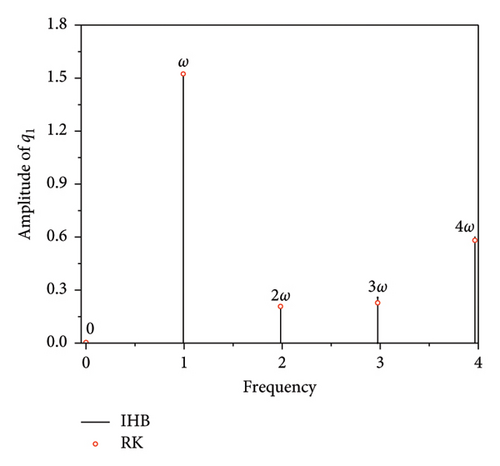
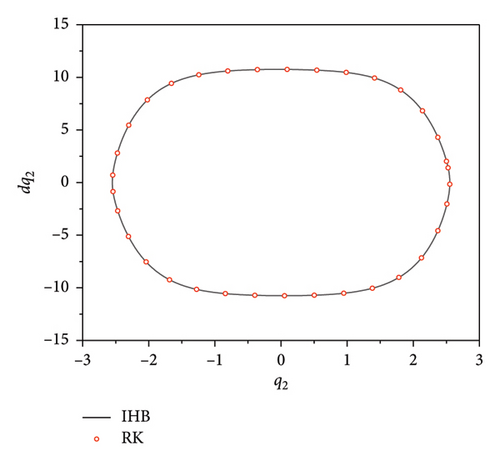
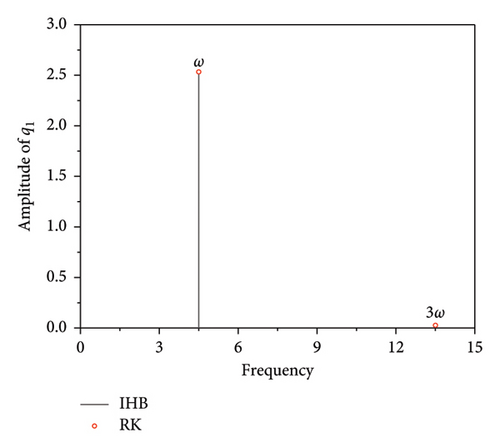
The ω-q1 frequency response curve for the periodic response of the strip when f1 = 18.25 is shown in Figure 2. Figure 2(b) shows an enlargement of the I region (main harmonic resonance) in Figures 2(a) and 2(c) shows an enlargement of the II region (subharmonic resonance) in Figure 2(a). Figure 2(a) shows that there is a saddle-node bifurcation and Hopf bifurcation in the plate strip during the rolling process. The black dashed line indicates the stable periodic solution, and the other dashed lines indicate the unstable periodic solution. The blue dashed line indicates the saddle-node bifurcation region, and the red dashed line indicates the Hopf bifurcation region. The Floquet multipliers of the response points in the four neighboring bifurcations in Figures 2(b) and 2(c) are listed in Table 1. Table 1 shows that one of the Floquet multipliers in the complex plane crosses the unit garden from the +1 direction, leading to the saddle-node bifurcation (S1S2, S3S4) and thus the jump phenomenon. Additionally, a pair of conjugate Floquet multipliers crosses the unit circle, leading to Hopf bifurcation (H1H2, H3H4) and also to the quasi-periodic motion.
| Frequency | Floquet multipliers | ||||
|---|---|---|---|---|---|
| λ1 | λ2 | λ3 | λ4 | ||
| Near point S1 | ω = 1.3510 | −0.4458 ± 0.2440i | −0.5139 ± 0.050i | ||
| ω = 1.3631 | 1.0517 | 0.5000 | −0.5256 ± 0.2740i | ||
| Near point S2 | ω = 1.1539 | 1.1324 | 0.3540 | −0.5000 ± 0.0906i | |
| ω = 1.1622 | −0.6219 ± 0.2485i | −0.5013 ± 0.0137i | |||
| Near point H1 | ω = 0.7873 | −0.9720 ± 0.0610i | −0.4612 ± 0.4342i | ||
| ω = 0.8085 | −0.9825 ± 0.2610i | −0.5316 ± 0.2413i | |||
| Near point H2 | ω = 0.9675 | −0.9589 ± 0.2450i | −0.4120 ± 0.145i | ||
| ω = 0.9892 | 0.9857 | 0.3573 | −0.5321 ± 0.2735i | ||
| Near point S3 | ω = 4.2746 | 0.9195 | 0.2743 | −0.7272 ± 0.5014i | |
| ω = 4.2853 | 1.0782 | 0.6610 | −0.7178 ± 0.5149i | ||
| Near point S4 | ω = 3.6689 | 1.0125 | 0.4217 | −0.6010 ± 0.4422i | |
| ω = 3.6701 | −0.6916 ± 0.6320i | −0.6728 ± 0.4394i | |||
| Near point H3 | ω = 4.0290 | −0.5372 ± 0.8222i | −0.4350 ± 0.6052i | ||
| ω = 4.0379 | −0.5648 ± 0.8470i | −0.4257 ± 0.5847i | |||
| Near point H4 | ω = 4.3385 | −0.7590 ± 0.6610i | −0.6010 ± 0.4422i | ||
| ω = 4.4142 | −0.6916 ± 0.6320i | −0.6728 ± 0.4394i | |||
During the rolling process, some important and interesting kinetic phenomena are generated due to internal resonance. The jump phenomenon is shown in Figure 2(b). If the external excitation amplitude remains constant while the frequency, ω, changes slowly, the amplitude of the periodic solution increases as ω increases. When the periodic solution reaches the bifurcation point, S3, the amplitude, q1, suddenly jumps into the response curve, H3H4, and finally reaches the bifurcation point, H4. Conversely, the process of sweeping to the left is examined. The periodic solution starts from H4, and when ω gradually decreases, q1 passes through the quasi-periodic bifurcation section, H3H4, and gradually decreases to the bifurcation point, S4. If ω continues to decrease, q1 suddenly jumps from point S4 and decreases as the frequency decreases.
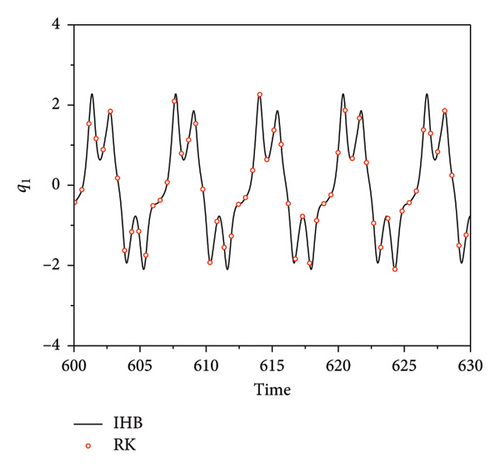
Figures 3(a) and 4(a) are time diagrams, which show that the motion trajectory repeats after a fixed time period T. Figures 3(b) and 4(b) are phase diagrams, displaying closed curves. By observing the time-history diagrams and phase diagrams, it can be concluded that the system’s response is periodic. Figures 3(c) and 4(c) present the corresponding spectrograms, showing that when the excitation frequency is in the main harmonic resonance region (ω ≈ ω1), the even multiples of the frequencies in the spectrogram are excited. However, when the excitation frequency is in the subharmonic resonance region (ω ≈ ω2), the even multiples of the frequencies in the spectrogram are suppressed. A comparison with the numerical solution shows that the semianalytical solution obtained with the IHB method has relatively high accuracy.

4.2. Principal Harmonic Resonance During Quasi-Periodic Motion of the Plate Strip (ω ≈ ω1)
As the excitation frequency approaches the bifurcation point, H1H2, the plate band begins to experience quasi-periodic motion. At this time, the side band spacing of the plate band is τ2 ≠ 0, the unstable periodic solution near H1 can be set as the initial value of the quasi-periodic motion, and q1 and q2 can be expressed by equation (14).
When the excitation frequency is ω = 0.9852, the time course curves of the quasi-periodic motions of q1 and q2 form an “envelope,” as shown in Figure 5. By zooming in on the region of the time course curve, it can be seen that because of the internal resonance, an energy interchange process between the plate and strip modes is constantly occurring and generating a beat vibration phenomenon. Figure 6 shows an enlarged view of the two regions presented in Figure 5. The IHB method for both timescales agree well with the results from the RK method.
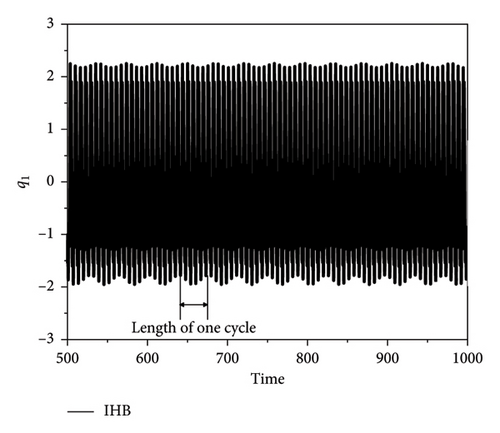
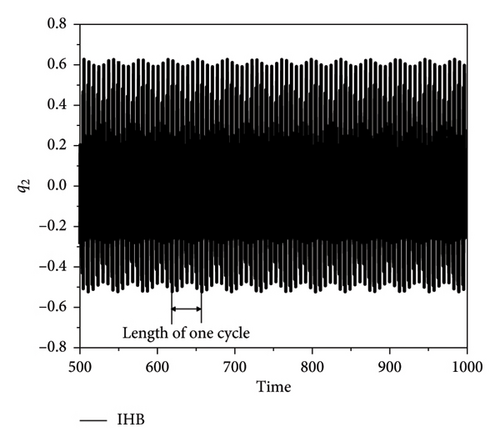

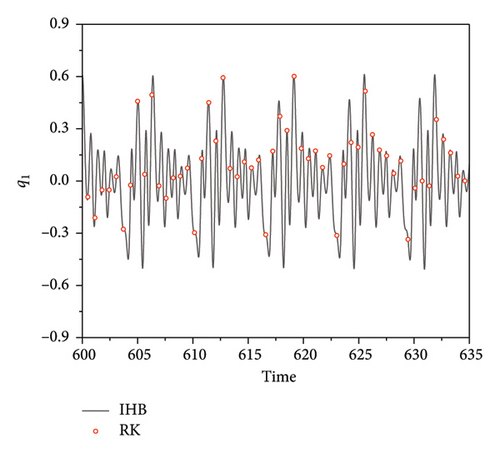
Figure 7 presents phase plane diagrams for the numerical solution and the two-timescale IHB method for the quasi-periodic condition of ω = 0.9852 and the unstable solution obtained with the conventional IHB method. The unstable periodic response evolves to quasi-periodic motion after a period of time when the unstable IHB solution is used as the initial value, and the RK and two-timescale IHB methods are used to calculate the response of the thin plate. The results show that the phase plane formed by the unstable solution obtained from the IHB method is a closed curve. By contrast, the phase plane created by the quasi-periodic motion forms an attractor. The phase planes obtained with the two methods are in good agreement.
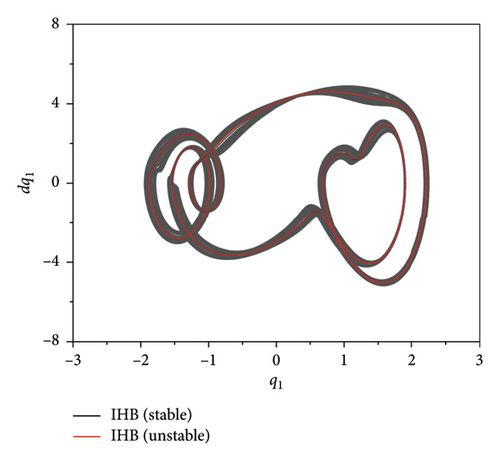
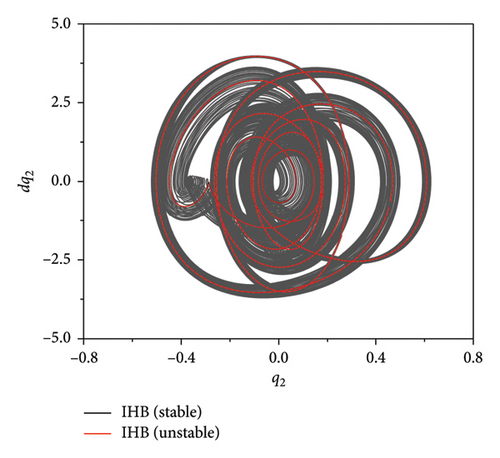
Figure 8 presents the quasi-periodic motion spectrum at the excitation frequency ω = 0.9852, and the higher-order frequency components are not shown in the spectrum due to their small values. The spectrogram in Figure 8 shows that the quasi-periodic characteristic side band phenomenon appears at integer multiples of the frequency, nω, with equal values of the interval frequency, ωd, and a frequency distance of ωd = 0.1706. According to the spectrogram of the plate band, the amplitude value at frequency nω is the largest. When the other frequencies are far from frequency nω, a further distance leads to a smaller amplitude value.
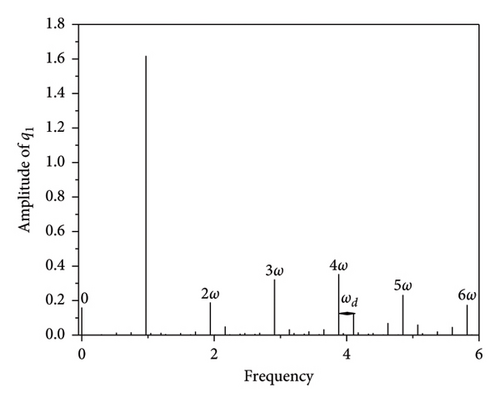
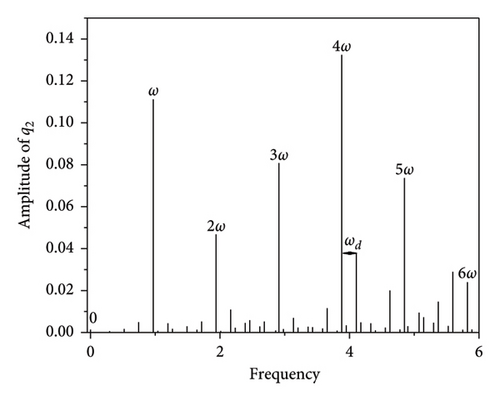
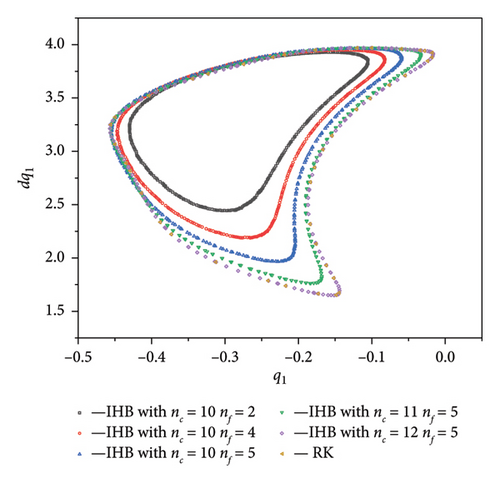
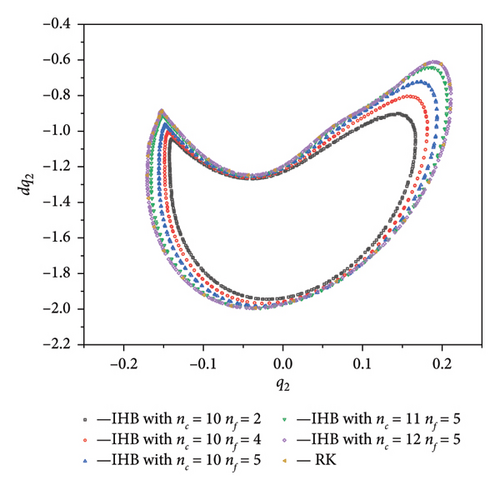
The higher-order frequencies and frequencies relatively far from nω can be neglected when plotting the spectrum but cannot be ignored when solving using the dual-timescale IHB method. Figure 9 shows the Poincaré cross-sections at ω = 0.9852. A comparison of the RK numerical solution and two-timescale IHB analytical results shows that the Poincaré cross-section obtained from the two-timescale IHB method is more similar to the graph obtained from the numerical solution when the harmonic terms nc and nf are taken during the process of finding the exact solution. When nc = 12 and nf = 5, the Poincaré cross-section graph obtained from the two-timescale IHB method is the same as that obtained from the numerical solution. This indicates that the dual-timescale IHB method used in this study produces results that agree with the results obtained from the numerical solution and that the solutions this method obtains are highly accurate.
4.3. Quasi-Periodic Motion of the Strip Under Subharmonic Resonance (ω ≈ ω2)
When the excitation frequency approaches bifurcation section H3H4, the plate band begins to experience quasi-periodic motion in the subharmonic resonance region. At this time, the side band spacing of the plate band is τ2 ≠ 0, the unstable periodic solution near H3H4 can be set to the initial value of the quasi-periodic motion, and q1 and q2 can be expressed by equation (14).
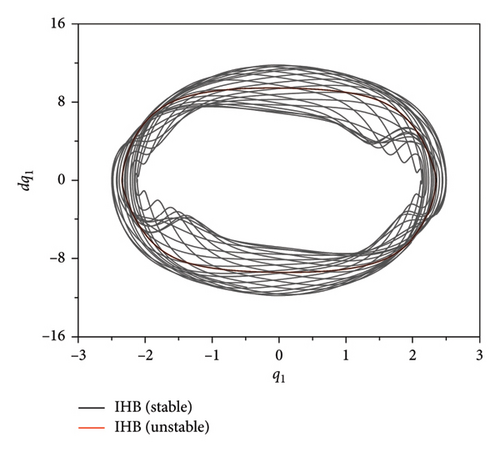
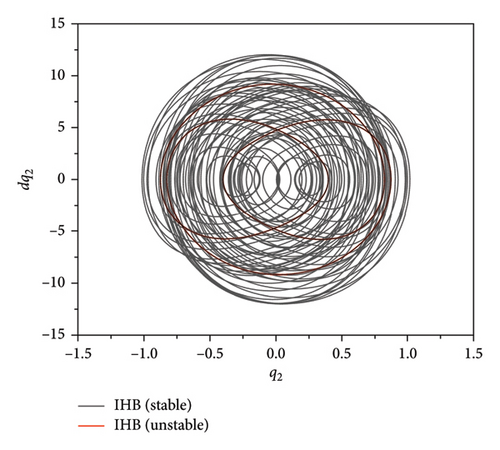
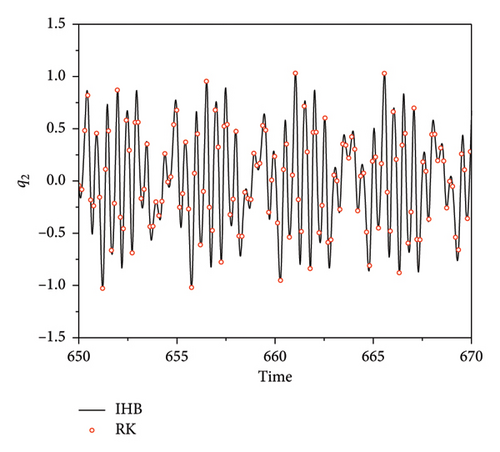
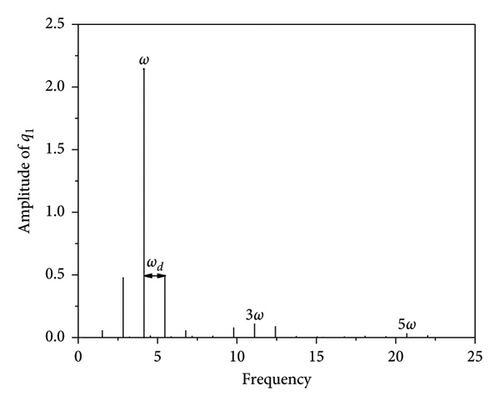
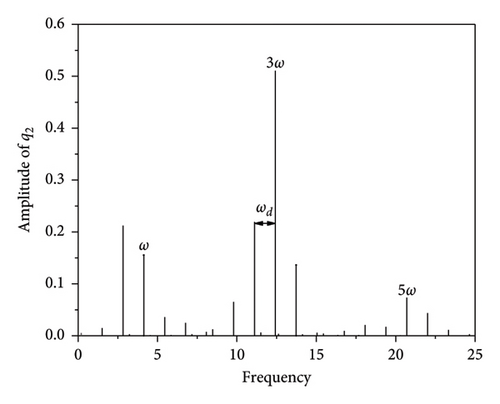
The quasi-periodic motion in the H3H4 segment, i.e., near the subharmonic resonance region, can be obtained by applying the procedure outlined in Section 4.2. Figures 10 and 11 show the results obtained with the RK method and the two-timescale IHB method. Figures 10 and 12 present phase diagrams and spectra at an excitation frequency of ω = 4.14015. Unlike the quasi-periodic motion of the plate band at the main harmonic resonance, the even multiples of the plate band and its side bands are not excited, and only the odd multiples of the frequencies and their side bands are present in the entire fundamental frequency sequence. For the main harmonic resonance, there are equally-spaced sidebands near the excited fundamental frequency, and the harmonic term coefficients become smaller as the frequency moves away from the fundamental frequency. The combination of the spectral data obtained by the IHB and Runge–Kutta methods (Table 2) indicates that when the number of harmonic terms is large, the difference between the two results is small, but at frequencies with small amplitude values, such as 3ω ± 2ωd or 3ω ± ωd, there are small differences between the two results. This result occurs because of the existence of a certain error in the numerical solution when using the fast Fourier transform, the magnitude of which does not affect the equation accuracy.
| Frequency | IHB | RK | |||||||
|---|---|---|---|---|---|---|---|---|---|
| nc = 3, nf = 3 | nc = 3, nf = 5 | nc = 5, nf = 7 | |||||||
| Amplitudes | Amplitudes | Amplitudes | Amplitudes | ||||||
| q1 | q2 | q1 | q2 | q1 | q2 | q1 | q2 | ||
| Near w | 1.50882 | 0.07069 | 0.01681 | 0.06779 | 0.01587 | 0.06578 | 0.01586 | 0.06578 | 0.01586 |
| 2.82448 | 0.54695 | 0.23133 | 0.52274 | 0.25544 | 0.50971 | 0.22411 | 0.50970 | 0.22411 | |
| 4.14015 | 2.11594 | 0.12393 | 2.12238 | 0.14734 | 2.14297 | 0.15522 | 2.14297 | 0.15522 | |
| 5.45581 | 0.57885 | 0.04179 | 0.55198 | 0.03984 | 0.53192 | 0.03984 | 0.53192 | 0.03984 | |
| 6.77148 | 0.06107 | 0.02840 | 0.06024 | 0.02679 | 0.05875 | 0.01254 | 0.05924 | 0.02679 | |
| Near 2w | 5.64898 | 0 | 0 | 0 | 0 | 0 | 0 | 0 | 0 |
| 6.96464 | 0 | 0 | 0 | 0 | 0 | 0 | 0 | 0 | |
| 8.28030 | 0 | 0 | 0 | 0 | 0 | 0 | 0 | 0 | |
| 9.59596 | 0 | 0 | 0 | 0 | 0 | 0 | 0 | 0 | |
| 10.9116 | 0 | 0 | 0 | 0 | 0 | 0 | 0 | 0 | |
| Near 3w | 9.78911 | 0.08745 | 0.07432 | 0.08567 | 0.07023 | 0.08014 | 0.07075 | 0.08400 | 0.06975 |
| 11.1047 | 0.14001 | 0.27444 | 0.12315 | 0.23677 | 0.11831 | 0.24312 | 0.11715 | 0.23677 | |
| 12.4204 | 0.09777 | 0.54103 | 0.09643 | 0.53014 | 0.09503 | 0.51576 | 0.09503 | 0.51014 | |
| 13.7361 | 0.01268 | 0.14866 | 0.01204 | 0.14412 | 0.01653 | 0.14213 | 0.01194 | 0.14412 | |
| 15.0517 | 0.00680 | 0.00711 | 0.00665 | 0.00718 | 0.00657 | 0.00609 | 0.00652 | 0.00708 | |
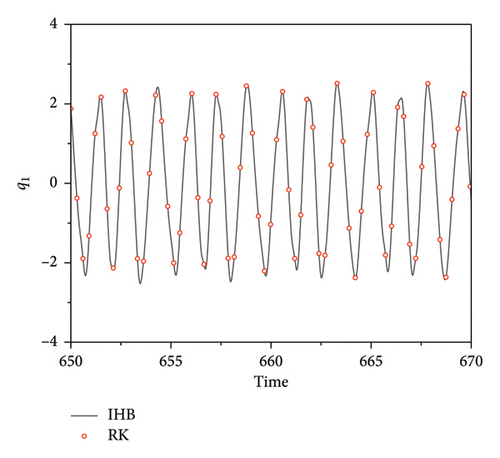
Figure 13 presents time course curves for the plate strip at an excitation frequency of ω = 4.14015. For ω = 0.9852, the time course curves of the quasi-periodic motions of q1 and q2 form an “envelope.” The Zoomed in view of the local area (Figure 11) shows that there is also a constant interchange of energy between the strip modes and a beat vibration phenomenon due to internal resonances.
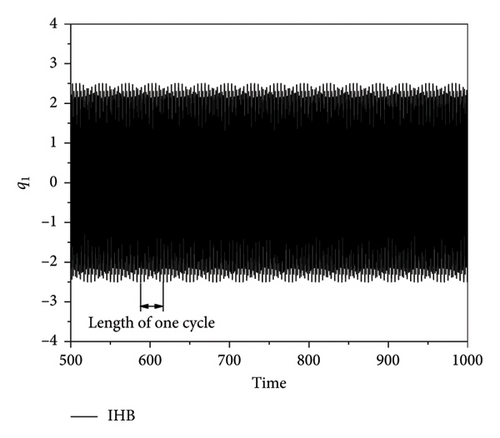
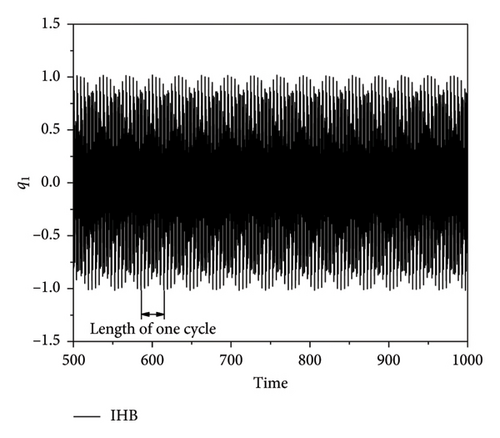
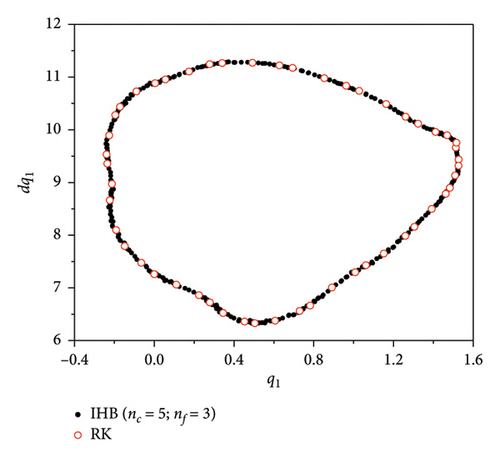
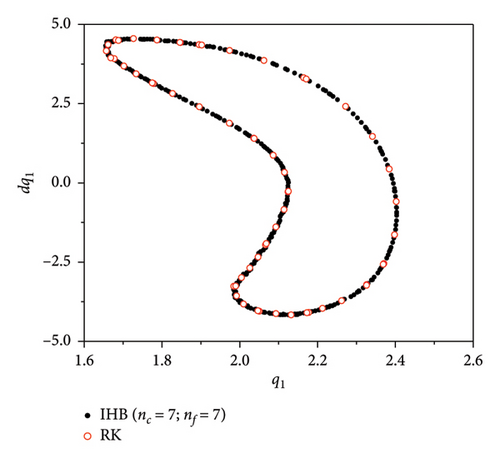
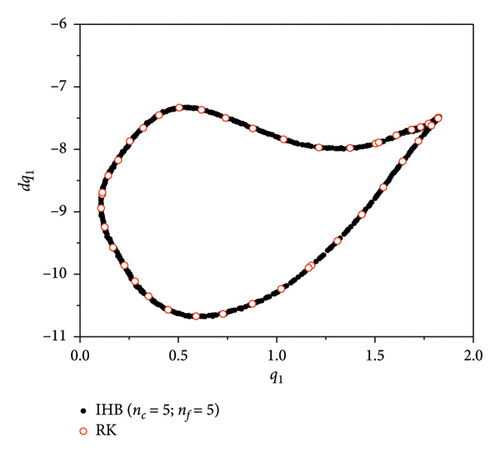
Observation of the time course diagrams of the quasi-periodic motion shows that the quasi-periodic envelope also appears to have a “period.” By calculating different frequencies in the H3H4 bifurcation section, ω, the quasi-periodic motion is presented. A shorter “period” envelope length of the quasi-periodic motion corresponds to a further position from the bifurcation point. The combination these results with the Poincaré cross sections (Figure 14) at different points in Table 3 shows that the closer the envelope is to the quasi-periodic bifurcation point, the larger the adjacent frequency interval, ωd, is in the side band, the wider the bandwidth of the side band is, and the sparser the frequency distribution is (the number of inter-frequency terms, nf is lower).
| Frequency, ω | Interval frequency, ωd | Periodicity, T | Number of basic frequency items, nc | Number of inter-frequency terms, nf |
|---|---|---|---|---|
| 4.10015 | 1.3228 | 47.619 | 5 | 3 |
| 4.14015 | 1.3129 | 31.2517 | 5 | 7 |
| 4.20015 | 1.3111 | 23.8095 | 7 | 7 |
| 4.26015 | 1.3212 | 33.6541 | 5 | 5 |
| 4.28015 | 1.3245 | 51.053 | 5 | 3 |
5. Conclusions
- 1.
The periodic response of a rolling plate during rolling contains two types of bifurcation: saddle-node bifurcation and Hopf bifurcation. The Saddle node bifurcation jumps from one periodic solution to another, while the Hopf bifurcation causes quasi-periodic motion, i.e., the system transitions from a change in the periodic response to a change in the quasi-periodic response.
- 2.
During rolling, the strip produces a quasi-periodic response due to internal resonance. In the quasi-periodic spectrograms, the vicinity of the fundamental frequency, nω, contains a side band, and the side band is homogeneous. The spacing, ωd, of the adjacent frequencies in the side band is constant; when the system experiences primary harmonic resonance, an even multiple of the fundamental frequency of the strip is excited.
- 3.
During the rolling process, the strip experiences a continuous energy exchange process between the strip modes due to internal resonance and the beat vibration phenomenon. Throughout the course of the quasi-periodic motion, the quasi-periodic envelope also has a “period,” and the closer the quasi-periodic motion response is to the Hopf bifurcation point, the larger the bandwidth of its sidebands is, the smaller the number of harmonic terms, nc and nf, obtained by the analytical solution is, and the longer the “period” is.
The two-timescale IHB method derived in this study is a seminumerical solution. A larger number of harmonic terms, nc and nf, lead to a better match with the periodic and quasi-periodic solutions obtained from the RK method (a numerical solution).
Disclosure
We confirm that no persons, who are not listed as authors or acknowledged in the manuscript, or third-party services (including AI software) were involved in the research or manuscript preparation. In addition, no such individuals or services contributed anonymously.
Conflicts of Interest
The authors declare no conflicts of interest.
Author Contributions
All authors agree to take responsibility for the content and conclusions of the manuscript. Wentao Zhou: writing – original draft, software, and formal analysis. Zeliang Liu: methodology and resources. Huijian Li: conceptualization. Chenglin Tao: writing – review and editing. Xin Zhou: writing – review and editing.
Funding
The research did not receive funding from any sources.
Open Research
Data Availability Statement
The data that support the findings of this study are available from the corresponding author upon reasonable request.


