Dynamic Analysis of Transmission Gears With Combined Tooth Wear and Root Crack Failures
Abstract
Compound faults present a considerable challenge in fault diagnosis for gear transmission systems, as existing studies predominantly focus on individual failure modes. To address this limitation, the present study proposes a novel dynamic response analysis model that simultaneously considers tooth profile wear and root crack faults. A numerical model for tooth profile wear is developed based on the Archard wear law, which allows for the calculation of wear progression over multiple operating cycles. The potential energy method is then employed to derive a time-varying mesh stiffness model, capturing the interactive effects of tooth wear and root cracks on system stiffness and dynamic behavior. A six-degree-of-freedom dynamic model of the gear transmission system is constructed using the lumped mass method, with time-varying mesh stiffness as an input. The dynamic response is solved using the fourth-order Runge–Kutta method to simulate the system under various levels of cracks and wear. Experimental validation confirms the model’s effectiveness in representing the complex dynamics of compound faults, demonstrating its superiority over traditional models that focus on single failure modes. This model provides an innovative theoretical framework and dynamic support for fault diagnosis in gear transmission systems subject to multiple failure modes.
1. Introduction
Transmission gears, as pivotal elements in contemporary industrial machinery, are extensively utilized across diverse sectors including rail transportation, wind energy generation, and computer numerical control (CNC) machining systems. Their prevalent implementation is primarily attributed to their exceptional power transmission efficiency, structural compactness, and operational reliability [1]. However, these mechanical components frequently operate under extreme conditions characterized by substantial load-bearing requirements and high-power transmission demands, which inevitably lead to performance deterioration and fatigue-induced damage [2]. Such detrimental effects significantly increase the probability of mechanical malfunctions, thereby compromising the operational safety and system reliability. In severe cases, gear failures may precipitate critical operational disruptions, resulting in substantial economic losses, resource wastage, and potential safety incidents. Therefore, comprehensive research into the failure mechanisms of transmission gears is essential for risk mitigation and the maintenance of operational integrity in industrial systems.
Profile wear in gear systems exhibits multidimensional dynamic coupling characteristics that significantly impact operational performance. Research indicates that tooth surface wear not only induces contact pattern distortion and load distribution anomalies but also substantially deteriorates energy transmission efficiency and Noise, Vibration and Harshness (NVH) characteristics. Crucially, the dynamic evolution of surface topography parameters establishes a complex time-varying wear feedback mechanism through modifications in comprehensive curvature radius and contact stress distribution. The advancement of numerical simulation technology has provided a novel methodological framework for tribological analysis in gear systems. To address the multiphysics coupling nature of wear mechanisms, various theoretical models have been developed, among which the mathematical framework combining Hertz contact theory with Archard’s adhesive wear theory has gained predominant acceptance due to its universality [3]. However, it should be noted that traditional Archard models under static load assumptions demonstrate significant limitations in engineering applications, as they fail to comprehensively consider the influence of dynamic operational parameter fluctuations on contact conditions, resulting in constrained prediction accuracy. To overcome this theoretical barrier, researchers have extended the Archard model to mixed elastohydrodynamic lubrication analysis, systematically investigating the wear evolution mechanisms under coupled effects of surface roughness, geometric parameters, and operational conditions [4]. In model optimization, Park, Kolivand, and Kahraman. [5] proposed an improved Archard model incorporating interpolation algorithms for hypoid gears, significantly enhancing computational efficiency for relative sliding distance, contact pressure, and total wear quantification. Janakiraman, Li, and Kahraman [6] established a regression model for wear coefficients considering load and velocity variables through parametric sensitivity analysis, while Brandão et al. [7] experimentally validated the nonlinear influence mechanisms of load parameters and oil film thickness on wear coefficients. These theoretical innovations have markedly improved the engineering applicability and predictive accuracy of wear models. In dynamic coupling analysis, Walker et al. [8] developed a multiscale simulation model integrating multibody dynamics with tribology, achieving synergistic analysis of transient wear evolution and NVH performance degradation in helical gears. Cao et al. [9] proposed a dynamic modeling approach for coupled crack-wear failure mechanisms, revealing synergistic effects on system dynamic responses in spur gears. Abdallah and Sassi [10] established a dynamic prediction model for cracked gearboxes under lubrication deterioration by integrating Hertzian contact deformation with friction vibration theory. Sánchez, Pleguezuelos, and Pedrero [11] quantitatively analyzed the influence of tooth wear on transmission error spectrum characteristics from the perspective of time-varying mesh stiffness (TVMS) and load sharing, subsequently proposing dynamic load optimization strategies based on profile modification. These studies underscore the critical importance of investigating tooth profile wear. However, a significant gap persists in comprehensively examining the effects of wear on the dynamic characteristics of gear systems. This gap is largely due to the challenges in quantifying the intricate relationship between wear and the dynamic response of gears, including changes in vibration, noise, and meshing stiffness. Additionally, constructing dynamic models that accurately account for wear-induced changes remains a formidable challenge. Future research is essential to elucidate the effects of wear on the dynamic behavior of gear systems and to develop advanced predictive models for assessing gear performance under varying wear conditions.
Research on tooth root crack propagation mechanisms and their impact on gear system dynamics constitutes a pivotal domain in mechanical engineering. The computation of TVMS primarily relies on three methodological frameworks: Ishikawa’s method, finite element analysis, and potential energy method. Notably, the potential energy method, based on variable cross-section cantilever beam assumptions, has emerged as the predominant approach for stiffness calculation starting from the root circle due to its modeling efficiency. Ma et al. [12] established a tripartite theoretical framework through systematic review: (1) crack propagation path prediction, (2) TVMS precision computation, and (3) vibration response characterization, with particular emphasis on dynamic coupling phenomena in cracked gear-rotor systems. It is noteworthy that their subsequent investigation [13] critically examined the inherent limitations of conventional TVMS calculation models in double helical gear applications, revealing critical modeling deficiencies arising from inadequate consideration of groove structure parameters in classical analytical approaches. Li, Li, and Zhang [14] conducted accelerated life testing focusing on gear bending fatigue, providing a comprehensive analysis of the initiation, propagation, and fracture surface characteristics of tooth root cracks. Their work established a solid experimental foundation for investigating the impact of cracks on mesh stiffness and dynamic responses. Liu et al. [15] developed a parametric model for cracked spur gears, simplifying the crack propagation path for analytical purposes. Through contact analysis, they calculated the TVMS and transmission error of cracked gear pairs, validating their findings with finite element analysis. Similarly, Chen and Shao [16, 17] examined the effects of crack propagation along both the tooth width and depth on mesh stiffness. Their studies also investigated how factors such as tooth profile modifications, applied torque, and root cracks affect meshing stiffness, load distribution, and static transmission error. Ning et al. [18] introduced an enhanced stiffness analysis method for spur gears with root cracks, incorporating the structural coupling effects due to gear body flexibility to improve the accuracy of TVMS calculations. Despite the significant advancements made in understanding the influence of tooth root cracks on gear stiffness and dynamic behavior, several limitations remain. Notably, the computational complexity of existing models and the considerable resources required for accurate simulations pose substantial challenges. Moreover, a critical gap exists in addressing the interaction between wear and cracks under compound failure modes. The concurrent occurrence of wear and cracks results in complex dynamic interactions that are not yet fully understood. Bridging this gap is crucial for gaining a more comprehensive understanding of gear performance under combined failure conditions [19, 20].
Theoretical models for wear and crack calculations have reached a mature stage; however, a significant gap remains in quantitatively analyzing their effects on the dynamic response of gears. To address this gap, the present paper introduces a dynamic response analysis model for gear transmission systems that simultaneously considers both tooth profile wear and tooth root crack failures. While considerable research has focused on the dynamic behavior of gear transmission systems under single-fault conditions, studies exploring compound failures involving multiple fault modes remain limited. This work fills this gap by proposing a novel model that accounts for the combined effects of tooth profile wear and root crack faults. The proposed model provides a comprehensive framework for analyzing TVMS and the dynamic behavior of gear systems under compound fault conditions. By incorporating these complex interactions, this study offers valuable insights into the intricate dynamics of gear transmission systems, marking a significant advancement in fault diagnosis and condition monitoring.
The contributions of this study can be summarized as follows: (1) Innovative modeling: This paper introduces a novel dynamic response analysis model that concurrently accounts for both tooth profile wear and root crack failures—an integration that is rarely explored in existing literature. While prior research typically examines these failure modes in isolation, this study combines their effects, providing a more accurate representation of the performance of real-world gear transmission systems. (2) Compound failure model: A new compound failure model is proposed, which comprehensively characterizes the dynamic response of gears under complex operating conditions, particularly when tooth profile wear and root cracks co-occur. This model addresses a critical gap in current research by capturing the combined influence of these failure modes.
The remainder of the paper is organized as follows: Section 2 develops the model for TVMS. Section 3 presents the compound fault model. Section 4 explores the effects of tooth profile wear, root cracks, and compound faults on TVMS. Section 5 establishes a dynamic model of gear systems and analyzes the impact of various faults on their dynamic characteristics, with experimental validation. Finally, Section 6 summarizes the findings and presents the conclusions.
2. TVMS Model
Mesh stiffness quantifies the deformation of a gear under external forces, which is influenced by factors such as gear geometry, material properties, and the clearance between meshing gears. As a critical parameter, mesh stiffness plays a pivotal role in shaping the dynamic behavior of gear transmission systems. The structural characteristics of these systems lead to cyclic variations in mesh stiffness, arising from the alternation between single-tooth and double-tooth engagements along the line of action. These fluctuations directly impact the system’s resonance frequency, thereby affecting its stability. Therefore, a comprehensive analysis of TVMS is crucial for understanding the dynamic characteristics and failure mechanisms of gear transmission systems [21, 22].
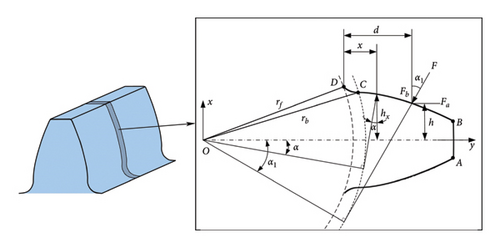
3. Compound Failure Modeling
3.1. Tooth Profile Wear Model
The time point designated as tA1 represents the commencement of the meshing cycle, while the time point designated as tA2 represents the conclusion of the meshing cycle.
3.2. Tooth Root Crack Model
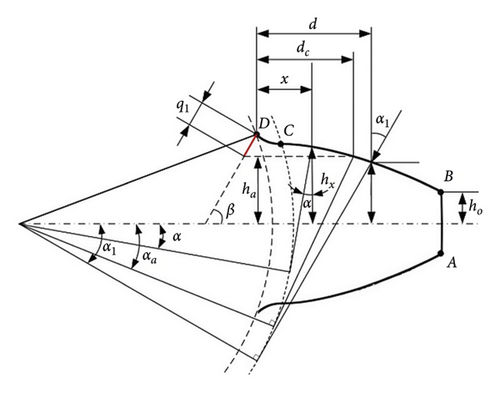
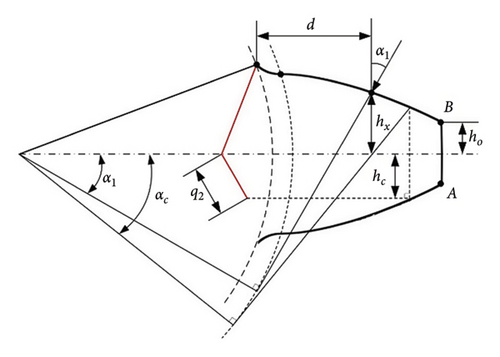
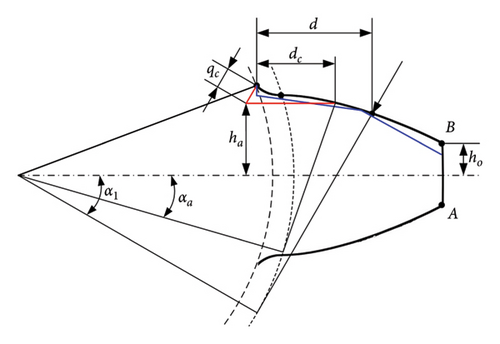
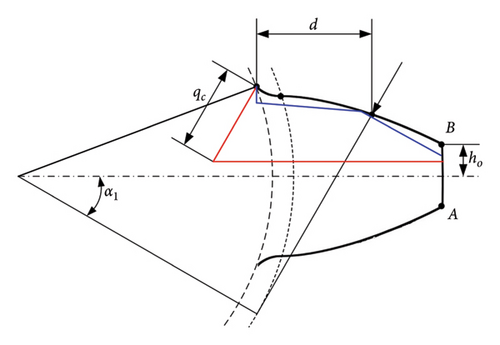
The method for calculating the TVMS of gears with root cracks is well developed, and many improvements have been made to the potential energy method [29, 30]. It is assumed that the crack occurs at the root of the tooth and runs through the entire width of the tooth. The profile of the crack is shown in Figure 2. Figure 2(a) represents the initial crack length when the crack does not exceed the symmetry center line of the gear tooth. Figure 2(b) shows the profile of the crack when it extends beyond the symmetry center line of the gear tooth. In the figure, q1 represents the initial crack length; q2 denotes the length of the crack that extends beyond the center of symmetry of the gear tooth following expansion; β is the angle between the crack and the center of symmetry of the gear tooth; ha is the distance from the tip of the crack to the center of symmetry of the gear tooth; ho denotes the half-width of the tooth apex; ax represents the pressure angle at any point on the tooth surface; dc signifies the distance from the plane of the tip of the crack and the intersection line of the tooth contour to the root circle of the gear tooth.
- 1.
ha ≥ ho and α1 > αa
() - 2.
ha < ho or ha ≥ ho, α1 ≤ αa
() -
In this case (1) and (2), ha = rfsinα2 − q1sin β.
- 3.
hc ≥ ho and α1 > αc
() - 4.
hc < ho or hc ≥ ho, α1 ≤ αc
() -
In this case (3) and (4), hc = q2sin β.
3.3. Compound Failure Model
-
Model 1: The change in cross-sectional area and moment of inertia resulting from a tooth root crack is primarily considered when x ≤ dc, while the effect of tooth profile wear is predominantly taken into account when x > dc. Consequently, the cross-sectional area and moment of inertia can be expressed as follows:
() -
Model 2: Given the considerable extent of tooth apex and root wear, the occurrence of root crack damage encompassing the tooth profile wear region suggests that the root crack projection in the vertical direction has surpassed the tooth apex, that is, hx < ho. Consequently, the cross-sectional area and moment of inertia are as follows:
()
The TVMS of the gearing system under compound failure can be obtained by substituting the aforementioned two cases into the TVMS model.
4. Analysis of the Effect of Compound Failure on TVMS
4.1. Calculation of Tooth Profile Wear and Impact Analysis
In this paper, the degree of wear is calculated for varying numbers of cycles, and the parameters of the gear system are presented in Table 1.
| Parameters | Unit | Driving gear | Driven gear |
|---|---|---|---|
| Number of teeth | — | 55 | 75 |
| Module | mm | 2 | 2 |
| Pressure angle | (°) | 20 | 20 |
| Tooth width | mm | 70 | 70 |
| Poisson’s ratio | — | 0.3 | 0.3 |
| Support stiffness | N/m | 5 × 10⁵ | 5 × 10⁵ |
| Support damping | Ns/m | 1.25 × 10⁵ | 1.25 × 10⁵ |
| Rotational speed | r/min | 500 | 367 |
According to the Archard wear model, tooth profile wear is calculated as shown in Figure 4. Under identical contact conditions, the driving gear experiences significantly more frequent meshing engagements than the driven gear, leading to more pronounced wear on the driving gear. Consequently, Figure 4 depicts only the wear depth of the driving gear.
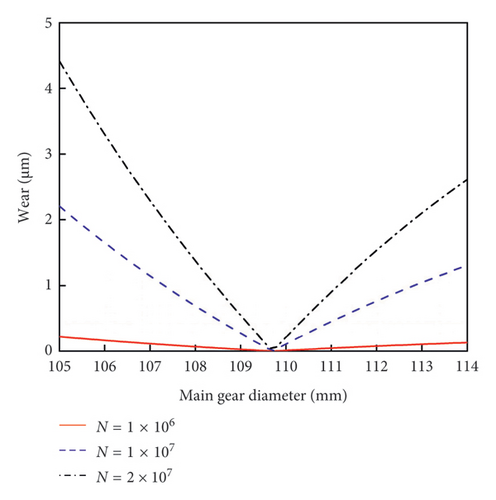
As shown in Figure 4, wear is most severe at the crown and root of the tooth, resulting in a V-shaped wear distribution along the tooth profile. This distribution is characterized by an initial decrease in wear depth, followed by an increase. Near the pitch circle, wear depth is minimal due to the reduced sliding distance at this location. At the pitch circle, the relative motion between the two gears approaches pure rolling, resulting in a negligible sliding distance and, consequently, minimal wear. As the number of meshing cycles increases, wear depth progressively increases, leading to more significant wear over extended service periods.
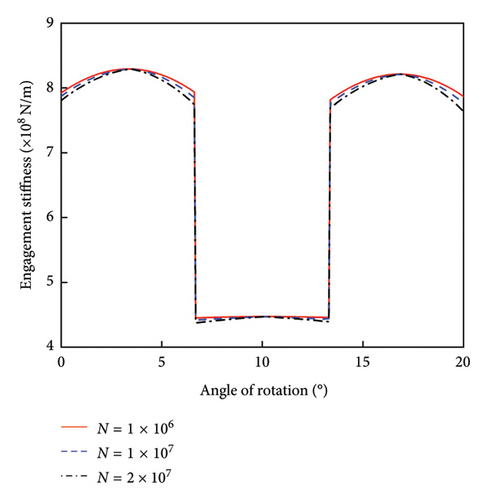
Figure 5 illustrates the impact of tooth profile wear on the TVMS. As wear progresses, the TVMS gradually decreases. Initially, the change in stiffness is minor; however, as the wear deepens, the reduction in stiffness becomes more significant. Tooth profile wear alters the tooth geometry, decreasing the effective cross-sectional area and the moment of inertia at the meshing points. Additionally, the increasing number of meshing cycles accelerates the wear process, ultimately leading to substantial changes in the system’s dynamic behavior over time.
4.2. Impact Analysis of Root Cracks
To evaluate the influence of crack length and angle, three distinct crack cases were examined: (1) a fixed crack angle of 45° with varying lengths of q1 (0.5, 1.0, 1.5, and 2.0 mm); (2) a fixed crack angle of 45° with varying lengths of q2 (0.5, 1.0, and 2.0 mm); (3) a fixed crack length of 0.5 mm with varying crack angles (20°, 30°, 45°, 60°, and 75°). The results of the analysis are presented in Figure 6.

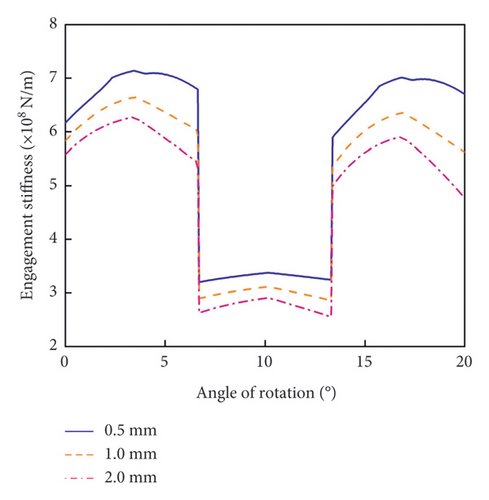
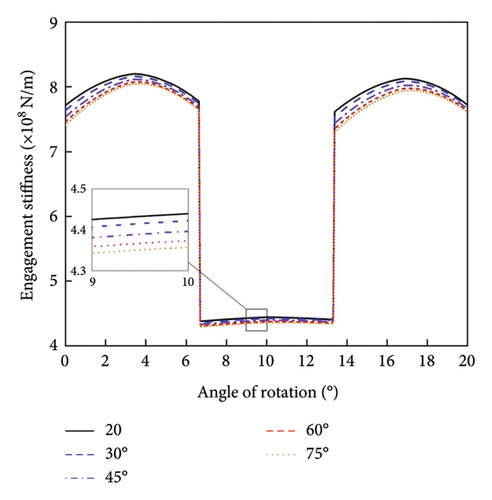
Figure 6 illustrates the TVMS for a crack length of 0.0 mm, representing the stiffness of a normal, crack-free gear. The results indicate that the meshing stiffness of the gear train decreases as cracks develop. As the crack length increases, a corresponding reduction in meshing stiffness occurs. For small crack lengths, the decrease in stiffness is gradual and minimal; however, as the crack length grows, the reduction in stiffness becomes more pronounced and exhibits larger fluctuations, particularly when the crack length exceeds 2.0 mm.
Once the crack extends beyond the symmetry centerline of the gear tooth, the meshing stiffness experiences a significant reduction. This is due to the decrease in the effective cross-sectional area and moment of inertia of the gear tooth once the crack crosses the centerline, which increases the likelihood of further fracture and impedes normal engagement.
As shown in Figure 6(c), an increase in the angle between the crack and the symmetry centerline results in a further decrease in meshing stiffness. This is primarily because, for a given crack length, a larger angle leads to a more substantial reduction in the effective cross-sectional area. However, compared to crack length, the effect of the crack angle on meshing stiffness is relatively minor.
4.3. Impact Analysis of Compound Failure
Wear quantities of 1 × 10⁶ and 1 × 10⁷, as well as tooth root cracks of 1.0, 1.5, and 2.0 mm in length, were selected for the TVMS analysis under compound failure. The results are presented in Figure 7.
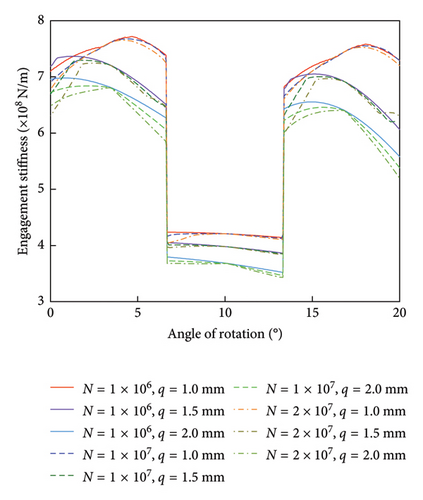
As shown in Figure 7, the TVMS of the gear train decreases under both failure modes: tooth profile wear and tooth root cracks. However, tooth root cracks exert a more pronounced influence on meshing stiffness within the context of the compound failure model, suggesting that this failure mechanism predominates. The two-tooth meshing zone is more significantly affected than the single-tooth meshing zone, consistent with the trends observed in single failure modes, thereby validating the accuracy of the compound failure model.
When compared to the time-varying stiffness analysis under single failure modes, the changes in engagement stiffness under compound failure conditions are more complex. Nevertheless, it is evident that engagement stiffness in compound failure scenarios is lower than that observed under single failure modes. In the absence of tooth profile wear, notable fluctuations in engagement stiffness occur only when the crack length reaches 1.5 mm. However, when tooth profile wear is incorporated into the compound failure model, significant fluctuations are evident even at a crack length of 1.0 mm. As the number of meshing cycles and crack length increases, fluctuations in meshing stiffness become more pronounced, potentially leading to severe issues such as meshing shock and vibration noise within the gear transmission system.
5. Dynamic Response Analysis of Compound Failure Gears
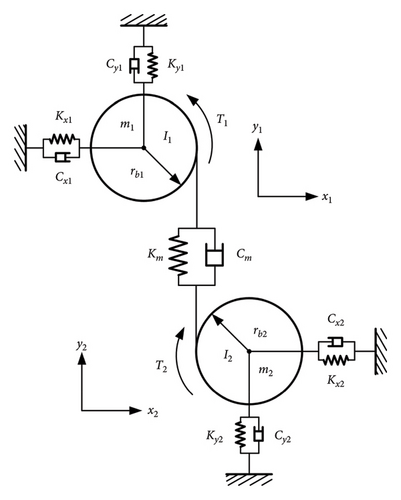
5.1. Dynamic Modeling of Gear System
5.2. Analysis of Dynamic Response Results
The rotational frequency of the driving wheel is 8.3 Hz, the rotational frequency of the driven wheel is 6.1 Hz, the meshing frequency is 458.3 Hz, and the meshing period is 0.00218 s. The dynamic equations of the gearing system are solved using the fourth-order Runge–Kutta method, and the resulting kinetic response in the y-direction is analyzed. The kinetic response of the normal gear is shown in Figure 9.
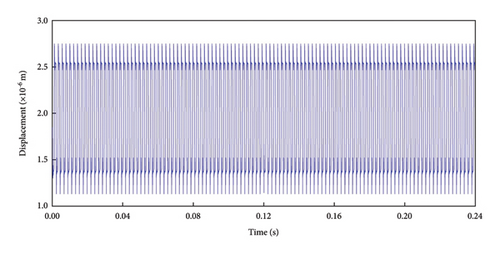
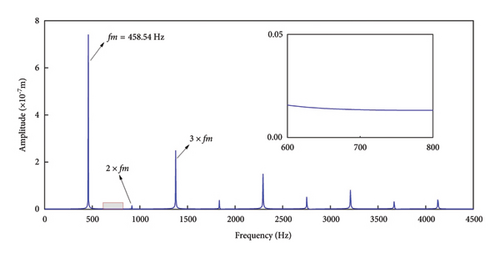
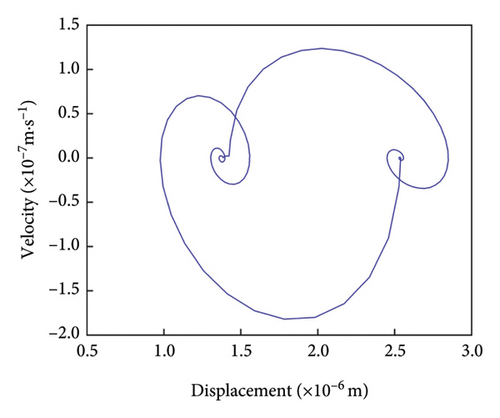
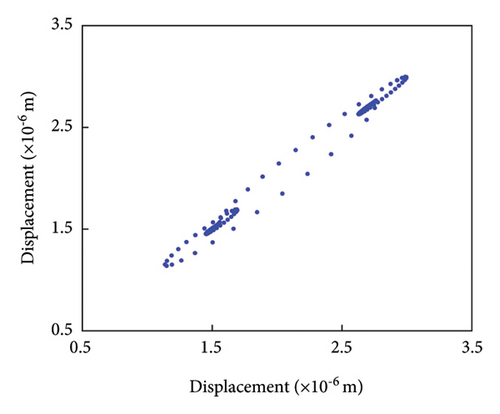
Figure 9(a) illustrates that the vibration displacement of the normal gear follows a cyclic pattern, indicating smooth meshing, with fluctuations ranging from 1.20 × 10⁻⁶ to 2.75 × 10⁻⁶ m. The frequency domain plot in Figure 9(b) predominantly highlights the meshing frequency and its harmonics, with odd-numbered harmonics being more prominent and even-numbered harmonics appearing comparatively weaker. This phenomenon can be attributed to factors such as the number of gear teeth, the dynamic characteristics of the transmission system, nonlinear effects, and dynamic loading. The meshing frequency of 458.54 Hz closely matches the calculated value of 458.3 Hz, indicating that the gear drive system operates as expected, with no significant frequency deviations among the harmonics. The phase trajectory in Figure 9(c) is relatively regular, with multiple meshing cycles exhibiting identical phase trajectories, further confirming the smooth meshing behavior of the gear system. In the Poincaré diagram as shown in Figure 9(d), all discrete points are concentrated within a small region, further supporting the conclusion that the gearing system operates stably and reliably, with no indications of failure.
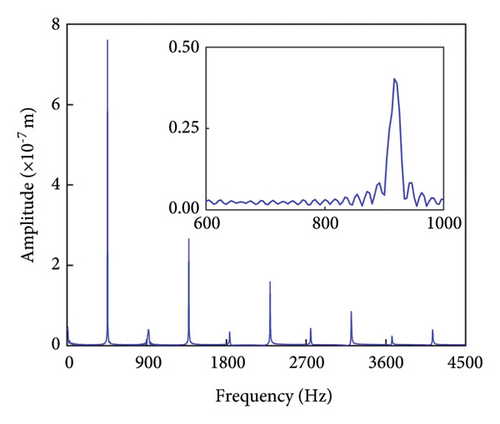
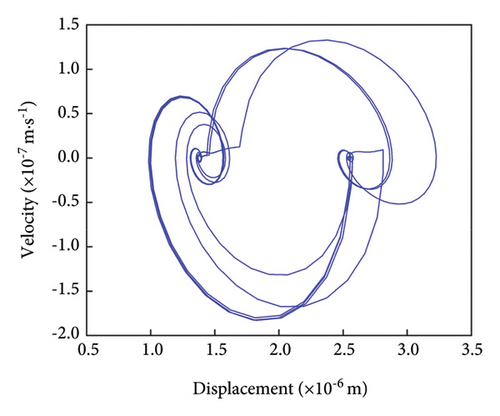
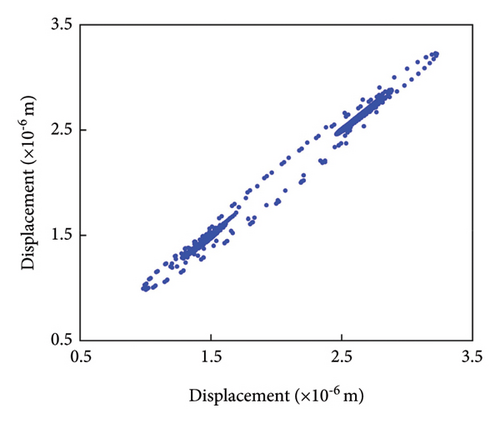
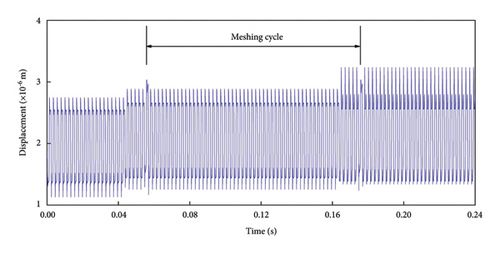
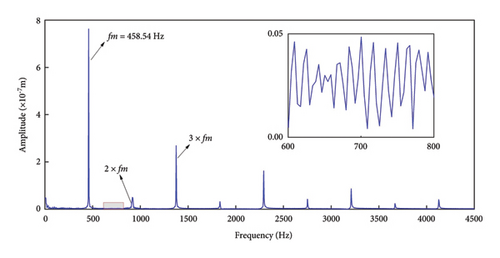
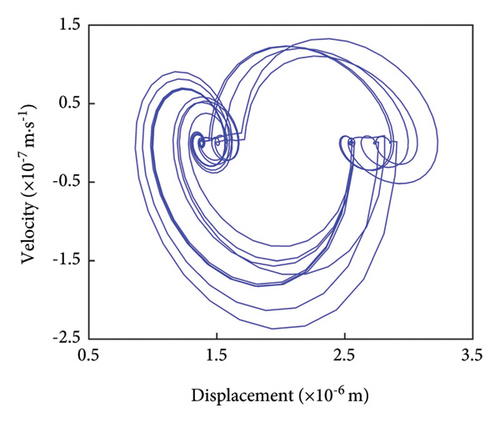
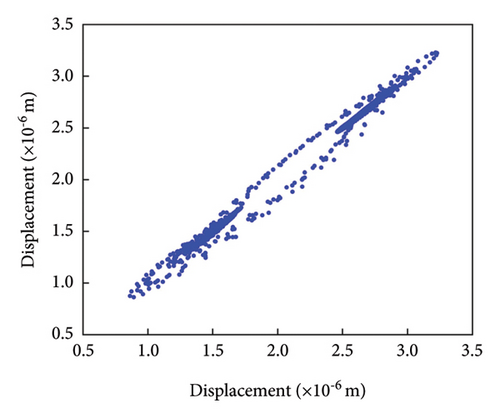
The TVMS for root cracks, tooth profile wear, and compound failure modes is integrated into the dynamic model, and the dynamic response of the gear under these failure conditions is analyzed. Figure 10 presents the dynamic response under crack failures, with time-domain, frequency-domain, phase, and Poincaré diagrams provided in sequence for each crack length. Figures 11 and 12 display the dynamic response under varying degrees of profile wear and compound failures, respectively.


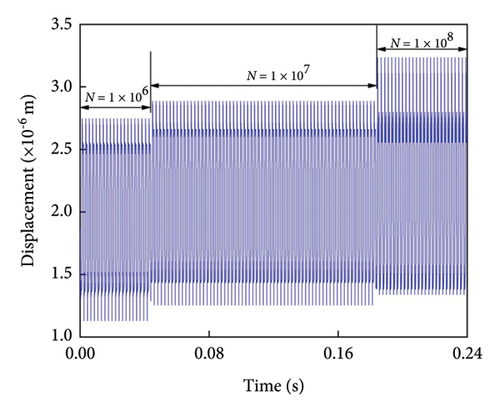
As shown in Figure 10(a), the time-domain plot reveals a significant change in the gear’s vibration displacement following the initiation of cracks, with the displacement gradually increasing as the cracks progress. This increase, ranging from 1.10 × 10⁻⁶ to 3.00 × 10⁻⁶ m, marks a clear deviation from the vibration displacement range observed in normal gears, indicating that root cracks contribute to an unstable vibration response and amplify meshing shocks. To effectively highlight the impact of cracks on vibration displacement, the figure depicts only a single root crack per meshing cycle.
A comparison of the frequency domain diagrams for normal and cracked gears shows that, while the meshing frequency and octave characteristics remain unchanged, additional stray frequencies appear between the meshing frequency and its harmonics. Moreover, the amplitude of these stray frequencies increases as the crack extends, potentially affecting the accuracy of fault diagnosis once the crack reaches a certain size. The phase diagram comparison reveals that, as the crack grows, the width of the phase trajectory gradually increases and crosses the x-axis. This indicates that longer cracks result in more frequent phase trajectory crossings, suggesting that larger cracks cause more pronounced vibrations within the gear train.
The Poincaré diagram further illustrates that the range of aggregated discrete points gradually expands as the crack progresses. These findings underscore the significant impact of tooth root cracks on the dynamic response of the gear train, weakening the structural integrity of the gears, reducing their load-carrying capacity, and lowering meshing stiffness. Collectively, these effects lead to increased vibrations. Under high-speed or high-load conditions, these cracks can concentrate dynamic loads, elevating vibration and stress levels within the system. Additionally, tooth root cracks may induce resonance at specific frequencies, further amplifying vibrations and stresses within the gear train. Operating near resonant frequencies can severely compromise system reliability.
The vibration displacement gradually increased as the number of gear engagements rose. At 1 × 10⁶ engagements, the vibration displacement ranged between 1.10 × 10⁻⁶ and 2.75 × 10⁻⁶ m. When the engagement count reached 1 × 10⁷, this range extended to 1.30 × 10⁻⁶ and 2.91 × 10⁻⁶ m. After 1 × 10⁸ engagements, the displacement range further increased to 1.37 × 10⁻⁶ and 3.25 × 10⁻⁶ m. As shown in Figure 11(b), the frequency domain plot reveals a pattern similar to that observed in normal gears. Specifically, the meshing eigenfrequencies and odd-numbered harmonics dominate the response under tooth profile wear, while even-numbered harmonics remain relatively minor. Tooth profile wear generates stray frequencies between the characteristic frequencies, with the magnitude of these stray frequencies directly correlated to the severity of the wear.
Figure 11(c) shows that tooth profile wear causes the phase trajectory to widen and cross, indicating an increase in vibration amplitude. This amplitude is directly proportional to the degree of wear. Additionally, Figure 11(d) demonstrates that tooth profile wear introduces some dispersion in the Poincaré diagram’s discrete points, although this is less pronounced than in the case of root cracks.
Tooth profile wear alters the geometry of the gear tooth flanks, reducing the effective meshing area. This leads to uneven load distribution and increased contact stress between the flanks, potentially causing localized load concentration. Such uneven load distribution affects the dynamic response of the gear system, resulting in increased overall vibration. Furthermore, wear modifies the tooth side clearance and meshing angle, impacting gear transmission accuracy and performance, thereby contributing to system vibration. Additionally, wear increases tooth roughness, which alters the friction characteristics between gears. This can result in higher energy losses within the gear train and cause localized stress concentrations, leading to further wear and exacerbating the dynamic response. Therefore, careful attention must be given to gear wear in the design and operation of gear systems, and appropriate measures should be implemented to mitigate its adverse effects on system dynamics.
As shown in Figure 12(a), the time-domain diagram indicates that when both tooth profile wear and root cracks are present in the gear, the vibration displacement response exhibits irregular characteristics with significant fluctuations. As the severity of either wear or cracks increases, these fluctuations become more pronounced, suggesting that compound failure modes are more difficult to assess, diagnose, and predict reliably compared to single failure modes. In Figure 12(b), the frequency domain analysis reveals that the meshing eigenfrequency is the dominant response under compound failure conditions. Additionally, harmonics such as 2 × fm, 3 × fm, and 4 × fm are observed, with the odd-numbered harmonics being particularly pronounced. Compound failure introduces spurious frequencies between the eigenfrequencies. As the severity of the fault increases, the clutter frequency intensifies and exhibits greater fluctuations. Notably, the meshing eigenfrequency is determined solely by the number of teeth and the rotational speed and is independent of the specific types of faults or compound failures present in the gears. Since the number of teeth remains constant, the meshing eigenfrequency and its harmonics will only change if the rotational speed varies. Comparing Figure 12(c) with the phase diagrams of normal, worn, and cracked gears shows that the phase trajectories under compound failure are wider, with more crossover points and increased chaos. This indicates that phase error in the transmission system under compound failure is greater, and the associated vibration characteristics are more pronounced. As shown in Figure 12(d), the Poincaré diagram further supports these observations, with the points under compound failure being more dispersed and occupying a broader area.
These findings suggest that the impact of compound failure on the gear transmission system is not simply the superposition of the effects of tooth profile wear and root cracks. Instead, it represents a more complex interaction between these two failure mechanisms. The compound failure model proposed in this study provides a more accurate framework for characterizing the interactions between wear and crack characteristics, as well as their combined influence on TVMS and the dynamic response of the system.
5.3. Experimental Analysis and Validation
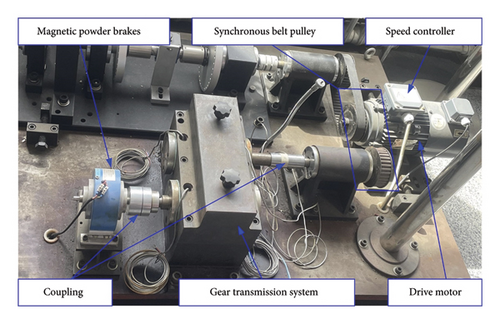
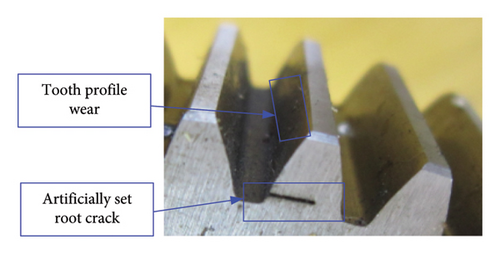
The test bench used is shown in Figure 13. The compoumd failure gear is shown in Figure 14, where the root cracks are artificially predetermined because the naturally occurring cracks are not controllable, and the profile wear is also considered only for the wear state of the teeth with cracks. The number of teeth is 55 and 75, respectively. The gear with 55 teeth is the faulty gear, which contains a 1.5 mm crack fault and exhibits wear. The number of meshing cycles is approximately 1 × 10⁷. The meshing frequency is 458.3 Hz, and the meshing period is 0.00218 s. The test results are shown in Figure 15.
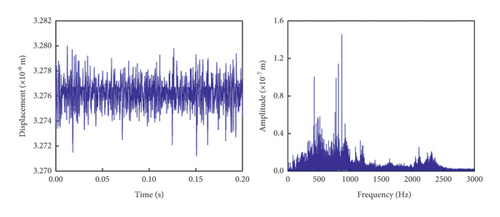
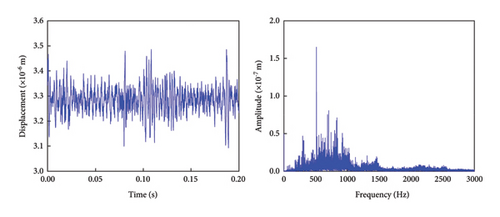
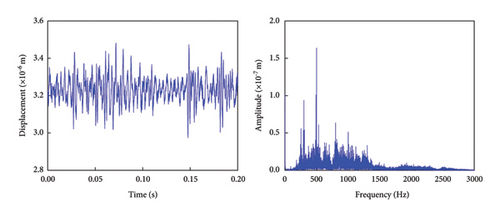

From the time-domain graphs of the transmission gears under various conditions as shown in Figure 15, it can be observed that the vibration displacement of fault-free, normal gears fluctuates minimally, remaining consistently around 3.2762 × 10⁻⁶ m. However, after a crack or wear develops, the vibration displacement range increases, with the cracked gears exhibiting higher displacement than the worn gears. When a compound fault occurs, the vibration displacement further increases, and the fluctuations become more irregular. In the frequency-domain graph, it is evident that after a fault occurs in the transmission gear, the amplitude of the characteristic frequency increases, though the characteristic frequency itself does not deviate significantly. This is because the characteristic frequency of the transmission gear is primarily influenced by factors such as the number of teeth, rotational speed, and load.
Comparing the experimental results with those from the theoretical model, it is clear that the effects of coexisting failures on the time-domain and frequency-domain characteristics of the transmission gear are consistent with the theoretical predictions. The characteristic frequency calculated by the theoretical model is 458.54 Hz, while the characteristic frequency obtained from the experimental test is 462.6 Hz, resulting in a relative error of approximately 0.88%. This confirms the accuracy of the theoretical model and validates the effectiveness of the proposed gear dynamic feature analysis model under coexisting failure conditions.
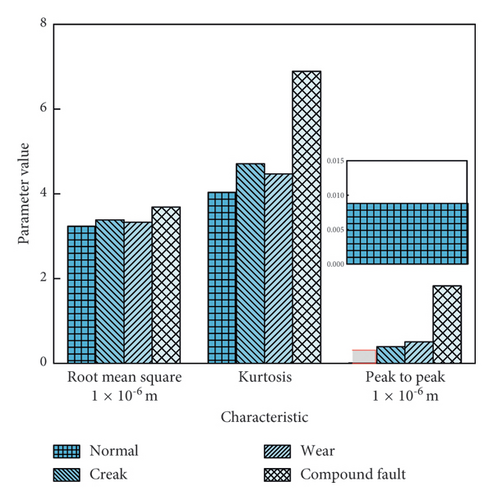
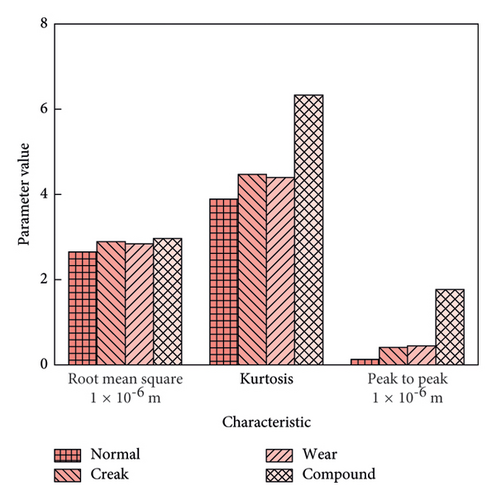
The root mean square (RMS), kurtosis, and peak-to-peak values of the experimental test data were extracted, with the results shown in Figure 16, and the characteristic values are summarized in Table 2. It can be observed that, regardless of the fault type, the RMS, kurtosis, and peak-to-peak values of the transmission gears all increase. For individual failure modes, root cracks have a more significant impact on the RMS and peak-to-peak values than tooth flank wear. This indicates that root cracks contribute more to vibration impacts and are more likely to cause internal shocks, while their effect on kurtosis is smaller compared to tooth flank wear. Under compound fault conditions, all three characteristic values of vibration displacement show a significant increase. Among them, kurtosis exhibits the greatest rise, suggesting a higher likelihood of sudden failures. The peak-to-peak value shows the second-largest increase, while the RMS shows the smallest increase. These results suggest that during compound faults, the vibration displacement of the transmission gear increases, leading to greater internal excitation and an elevated risk of sudden failure. Furthermore, the characteristic values obtained from the simulation results with identical parameters are shown in Figure 17. It can be observed that most of the characteristic values from the simulation are smaller than those from the experimental results. The primary reason for this discrepancy is that the simulation results are overly idealized, without accounting for the various uncertainties present during the experimental testing. Notably, the peak-to-peak values of the normal and cracked gears in the simulation are higher than those observed in the experimental tests, which may be due to the data noise reduction process, which could have diminished the peak-to-peak deviations. Overall, the general trend of the experimental results aligns well with the simulation results, validating the accuracy and effectiveness of the proposed method.
| Parameters | Unit | Normal | Cracked | Worn | Compound | ||||
|---|---|---|---|---|---|---|---|---|---|
| RMS | 1 × 10⁻⁶ m | 2.65 | 3.2362 | 2.89 | 3.3865 | 2.84 | 3.3323 | 2.97 | 3.6890 |
| Kurtosis | — | 3.89 | 4.0372 | 4.47 | 4.7114 | 4.4 | 4.4699 | 6.33 | 6.8906 |
| Peak to peak | 1 × 10⁻⁶ m | 0.13 | 0.0088 | 0.41 | 0.3935 | 0.45 | 0.5068 | 1.77 | 1.8281 |
6. Conclusion
This paper presents a dynamic response analysis model for transmission gears under compound failure conditions, which is validated through experimental testing. The model, derived using the potential energy method, calculates TVMS by incorporating both tooth profile wear and root cracks. The analysis demonstrates that as crack length and angle increase, the meshing stiffness of the gear system decreases. Particularly, when the crack extends beyond the symmetric centerline of the gear, fluctuations in stiffness are more pronounced.
Utilizing Archard’s wear model, the paper calculates wear depth and corresponding meshing stiffness over different wear cycles (1 × 10⁷, 2 × 10⁷, and 3 × 10⁷ cycles). The results show that wear is most severe at the tooth tip and root, with the wear depth following a “V” shape along the tooth height. Wear near the pitch point is minimal, and the wear intensity increases with the number of meshing cycles. However, the impact of tooth profile wear on meshing stiffness is less significant compared to root cracks.
In the compound failure mode, the TVMS exhibits greater complexity and is generally lower than in the single failure mode. Dynamic responses were calculated using the Runge–Kutta method, showing that vibration displacement ranges from 1.26 × 10⁻⁶ to 2.75 × 10⁻⁶ m under normal conditions. As root cracks and tooth profile wear develop, the vibration displacement range widens, indicating an increase in vibration amplitude. Additional characteristics include the emergence of sideband frequencies, widening and crossing of phase trajectories, and increased dispersion in Poincaré diagrams. These features become more pronounced as the severity of either failure mode increases, with wider phase trajectories, more frequent crossings, and greater scatter in Poincaré sections under compound failure conditions.
The proposed dynamic model enhances the realism of dynamic characteristic analysis for transmission gears, offering valuable insights for fault diagnosis, reliability analysis, and life prediction of gear transmission systems. It underscores the complex interactions between wear and crack failures and their cumulative effect on gear system dynamics, providing a robust framework for further research in gear health monitoring and predictive maintenance.
Ethics Statement
This study did not involve human participants or animals, and no ethical approval was required. All research procedures adhered to relevant ethical guidelines and best practices for nonhuman and nonanimal research.
Consent
The authors consent to the publication of this manuscript.
Conflicts of Interest
The authors declare no conflicts of interest.
Funding
This research was funded by the Liaoning Provincial Department of Education Scientific and Technology Innovation Characteristic Project (Project No. JYTMS20230002).
Acknowledgments
The authors gratefully thank the author’s respective institutions for their strong support in this study.
Open Research
Data Availability Statement
The data that support the findings of this study are available on request from the corresponding author. The data are not publicly available due to privacy or ethical restrictions.


