Experimental Investigation of Dynamic Contact Stiffness and Damping in Mixed Lubrication for Machine Tool Sliding Guide Interfaces
Abstract
This paper presents an experimental study on the dynamic contact stiffness and damping characteristics of hybrid lubricated mechanical motion joint surfaces formed by machine tool sliding guides. A stiffness and damping parameter testing system was established, utilizing an m + p dynamic signal acquisition and analysis system as its centerpiece. In addition, an experimental platform for the static/dynamic basic characteristics of mechanical hybrid lubricated motion joint surfaces was designed and developed. Utilizing the experimental platform, the investigation has delineated the substantial influence exerted by critical parameters, including the preload between mating surfaces, lubricating oil viscosity, amplitude of the excitation force, and the operational velocity of the mating surfaces, on the fundamental characteristic parameters of the interface across diverse operational scenarios. The findings of the research substantiate that meticulous regulation of these parameters is instrumental in augmenting the static and dynamic contact stiffness, as well as the damping properties of the mating surfaces. Consequently, these empirical studies pertaining to the contact characteristic parameters of mating surfaces furnish essential data support for the comprehensive analysis and optimization of both the static and dynamic performance metrics of precision feed systems within machine tool applications.
1. Introduction
High-grade CNC machine tools serve as the foundation of a nation’s equipment manufacturing industry and are crucial indicators of a nation’s overall strength and defense capabilities. The contact characteristics of machine tool joint surfaces have been a focal point of research in the field of mechanical engineering both domestically and internationally, with enhancing the overall characteristics of machine tools being of paramount importance. Research indicates that joint surfaces formed by the mutual contact between components determine the stiffness and damping of the entire machine tool, with the contact stiffness of joint surfaces accounting for approximately 60% to 80% of the total machine tool stiffness, and the joint surface damping exceeding 90% of the overall stiffness [1]. Particularly, the performance of a machine tool’s feed system directly affects the machining and service performance of the entire machine. Therefore, accurately understanding the static and dynamic properties of machine tool sliding guides, i.e., the static and dynamic stiffness and damping of the hybrid lubricated motion joint surfaces they comprise, is crucial [2]. Currently, theoretical research on the contact characteristics of joint surfaces involves numerous assumptions, leading to significant discrepancies between theoretical simulation results and actual observations. Moreover, models based on statistical theory [3–5], fractal theory [6–8], finite element theory [9, 10], and other components are overly complex, resulting in slow calculations of joint surface contact characteristics and making them difficult to directly apply to the analysis of actual machine tool static and dynamic characteristics. To address this, this paper focuses on the joint surfaces of machine tool sliding guides and establishes an experimental platform for the static and dynamic basic characteristics of hybrid lubricated motion joint surfaces. Through this platform, the basic characteristic parameters of joint surfaces (i.e., the contact stiffness and damping parameters per unit area) are obtained, providing data support for the analysis and optimization of the static and dynamic performance of machine tool feed systems.
The investigation of the contact characteristics of mechanical joint surfaces essentially involves the analysis of the mechanical properties of rough surfaces in contact. By studying the stress–strain behavior of microasperities during rough surface contact and utilizing statistical, fractal, finite element, and other methods, a contact mechanics model of rough surfaces is constructed to obtain the contact characteristics of the joint interface [11]. Currently, rough surface contact models can be broadly categorized into statistical contact models, fractal contact models, finite element contact models, etc., such as the classical GW model [12, 13], ZMC model [14, 15], JG model [16], CEB model, and KE model [17, 18]. Statistical contact models are commonly used to predict engineering contacts with multiple contact points on a macroscopic scale, such as bolted joints, with the advantage of low computational cost. However, they heavily rely on assumptions about surface parameters and struggle to accurately describe complex surface topographies [19]. Fractal contact models, by using fractal parameters, can uniformly represent multiscale roughness and better describe complex multiscale rough surfaces. These models are often applied in micro- or nanoscale contact problems, but they are computationally complex, costly, and difficult to apply directly to real surfaces. Finite element contact models can handle surfaces with complex material properties and geometries, particularly in nonlinear and elastic–plastic material contact problems. Although these models offer high accuracy and are suitable for detailed analysis, they are computationally intensive and time-consuming, with high demands on computational resources [20]. While these theoretical models provide a foundation for predicting contact behavior, they often rely on assumptions that may not fully reflect real-world conditions. Thus, experimental research remains an essential means of verifying and calibrating these models, offering more intuitive and precise guidance for practical engineering applications.
The established models typically assume that the heights of microasperities follow a Gaussian distribution. However, for actual mechanically processed surfaces, especially finely processed surfaces, non-Gaussian distributions are often formed, such as surfaces produced by turning, forming, and electrical discharge machining often exhibiting positively skewed features; surfaces after grinding, honing, milling, and wear typically have negatively skewed, highly peaked groove surface characteristics [21, 22]. Moreover, most improved models are based on the assumption of peak-to-peak contact between microasperities of two rough surfaces, equating the contact between two rough surfaces to the contact between a rigid plane and a rough surface. In reality, the interaction between microasperities of rough surfaces often manifests as shoulder-to-shoulder contact [23, 24], i.e., lateral contact state. Models established based on the above assumptions may deviate from the actual situation, necessitating further analysis of the aforementioned issues.
Consequently, scholars continuously expand upon these classical contact models. For instance, Pan et al. [25] studied the normal contact stiffness of unlubricated rough surfaces based on three-dimensional fractal theory and proposed methods for identifying the three-dimensional fractal dimension D and fractal roughness G of rough surfaces. Xiao, Sun, and Chen [26], based on the multistage deformation theory, focused on the smoothness of transition points between different deformation stages and established a new rough surface microasperity elastic–plastic rough contact model, overcoming the discontinuities in previous contact models at each stage. Li et al. [27] developed a mechanical joint surface contact stiffness model considering the continuous smooth contact characteristics of microasperities and the interaction between microasperities. Sun et al. [28] calculated the normal contact stiffness of mixed lubricated interfaces using fractal theory, equivalent thickness theory, and thin layer theory of effective Young’s modulus, providing a theoretical basis for further research on mixed lubrication processes. Sun et al. [29] described the surface morphology based on fractal theory and considered the critical deformation of microasperities during the contact process, establishing a theoretical model for the normal contact stiffness of mating surfaces. Domestic scholars proposed a generalized closed-form model for the friction coefficient between fractal surfaces in mixed lubrication [30], improving upon traditional fractal methods based on area distribution. Yu, Sun, and Wu [31] compared classical statistical methods with fractal methods and used fractal methods to calculate solid contact characteristics, addressing the inability to compute the solid portion in mixed lubrication because of unknown solid contact forces. Wang et al. [32] derived mathematical models for the normal equivalent stiffness and normal equivalent damping of mating surfaces based on fractal theory and the generalized Reynolds equation. Furthermore, in the study of contact characteristics of mating surfaces, theoretical research on lubrication properties of dual rough surfaces cannot be ignored. Pei, Han, and Tao [33] proposed a method for analyzing line contact of non-Gaussian rough surfaces under electrohydrodynamic lubrication and derived the formula for minimum oil film thickness based on this method. Gu et al. [34] considered the non-Gaussian characteristics of microasperities on rough surfaces, proposing an improved mixed lubrication contact model with specified standard deviation, skewness, and kurtosis values, and analyzing the influence of surface morphology on the frictional properties of rough textured surfaces without analyzing the stiffness-damping characteristics between mating surfaces.
However, these theoretical models are inherently complex, making the calculation of contact characteristics cumbersome and difficult, leading scholars to gradually adopt experimental methods to study the contact characteristics of mating surfaces.
2. Related Works
In the study of contact characteristics on mechanical joint surfaces, various complex factors often play a significant role. Experimental investigation stands out as the most intuitive approach to investigating these characteristics. Thus, establishing an experimental platform to directly obtain fundamental parameters of joint surface under certain conditions has become crucial for acquiring contact characteristic parameters.
Deng et al. [35] studied the effects of fractal characteristics on the dynamic characteristics of the oblique impact system by considering the normal contact stiffness with the fractal dimension parameter of the microstructure of the interface. Mottershead and Stanway [36] proposed the frequency response function method for identifying parameters of contact characteristics on joint surfaces, providing robust support for the subsequent identification of equivalent dynamic parameters of joints. Shi and Polycarpou [37] proposed an experimental method based on contact resonance to extract contact parameters of real rough surfaces under light load conditions, revealing that the contact damping ratio decreases with increasing contact load. Yang, Fan, and Lin [38] represented joint surfaces as several degrees of freedom spring-damping units, established a dynamic model of joint surface structure, and identified dynamic characteristic parameters of bolt joint surfaces using the frequency response function method. Konowalski [39] conducted experimental research on the normal contact stiffness of machined specimens, revealing a nonlinear relationship between the normal contact load and displacement on joint surfaces. Fang et al. [40] investigated the flexible deformation of point-contact joint surfaces (i.e., outer rings) of cam roller bearings (CRB) under high-load conditions through loading experiments, unveiling the mechanisms influencing contact characteristics under heavy states. Zhao et al. [41], using dynamic characteristic tests and simulations, verified the variations of contact stiffness and damping of blade-tenon connections with compressive force at the blade root, and their effects on structural dynamic characteristics. Zhang et al. [42] designed a high-precision experimental platform considering different machining textures of rough surfaces, analyzing the influence of different texture types and roughness on contact stiffness. Li et al. developed a novel micromotion response testing device for bolt joint interface under lateral vibration and proposed a multiscale contact modeling method [43] and a random micromotion test method [44], overcoming the complexity of identifying contact stiffness. Although scholars at home and abroad have made certain achievements in exploring the relationship between contact characteristics among joint surfaces and their influencing factors through experimental research methods, most existing studies have overlooked the effects of factors such as operating speed and lubricating oil medium on the contact characteristics of joint surfaces, and the involved joint surfaces lack universality.
Sliding guideways, serving as the foundational supporting and guiding elements in computer numerical control (CNC) machine tools, enjoy broad applicability across various industrial sectors. These guideways exert a direct influence on the dynamic performance and machining precision of the machine tools, positioning themselves as critical vulnerabilities within the comprehensive stiffness chain of the machinery. By focusing our research endeavors on the sliding guideways of machine tools, we can achieve significant enhancements in machining accuracy and concurrently mitigate the frequency of machine tool malfunctions. Consequently, an in-depth study of sliding guideways assumes paramount importance in advancing the overall performance metrics of machine tools.
Therefore, in this paper, an experimental platform was constructed to measure the contact characteristics of mixed lubrication motion joints. The study revealed the impact of factors such as preload on the joint surface, normal surface pressure, excitation frequency, excitation amplitude, lubricant viscosity, and operating speed on the static and dynamic fundamental characteristic parameters of the joint surface. This work provides essential data support for the analysis and optimization of the static and dynamic performance of precision feed systems in machine tools.
3. Introduction to the Experimental Setup
3.1. Structure of the Experimental Setup
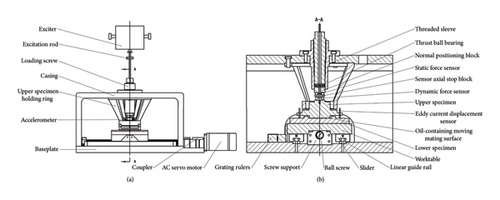
During normal operation, sliding guide rails in machine tools typically operate under mixed lubrication conditions. Therefore, the working conditions of machine tool sliding guide rails were selected as the design conditions for the experimental platform to improve the reliability and accuracy of the experimental data. Research indicates that under normal conditions, the working surface pressure of sliding guide rails generally ranges from 0.025 to 0.3 MPa, reaching up to 1.5 MPa in heavy-duty machine tools. During feed motion, the operating speed of sliding guide rails typically ranges from a few millimeters per minute to 3–12 m/min, with 0.1–0.3 m/min being the most representative, and a film lubrication state occurs at relative speeds between 0.09 and 0.6 m/min. In addition, when applying dynamic forces on the contact surface, it is essential to ensure that the normal excitation force acts directly on the contact surface to avoid the influence of forces in other directions. Furthermore, to ensure that each contact state of the contact surface is the same and the vibration states at each point are consistent, the force sensor, exciter, and force application components must be arranged on the same centerline. This allows the contact surface to simultaneously withstand the action of normal static and dynamic forces, thereby forming a nonsteady mixed lubrication contact. Based on the above analysis and the requirements during the operation of the experimental platform, Figure 1(a) illustrates the main view of the experimental device for normal contact force on the motion joint surface designed in this study, while Figure 1(b) shows a sectional view of the normal experimental device along the A-A direction.
3.2. Data Acquisition and Analysis System
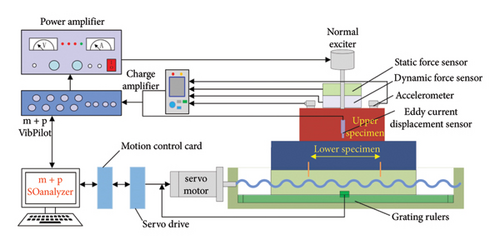
Figure 2 depicts a schematic diagram of the data acquisition and control system for normal contact characteristics of the motion joint surface under mixed lubrication. Utilizing the ECI1202 motion control card developed by Positive Motion Technology Co. Ltd., a high-precision CNC linear slide table was constructed. The slide table is driven by a servo motor to perform reciprocating motion, forming the motion joint surface. A pair of acceleration sensors and eddy current displacement sensors are symmetrically distributed on the upper test piece to ensure balanced mass distribution on the joint surface, thereby guaranteeing the translational motion of the test piece. The vibration signal excitation frequency is set using the built-in vibration noise test system in the m + p SO analyzer software installed on the computer. The excitation signal is outputted to a power amplifier via the m + p dynamic analyzer, amplified, and then transmitted to the normal exciter to generate dynamic excitation force, the magnitude of which can be adjusted using a knob on the power amplifier. Static force sensor and dynamic force sensor are used to detect the static and dynamic forces applied to the joint surface by the loading screw and excitation rod, respectively. The collected signals are fed back to the m + p dynamic analysis system via a charge amplifier. The acceleration sensor detects the acceleration of the upper test piece caused by dynamic excitation force, and the collected signals are also fed back to the m + p dynamic analysis system via a charge amplifier. The deformation caused by normal static and dynamic forces can be obtained using eddy current displacement sensor, and the collected signals are also fed back to the m + p dynamic analysis system. The m + p dynamic analysis system records and outputs the collected data, which are then processed and analyzed to obtain the normal contact stiffness and damping of the mixed lubrication joint surface.
3.3. Experimental Platform
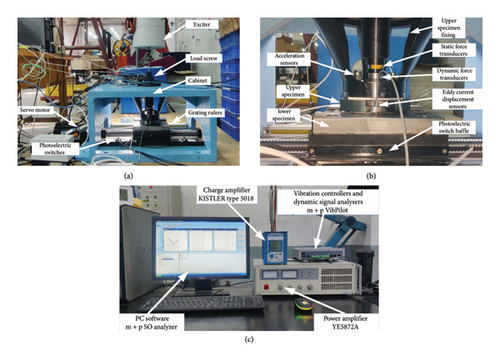
Figure 3(a) illustrates the physical layout of the constructed experimental platform. The platform is placed on a leveled cast iron base to ensure horizontal alignment, thereby ensuring uniform normal loads on the specimen surface. To prevent resonance between the cast iron base and the experimental setup from affecting the results, a rubber pad is placed on the base surface to damp vibrations. During the installation of the exciter, the axis of the exciter should be perpendicular to the experimental platform. Attention should be paid during installation to ensure that the excitation rod is positioned at the center of the loading screw’s central hole, preventing improper vertical installation that could cause the excitation rod to contact the inner wall of the loading screw’s central hole, thereby failing to fully apply the excitation force to the upper specimen. Figure 3(b) depicts the internal structure of the experimental platform. When installing the lower specimen, since the working range of the selected eddy current displacement sensor is within 0.5 mm, it is crucial to ensure the parallelism between the slide table and the base. After installing the upper specimen, the flatness of the plane is measured using a dial indicator to ensure that the eddy current displacement sensor remains within its safe working range during specimen motion. Figure 3(c) presents the physical configuration of the testing system, comprising m + p SO analyzer software, charge amplifier, power amplifier, vibration controller, and dynamic signal analyzer.
4. Data Acquisition Principle
4.1. Principle of Static Contact Stiffness Test
In the formula, Fsi indicates the load applied to the bonding surface for the i time; h is the height of the upper specimen; E is the modulus of elasticity of the material of the upper specimen; and L is the length of the square contact surface of the upper specimen.
4.2. Dynamic Contact Stiffness and Damping Principles
When dynamic excitation is applied in the normal direction of a mechanical motion interface, the contact characteristics of the interface become exceptionally complex. In order to better study the contact characteristics of the interface under such conditions, this section establishes a dynamic model of the interface based on the experimental measurement principles for the normal direction of a mechanical motion interface, as shown in Figure 4.
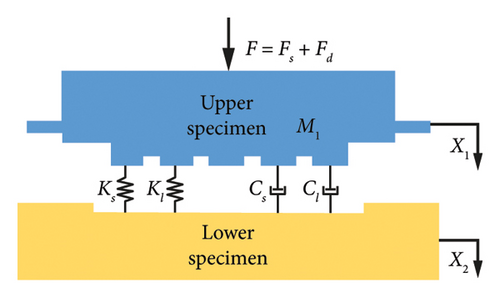
From Equations (11) and (12), it can be found that it is only necessary to obtain the amplitude of the excitation force FA, the amplitude of the deformation Xm, and the phase difference φ on the kinematic bonding surface under mixed lubrication, as well as the angular frequency ω, and the contact area S of the bonding surface through the transducer, and then the dynamic contact stiffness per unit area of the kinematic bonding surface in the normal direction and the damping can be measured.
5. Experimental Programs
Depending on the specific operational conditions, interfacial characteristic parameters can be categorized into static and dynamic parameters. When investigating the normal static characteristic parameters of the interface, this study only considers the influence of different velocities and normal interface pressures on the normal stiffness of the interface. However, while researching dynamic characteristic parameters of the interface, the focus is on examining the variations in the normal dynamic contact stiffness and damping parameters of the interface under different normal interface pressures, excitation forces, and excitation frequencies. The experimental conditions for mixed lubricated contact at the interface are shown in Table 1.
| State of the bond | Specimen material | Normal face pressure | Tangential velocity | Lubricant viscosity | Excitation frequency | Varying excitation force |
|---|---|---|---|---|---|---|
| Static | 45# | 0.0025∼0.3 MPa | 0∼6 mm/s | 0.195 Pa·s | ||
| Dynamic | 30∼100 Hz | 1∼5 N |
Experiments on the upper and lower specimens of the mechanical properties of the material parameters are shown in Table 2, the lubricating oil between the contact surfaces is “L-G 220 Machine Tool Sliding Guide Oil”.
| Materials | Elastic modulus E (Pa) | Hardness H (GPa) | Poisson’s ratio v | Surface roughness Ra |
|---|---|---|---|---|
| 45# | 2.07 × 10¹¹ | 1.96 | 0.29 | 1.6 |
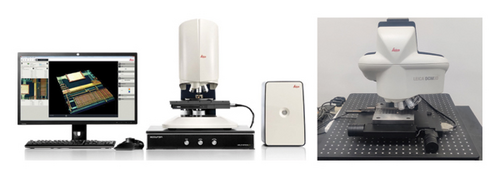
In order to obtain morphological parameters of the specimens’ surfaces, a Leica white light confocal interference microscope (Leica DCM3D) was employed for noncontact measurements, as depicted in Figure 5. This noncontact measurement method offers the advantages of high precision and efficiency, making it suitable for various measurement and observation tasks in high-precision surface analysis work. The specimens were positioned under the microscope to acquire three-dimensional point cloud data of surface microprotrusion heights. Processing the acquired data yielded spectral moment information of surface profile heights, thus obtaining the computational parameters required for assessing interfacial contact characteristics.
Under the white light interferometer, the specimens were positioned within the measurement area, with a total of 512 × 512 measurement pixels, at an angle of 0°, and a resolution of 0.1 nm. A measurement area of 848.26 × 848.26 μm2 was selected, yielding a total of 262,144 data points within the chosen area. The surface morphology characteristics obtained from the Leica white light confocal interference microscope are illustrated in Figure 6.
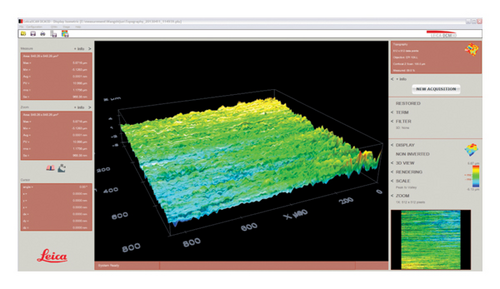
The specimens were measured using a Leica white light confocal interference microscope to obtain three-dimensional surface asperity height data. Statistical parameters of the specimen surfaces were calculated based on Equations (13)–(17), and are presented in Table 3.
| Specimens | Standard deviation of surface profile height (μm) | Standard deviation of the asperity height (μm) | Surface profile bandwidth parameter | Asperity curvature radius (μm) | Embossment density (μm−2) |
|---|---|---|---|---|---|
| Upper specimen | 2.114 | 2.025 | 10.861 | 5.662 | 0.0056 |
| Lower specimen | 1.595 | 1.595 | 10.017 | 5.423 | 0.0074 |
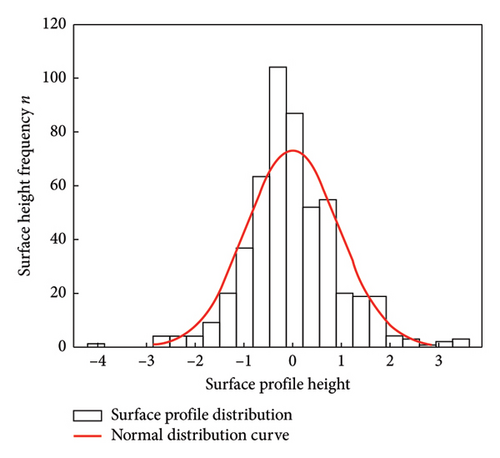
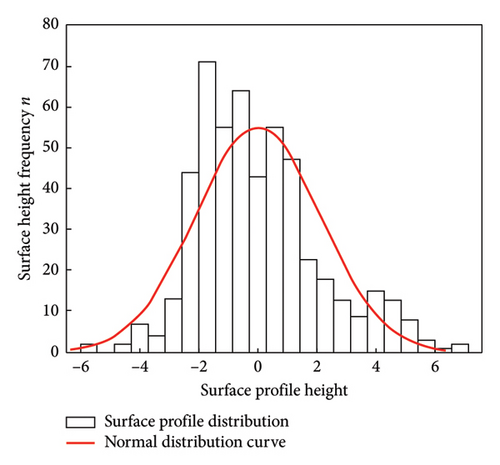
Statistical analysis was conducted on the profile height data of the measured specimens. As depicted in Figure 7, the frequency distribution histogram of the surface profile heights of the upper and lower specimens made of material 45# is presented.
Calculations based on Equations (22)–(25) show that the surface kurtosis and skewness values of all specimens are shown in Table 4:
| Specimens | Upper specimen (45#) | Lower specimen (45#) |
|---|---|---|
| Skewness Sk | 0.31 | 0.6584 |
| Kurtosis Ku | 4.7135 | 3.4181 |
6. Analysis of Experimental Results
6.1. Static Experiments
As shown in Figure 8, the experimental results between normal surface pressure and normal deformation on the bonding surfaces under different relative velocities are shown. The experimental data in the figure reveal a consistent increase in deformation between contact interfaces with an increase in normal contact pressure. In addition, it is observed that at higher relative velocities, the magnitude of normal deformation generated under the same normal contact pressure is greater. These observed patterns align with theoretical simulations, attributed to the increase in the number of asperities in contact and the corresponding increase in their deformation with higher normal contact pressure. Furthermore, at the same pressure, higher relative velocities accentuate the lubrication effect between contact interfaces, resulting in increased film thickness, reduced contact between asperities, and a higher proportion of fluid contact between interfaces. Because of the lower pressure carried by the fluid compared to solids, contact interfaces at higher relative velocities experience greater normal deformation under the same pressure, consequently leading to a decrease in contact stiffness of mixed lubrication contact interfaces with increasing velocity.

6.2. Dynamic Experiment
Figure 9 presents a comparative analysis of experimental results with their fitted curves regarding the dynamic contact stiffness and contact damping on the mixed lubrication contact interface under conditions of relative sliding velocity of 2 mm/s, excitation frequency of 40 Hz, and dynamic excitation force amplitude of 1 N, with variations in normal contact pressure. Upon comparison with theoretical simulation data, in Figure 9(a), it is illustrated that under mixed lubrication conditions, the dynamic contact stiffness of the contact interface increases with the increase in normal contact pressure, showing relatively good agreement between experimental data and theoretical models. Figure 9(b) demonstrates that under mixed lubrication conditions, as the contact pressure increases, the normal contact damping on the sliding contact interface also increases, with the overall trend of experimental data being consistent with theoretical models. However, because of the limited range of surface pressures applied to the contact interface under mixed lubrication conditions in the experiment, combined with the self-weight of the specimens, the actual loading conditions on the contact surface were affected during testing. This issue was particularly evident in the lower range of normal surface pressures, where the deformation caused by the self-weight of the specimens led to discrepancies between the actual contact pressure and the intended experimental conditions. As a result, the experimental data showed some deviations from the theoretical model at lower normal surface pressures. Therefore, the experimental setup and techniques could be further improved by incorporating a balancing mechanism into the apparatus to minimize these effects and enhance the accuracy of the interface parameters.
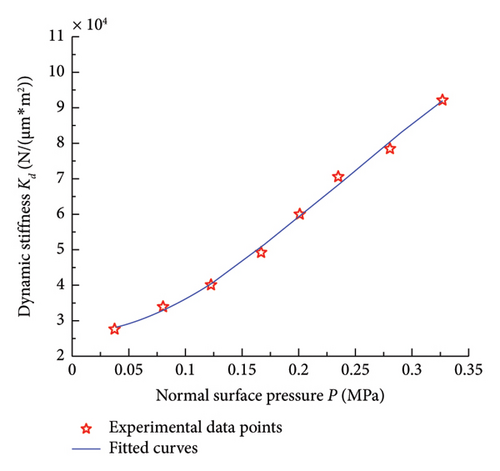
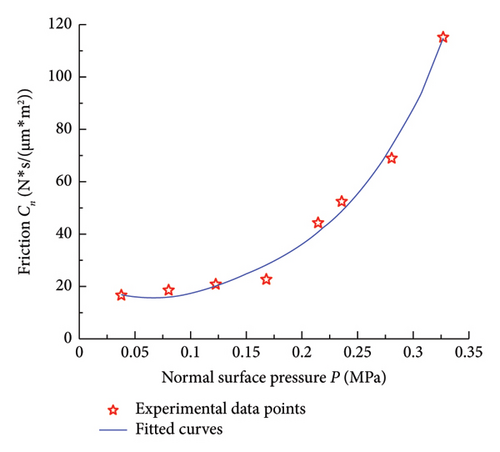
Figure 10 depicts a comparison between experimental results and fitting curves of the dynamic contact stiffness and contact damping on the mixed lubrication contact interface at a normal pressure of 0.038 MPa, sliding velocity of 2 mm/s, and dynamic excitation force amplitude of 1 N for different excitation frequencies. In Figure 10(a), it can be observed that as the frequency increases, the dynamic contact stiffness on the contact interface fluctuates within a certain range, indicating a minor influence of excitation frequency on the normal dynamic contact stiffness of the mixed lubrication contact interface. This is attributed to the fact that material parameters such as elastic modulus and Poisson’s ratio of the specimen are independent of frequency, leading to relatively good agreement between experimental data and theoretical models. Figure 10(b) illustrates that the normal contact damping on the mixed lubrication contact interface gradually decreases with the increase in vibration frequency, showing good agreement between experimental data and theoretical models. It is noteworthy that significant discrepancies exist between the experimental data and theoretical results for the dynamic contact stiffness and damping of the mixed-lubrication interface in the frequency range of 90–100 Hz. This may be attributed to the fact that the experimental apparatus might be operating near its natural frequency within this range, leading to resonance effects. Resonance can amplify the vibration amplitude of the equipment, thereby affecting the measurement of contact stiffness and damping. In future experimental studies, filtering algorithms or resonance correction can be introduced when processing data near the equipment’s resonance frequency to eliminate the influence of resonance. In addition, pretesting the equipment’s natural frequency can help avoid measurements in proximity to this frequency range.
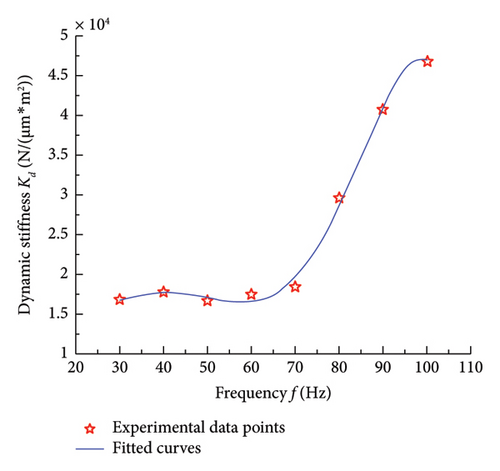
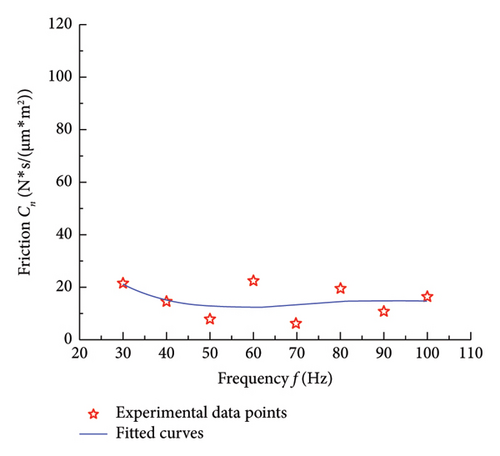
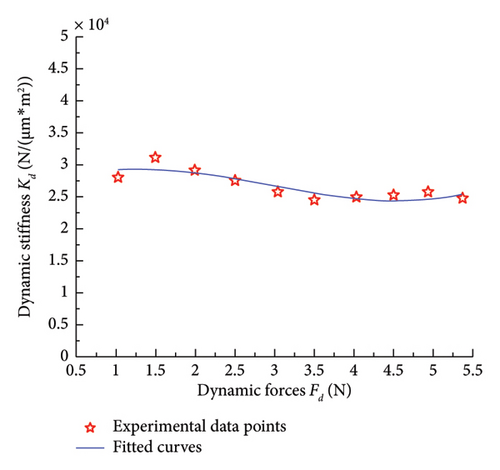
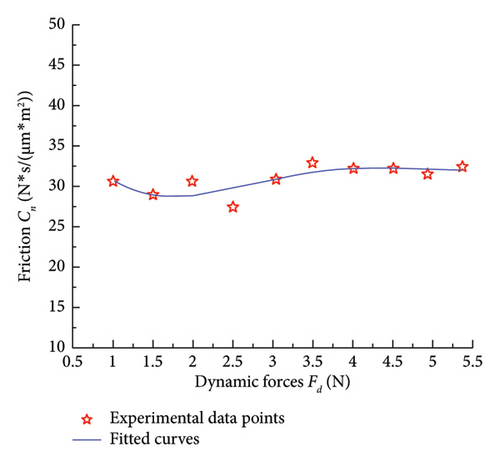
Figure 11 presents a comparison between experimental results and fitting curves of the dynamic contact stiffness and contact damping on the mixed lubrication contact interface under a relative sliding velocity of 2 mm/s, excitation frequency of 40 Hz, and normal pressure of 0.038 MPa. After comparing with theoretical simulation data, it can be observed in Figure 11(a) that as the amplitude of the normal dynamic force increases, there is a slight decrease in the experimental dynamic contact stiffness, which aligns well with the theoretical model simulation. Figure 11(b) illustrates that in the theoretical model, with the increase in the amplitude of the normal dynamic force, the experimental contact damping shows a slight decrease trend. However, in the experimental data, at lower dynamic forces, there is a significant deviation between the contact damping on the contact interface and the theoretical simulation results, indicating noticeable errors. At higher dynamic forces, the experimental results align with the theoretical model. This issue may be attributed to insufficient precision in dynamic force loading. At lower dynamic force levels, the experimental equipment may be unable to accurately control minor fluctuations in dynamic force, leading to instability in force control. This directly affects the test results of normal contact stiffness and damping, indicating that the experiment requires further refinement. In future experimental studies, high-precision dynamic force sensors can be employed, and improvements to the control accuracy of the loading system—specifically, the precision of the actuator in the low-load range—should be made. This would provide higher resolution and faster response times under low dynamic force conditions, thereby reducing experimental errors caused by inaccurate loading.
In the experiment, in addition to the potential causes mentioned above that may lead to discrepancies between the experimental data and the theoretical model simulation data, as well as experimental errors, the following factors also come into play: uneven distribution of normal surface pressure, temperature rise at the interface caused by frictional work, instability of the lubrication film, changes in the friction coefficient, and insufficient sensitivity of the experimental apparatus. To reduce errors and improve the accuracy of the experimental data, the following measures will be taken in future experiments in addition to the improvements already mentioned: enhancing the testing apparatus to ensure uniform surface pressure distribution, selecting appropriate lubricants to stabilize the lubrication film, increasing sensor sensitivity, and regularly calibrating the experimental equipment. These measures will help mitigate the effects of low surface pressure caused by the weight of the specimen, equipment resonance, and the impact of low dynamic forces on the experimental results, thereby further optimizing the experimental outcomes.
6.3. Conclusions of the Experiment
The experimental results indicate that the normal contact stiffness at the interface increases nonlinearly with an increase in normal surface pressure, with solid contact stiffness being the dominant factor. The normal contact stiffness at the interface decreases with an increase in relative sliding speed and lubricant viscosity. The normal dynamic contact stiffness and damping at the interface both increase with an increase in normal dynamic load, where solid contact stiffness plays a major role, and fluid damping determines the contact damping at the interface. Furthermore, the normal dynamic contact stiffness at the interface decreases with an increase in viscosity, excitation force amplitude, and sliding speed but is not affected by changes in frequency. In addition, the normal contact damping at the interface increases with an increase in viscosity and sliding speed, while decreasing with an increase in frequency and excitation force amplitude.
7. Conclusions
Currently, significant progress has been made in understanding the contact characteristics between unlubricated fixed mating surfaces, but research on relative motion mechanical mating surfaces is somewhat lacking. Moreover, most studies are based on theoretical models, making the calculation process complex and challenging, resulting in difficulty obtaining the required key parameters. In addition, most experimental methods currently employed do not consider factors such as operating speed and lubricating oil medium’s influence on mating surface contact characteristics, and the involved mating surfaces lack universality. Therefore, a hybrid lubricated relative motion mating surface experimental platform was constructed to accurately reveal the key influencing factors and laws of contact mechanism and response characteristics of mechanical motion mating surfaces under mixed lubrication conditions.
Considering the non-Gaussian nature of mating surface motion velocity and surface asperity height distribution, experimental laws governing the normal static stiffness during static contact, as well as the dynamic contact stiffness and damping during dynamic contact, concerning normal surface pressure, excitation frequency, and dynamic excitation force, were obtained. In the context of structural design optimization for machine tools, the utilization of dynamic modeling and parameter identification techniques serves as a pivotal means to refine the structural configuration. This method enables precise control over contact stiffness and damping characteristics, thereby substantially augmenting the dynamic response capabilities of the machine tool. Consequently, vibrations and deformations induced during operational procedures, particularly in high-speed machining applications, can be effectively mitigated. By conducting a rigorous analysis and comparative assessment of the working characteristics of mating surfaces across varying speeds, it is feasible to enhance the dynamic performance of the machine tool. This analytical approach provides invaluable data to support the selection of optimal operating speeds and loads during practical applications. Furthermore, in the maintenance and adjustment phases of the machine tool lifecycle, the insights derived from this study can direct the adjustment of parameters such as preload and lubricating oil viscosity, ensuring that the machine tool maintains its optimal working condition. In conclusion, the investigation into contact stiffness and damping characteristics of machine tool mating surfaces holds considerable practical significance in engineering, as it contributes to improvements in machining accuracy, dynamic performance, stability, lifespan, and overall reliability of machine tools.
Conflicts of Interest
The authors declare no conflicts of interest.
Funding
This research was supported by the National Natural Science Foundation of China (No. 52375127), the Key Research and Development Program of Shaanxi Province (No. 2023-YBGY-087), and the Shaanxi Province Youth’ Science and Technology Rising Star Project (No. 2024ZC-KJXX-057).
Acknowledgments
The authors gratefully acknowledge the financial support provided by the National Natural Science Foundation of China (No. 52375127), the Key Research and Development Program of Shaanxi Province (No. 2023-YBGY-087), and the Shaanxi Province Youth’ Science and Technology Rising Star Project (No. 2024ZC-KJXX-057).
Open Research
Data Availability Statement
The data used to support the findings of this study are available from the corresponding author upon request.


