High-Cycle Fatigue Assessment Method for Composite Bridges Based on Predamage Mechanics Model
Abstract
Long-span bridges face the significant challenge of deteriorating life cycles under fatigue loads. A new macroscopic damage mechanics model for rod hinge elements has been proposed to quantify the predamage of bridge beams subjected to high-cycle fatigue. This model introduces predamage variables to evaluate the damage evolution process prior to fatigue crack initiation, enabling the prediction of moderate deterioration in bridges that cannot be monitored during their service life. By comparing the fatigue test results and predamage simulation results of simply supported composite beams and continuous composite beams, it was found that the error between the model predictions and the test results is relatively small. This result confirms the reliability of the model. The predamage model has been implemented as a self-programming subroutine for numerical analysis. Taking the Daxi River Bridge as the engineering background, this predamage model was applied to practical engineering. Combined with typical traffic loads, a predamage assessment was conducted on its dangerous points. The dangerous beam segments of the bridge were taken and the damage values were calculated using a predamage subroutine model. The results obtained had a small error compared to the damage values of the corresponding beam segments in the full bridge simulation. The proposed high-cycle fatigue predamage subroutine model offers a valuable reference for predicting fatigue damage in bridges.
1. Introduction
Under the repeated action of earthquakes, vehicles, and other dynamic loads, the bridge structure will experience fatigue damage, and the accumulation of fatigue damage will easily cause fatigue failure. Fatigue failure is a kind of brittle failure, and there is no obvious sign before the failure occurs, so its fatigue performance is significant for the bridge structure. Harnessing the advantages of synergizing component materials to craft efficient and lightweight structural components, steel–concrete composite beams are frequently utilized for bridge superstructures [1]. Currently, there is limited research available on the fatigue properties of high-strength steel composite bridges. It is a complicated process to accurately predict the fatigue behavior of composite structural beams at high cycles.
Numerous scholars have investigated the fatigue characteristics of composite beams [2]. Their conclusion highlighted the correlation between the fatigue life of composite beams and the fatigue stress amplitude of the specimens. Fatigue tests conducted reveal that under positive bending moments, composite beams experience fracture failure at the bottom steel beam [3]. Yuan conducted [4] fatigue tests, which indicate that the failure mode for composite beams with high shear connection primarily involves fatigue failure of the steel beam segment. Dai and Liew [5] suggest that fatigue performance does not appear to be influenced by the upper limit of the fatigue load and the amplitude of the fatigue stress. They delved into the fundamental causes of stiffness reduction in composite beams, established the stiffness degradation curve, and highlighted the irreversible nature of the stiffness reduction in composite beams [6]. The test results from Song et al. [7] indicate that variations in the fatigue’s upper limit significantly impact fatigue life, potentially leading to different failure modes. Ma et al. [8] conducted high-cycle fatigue tests on a group of simply supported high-strength steel–concrete composite beams, and the test results showed that the failure mode of the beams was cracking of the bottom flange near the midspan of the steel beams. Some scholars delve into the fatigue failure mode of the supported composite beam [9]. Failure initiates at the end stud, with the failure process characterized by sequential stud fractures.
Zhu, Xu, and Yang [10] established a model suitable for simulating two-dimensional fatigue crack propagation, which expands a new idea for fatigue research. Cui et al. analyzed the fatigue failure in a double-deck bridge using vehicle–bridge coupling and revealed that the dynamic response peaked at the main span [11]. Qin et al. evaluated the fatigue properties of orthotropic bridge panels and revealed that their fatigue detail life was superior or longer-lasting compared to that of asphalt steel decks [12]. Zhu et al. proposed a multifactor fatigue life correction method that introduces a new technical approach for estimating the life of materials or structures under cyclic loading conditions [13]. Bai et al. proposed a damage evolution law in beam elements to assess the remaining lifespan of high-rise steel structures [14]. This approach quantified the extent of damage in relevant components within high-rise buildings, enabling the prediction of their residual life.
The cyclic effect of vehicle loads leads to the accumulation of fatigue damage in bridges, which is one of the main causes of bridge fatigue failure [15]. Paeglitis and Paeglitis [16] analyzed vehicle information collected under uninterrupted traffic flow and established a system using recorded motion weighing data to obtain a load distribution map and determine the position, speed, and intensity values of the heaviest axis. Carey et al. [17] studied the congested traffic load on large-span bridges using microscopic traffic simulation methods. They constructed a model called “congestion traffic pseudomicrosimulation” (PMCT) to reduce the significant uncertainty involved in extrapolating short-term simulation results to long-term return periods. Kim and Song [18] developed a comprehensive probability model to describe the characteristics of vehicles and traffic flow, in order to evaluate the traffic load effects of target bridges using Monte Carlo simulation methods. Lu, Ma, and Liu [19] proposed a maximum traffic load effect extrapolation method based on the theory of level crossings, based on domestic traffic monitoring data.
A new high-cycle fatigue damage mechanical model for steel–concrete composite bridges is introduced. The primary goal of this novel model is to accurately predict and evaluate the cumulative fatigue damage that occurs within steel–concrete composite bridges subjected to repetitive loading cycles and try to apply this model to a practical bridge project.
2. High-Cycle Fatigue Predamage Model
2.1. High-Cycle Fatigue Predamage Accumulation
2.2. Fundamental Equation
2.3. UEL Modeling Program
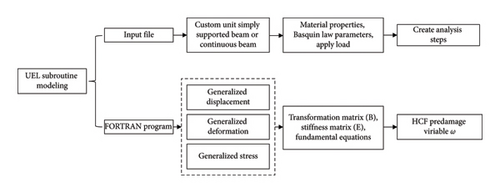
The UEL is built upon the ABAQUS interface and is authored by users in FORTRAN syntax. Throughout analysis and calculations, ABAQUS communicates state variables via this interface. Some subroutine variables, such as externally imposed loads and unit information, are provided by the software. Meanwhile, users must code the calculation and update procedures for other variables, such as stiffness and mass matrices and residual node forces. The UEL process is shown in Figure 1.
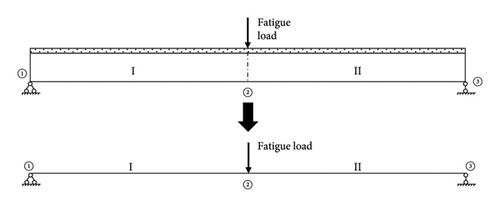
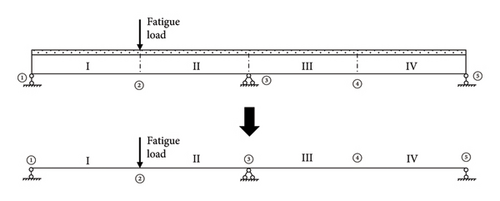
This paper adopts the secondary development of ABAQUS finite element software to simplify the three-dimensional entity into a two-dimensional plane modeling. Taking the simply supported beam and continuous beam in Figures 2 and 3 as examples, I–IV represent unit numbers and ①–⑤ indicate the node numbers. Therefore, in this paper, simply supported beams are simplified as 2 elements and 3 nodes, while continuous beams are simplified as 4 elements and 5 nodes. Among them, even numbered nodes are taken at the midspan.
3. Fatigue Simulation of Composite Beams
3.1. Fatigue Test of Simply Supported Beams
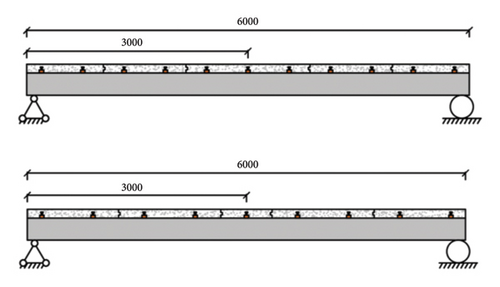
We perform fatigue tests on 5 simply supported composite beams, and the dimensions of the composite beams are shown in Figure 4. The I-beam in the composite beam is made of Q550D steel, and the concrete slab is made of C50 commercial concrete. The square steel connectors welded on the upper flange of the I-beam connect the I-beam and the concrete slab. For more detailed information about the specimens, please refer to previous research [8].
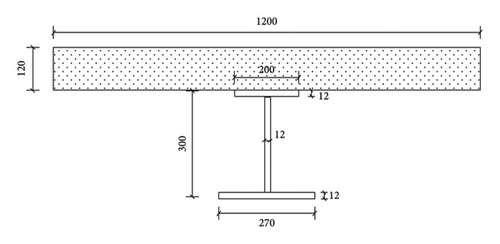
Applying a concentrated load at the midspan of a simply supported beam, a static test was conducted on a composite beam, and the ultimate bearing capacity Pu of the composite beam was obtained to be 950.4 kN. We determine the fatigue load based on the ultimate bearing capacity as a reference. The upper and lower limits of fatigue load are shown in Table 1.
| Test number | Connector spacing (mm) | Upper limit of the fatigue load (Pu) | Lower limit of the fatigue load (Pu) | Fatigue life |
|---|---|---|---|---|
| F560-0.4 | 560 | 0.4 | 0.15 | 364,713 |
| F560-0.5 | 560 | 0.5 | 0.15 | 143,325 |
| F560-0.6 | 560 | 0.6 | 0.15 | 71,890 |
| F560-SX | 560 | 0.4 | 0.05 | 191,690 |
| F700-0.5 | 700 | 0.5 | 0.15 | 145,794 |
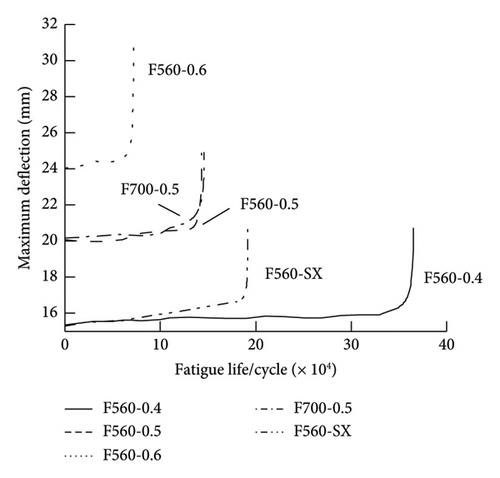
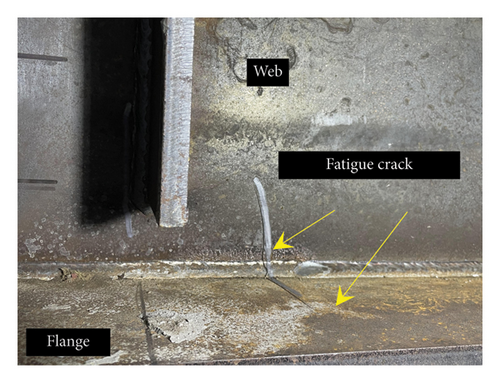
The fatigue failure mode observed in the specimens involves the development of cracks in the steel beam at the bottom of the midspan, accompanied by a limited occurrence of slender transverse cracks at the bottom of the concrete plate. In the early stages of fatigue life, there is no apparent change in the maximum dynamic deflection of the specimen. However, during the latter stages of fatigue life, there is a rapid increase in the maximum dynamic deflection at the midspan, as shown in Figure 5(a). Yet, the structure remains capable of withstanding additional load cycles. Importantly, no weld shear failure was observed in any connectors during fatigue loading. In this new type of the composite beams, provided the welding quality of the connector is maintained, the fatigue damage predominantly occurs at the bottom of the steel beam, as depicted in Figure 5(b), indicating this area as the critical location for potential failure.
The fatigue life of the simply supported composite beams obtained from fatigue tests is listed in Table 1.
3.2. Predamage Simulation of Simply Supported Beams
After visible cracks appear in steel beams at the later stage of fatigue life, the maximum dynamic deflection increases rapidly until failure. In the test, the predamage variable corresponding to the cycles of the maximum dynamic deflection rapidly increases until failure is defined as “1.” The simulated high-cycle fatigue predamage is shown as follows.
The simulation results are compared with the test results under different load amplitudes with the same shear connection degree, as shown in Table 2. Except for the significant error between the simulated and experimental values of F560-SX, the errors of the other experimental groups are not significant, as shown in Figure 6. In comparison to F560-SX, F560-0.5 exhibits the same load amplitude but differs in load upper and lower limits, resulting in varying fatigue life. The simulation of F560-SX is not very good because the high-cycle fatigue predamage model in this article is suitable for load modes with the same lower limit of load. When the minimum load changes, the corresponding critical bending moment and gamma value are different, resulting in significant errors in the simulation results.
| Test number | Fatigue life | UEL simulation | Error (%) |
|---|---|---|---|
| F560-0.4 | 364,713 | 352,500 | 3.35 |
| F560-0.5 | 143,325 | 141,300 | 1.41 |
| F560-0.6 | 71,890 | 77,600 | −7.94 |
| F560-SX | 191,690 | 134,100 | −30.04 |
| F700-0.5 | 145,794 | 144,100 | 1.16 |

3.3. Predamage Simulation of Continuous Beams
In order to further verify the usability of the high-cycle fatigue predamage model, reference was made to the fatigue test results of continuous composite beams conducted by Song et al. [21]. The dimensions of the composite beam used in this experiment are shown in Figure 7. The steel beam is made of Q345B, the concrete slab is made of C50 commercial concrete, and the steel bars in the concrete slab are HRB400.

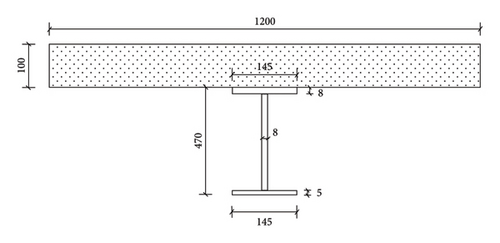
This fatigue test applies a fatigue load at the midspan of one span of the beam. We obtain the moment of inertia of the continuous beams’ section using the calculation method of equivalent stiffness of the section mentioned earlier as follows: I = 4.9197 × 108 mm4.
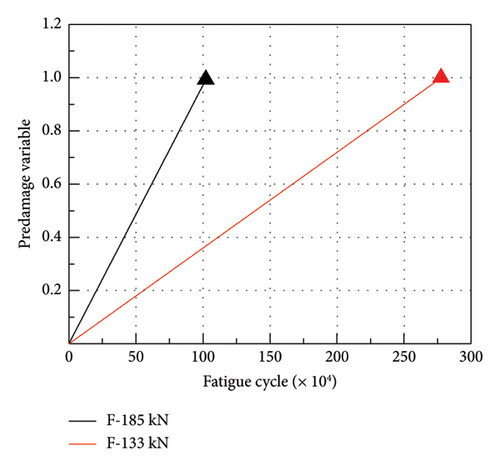
Before the fatigue test, static tests were conducted on beams of the same size to determine the ultimate bearing capacity of the continuous beam, providing a basis for the fatigue test loads of F-133 kN and F-185 kN beams. The ultimate bearing capacity of the continuous beam measured by the static load is 733 kN. The fatigue test adopts a constant amplitude sinusoidal cyclic load. The loading frequency for fatigue testing is set to 3 Hz. The maximum load design for F-133 kN is 133 kN. In order to analyze the relationship between the fatigue performance of composite beams and the fatigue load amplitude, the F-185 kN test beam increased the load amplitude level, and the maximum load and load amplitude of F-185 kN increased to 185 kN. The macroscopic cracks of F-133 kN and F-185 kN steel beams appeared after 2.78 million and 1.03 million cycles, respectively, and the cracks on the steel beams rapidly spread until fatigue failure. The fatigue load size and fatigue life of the experiment are shown in Table 3.
| Test number | Upper limit of the fatigue load (kN) | Lower limit of the fatigue load (kN) | Fatigue life (× 104) |
|---|---|---|---|
| F-133 | 133 | 60 | 278 |
| F-185 | 185 | 60 | 103 |
The high-cycle fatigue predamage variables obtained by simulating these two continuous beams are shown in Figure 8.
4. Engineering Application
The practicality of the high-cycle fatigue predamage model proposed in this paper can be confirmed by comparing the results of high-cycle fatigue tests and predamage subroutine simulations of composite beams under two different support conditions. Next, the high-cycle fatigue predamage model will be applied to the example of the Daxi River cable-stayed bridge project.
4.1. Background of the Daxi River Bridge Project and Bridge Modeling
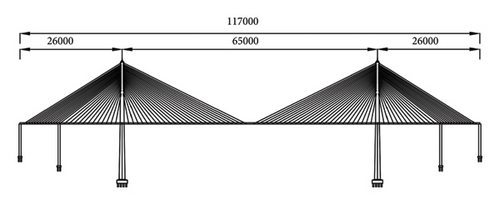
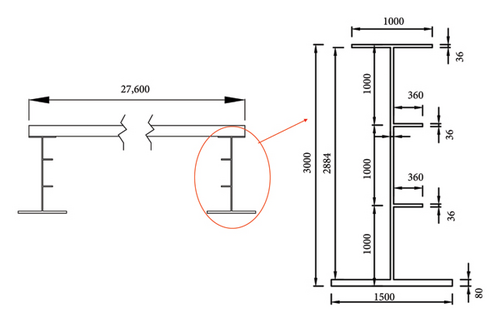
The Daxi River Extra Large Bridge at the junction of Fengjie County and Wushan County is a double steel concrete composite cable-stayed bridge. The main bridge is divided into 5 spans, with a bridge deck width of 27.6m. The layout of the bridge and the schematic diagram of the bridge cross-section are shown in Figures 9(a) and 9(b) The main beam of the bridge is made of Q370qD steel, and the concrete bridge deck is made of C60 high-performance concrete.
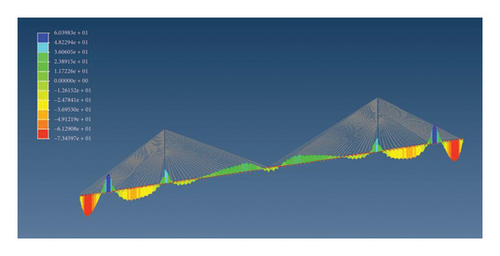
We modeled the entire bridge using Midas. In the bridge model, beam elements are used for the main beam and tower, and truss elements are used for the stay cables. The anchor points between the stay cables and the main tower and main beam are connected to the main beam nodes through rigid connections. The connection between the main beam and the bridge tower is elastic. During the bridge construction stage, the model considers self-weight, cable tension, prestressing, and compressive weight. The stress distribution diagram and bending moment distribution diagram of the entire bridge under static conditions obtained are shown in Figures 10(a) and 10(b). From the figures, it can be seen that the stress values in the middle and midspan of the two auxiliary piers are relatively high, and these two locations may be dangerous sections.
4.2. Predamage Evolution Result Under Typical Traffic Load
After conducting static analysis on the entire bridge, random traffic loads are applied to the bridge for dynamic analysis.
We classify the vehicles into 5 categories based on the number of axles: 2-axle vehicles, 3-axle vehicles, 4-axle vehicles, 5-axle vehicles, and 6-axle vehicles. According to the equivalent fatigue damage theory, we collect traffic flow data from multiple regions and bridges and generate the weight and proportion of each type of vehicle using normal distribution and Gaussian mixture distribution. The results showed that the traffic proportions of each category were 50%, 7.2%, 5.7%, 6.1%, and 31%, respectively. We collect the traffic flow data on different lanes of several bridges to determine the traffic flow on each lane of the bridge. We maintain a constant proportion in the simulated traffic flow and generate a random traffic load during the day using a numerical program.
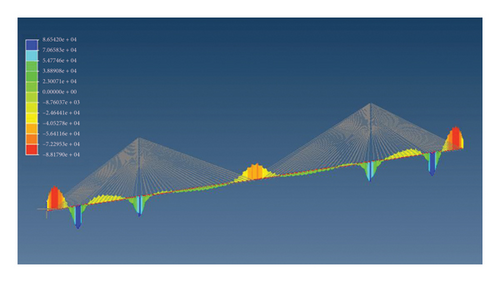
After data processing, the obtained random vehicle loads are imported into the MIDAS/Civil time history function to obtain the time history curve. The model is simplified by applying a load with a vehicle spacing of 20m to the corresponding nodes. The maximum and minimum values of the bending moment and stress of the bridge are shown in Figure 11.
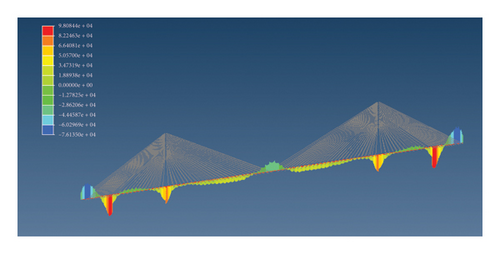
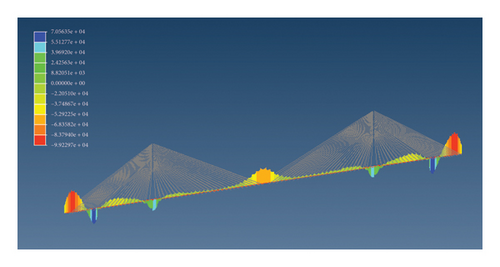
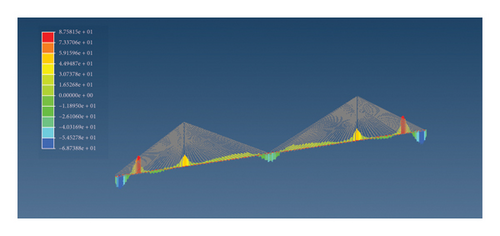
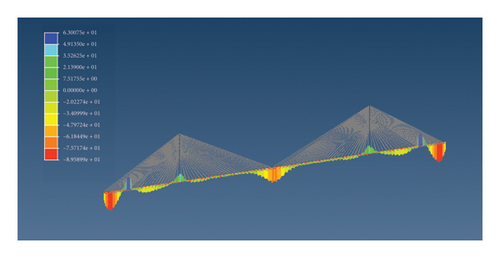
Due to the symmetry of the entire bridge, the 19th node between the two auxiliary piers on the left half of the bridge is taken as the first dangerous node position, the midspan position is taken as the second dangerous node position, and the 255 node near the midspan position is taken as the third dangerous node. We list the stress amplitude and bending moment amplitude of these three dangerous nodes in Tables 4 and 5. It is worth noting that the stress amplitude and bending moment amplitude obtained at this time are the difference between the maximum and minimum values within a day and not the amplitude of a single load cycle.
| Node | Mmax (kN·m) | Mmin (kN·m) | |Mmax − Mmin| |
|---|---|---|---|
| 19 | −52312 | −74368 | 22056 |
| 255 | 19287 | −5046 | 24333 |
| Midspan | −59548 | −37854 | 21694 |
| Node | σmax (MPa) | σmin (MPa) | |σmax − σmin| |
|---|---|---|---|
| 19 | −47.23 | −67.14 | 19.91 |
| 255 | 19.77 | −5.17 | 24.94 |
| Midspan | −61.04 | −38.8 | 22.24 |
From both the perspectives of stress and bending moment, it can be concluded that Section 255 is the most dangerous section, followed by the midspan section. Therefore, these two sections were selected as dangerous sections for fatigue predamage comparison. Node 255 is named the most dangerous node in the following text.
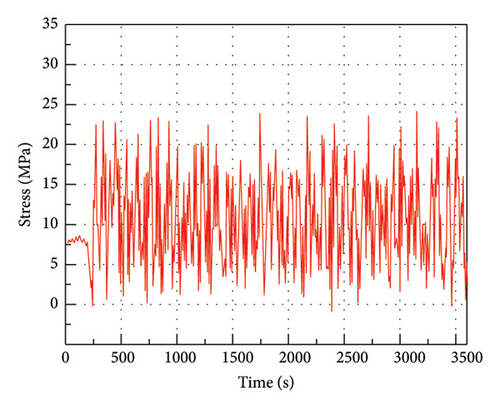
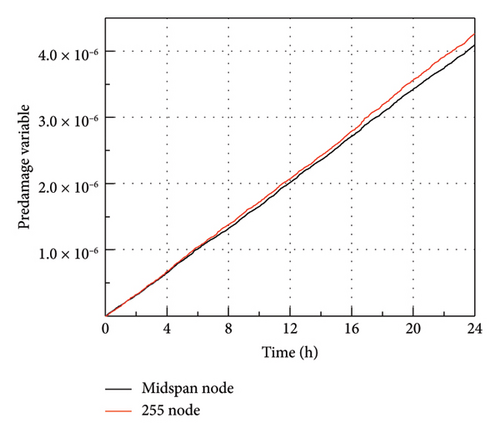
By using the rainflow counting method, the stress time history curves of each dangerous section can be obtained, and the stress time history spectrum of the most dangerous node is shown in Figure 12. We perform predamage simulations on the most dangerous node and midspan node, respectively, as shown in Figure 13. The predamage generated at the most dangerous node is greater than that generated at the midspan section.
4.3. Predamage Simulation of Some Beam Sections of the Daxi River Bridge
The high-cycle fatigue predamage subroutine is modeled in the positive bending moment zone containing the most dangerous points, and the predamage and fatigue life at the dangerous nodes under single-point vehicle load are calculated. The beam section is 86 m long and includes 10 nodes and 9 units, including nodes 239, 242, 246, 250, 254, 255 (the most dangerous node), 258, 262, 266, and 268. Due to the different material properties between 239–262 and 262–268, they are the Beam1 set and Beam2 set, respectively. We define their material properties and damage parameters separately, including material elastic modulus E, cross-sectional moment of inertia I, and damage parameters Mcr and γ. The modeling diagram is shown in Figure 14.

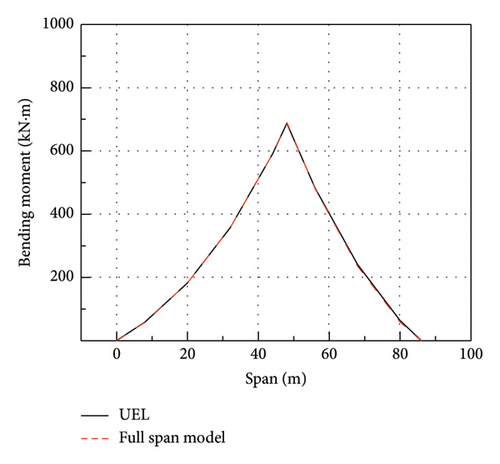
For the UEL subroutine model established under a single vehicle model to simulate some beam segments, it can effectively simulate the vehicle response state in that state. The obtained bending moment diagram almost coincides with the bending moment diagram of this section of the Midas full bridge model, as shown in Figure 15. It can be concluded that this modeling method is effective for modeling the selected beam segments.
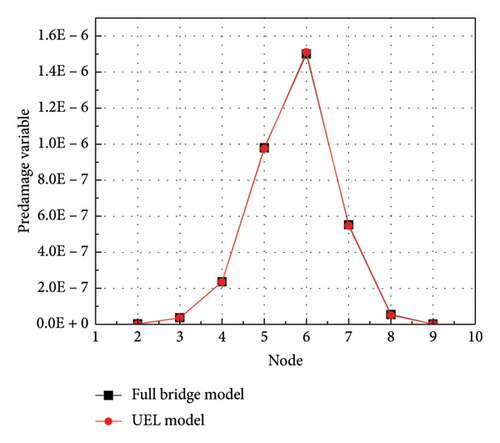
The damage at each node under single-point vehicle loading was obtained through simulation, as shown in Table 6 and Figure 16. By comparing the full bridge model with the UEL model, the error between the two is relatively small, which proves the effectiveness of the high-cycle fatigue predamage model subroutine and can be used as one of the tools for predicting fatigue damage in engineering.
| Node | Full bridge model | UEL model | Error (%) |
|---|---|---|---|
| 2 | 1.49E − 09 | 1.42E − 09 | −4.665 |
| 3 | 3.54E − 08 | 3.54E − 08 | −0.263 |
| 4 | 2.36E − 07 | 2.35E − 07 | −0.228 |
| 5 | 9.79E − 07 | 9.75E − 07 | −0.396 |
| 6 | 1.50E − 06 | 1.51E − 06 | 0.732 |
| 7 | 5.52E − 07 | 5.46E − 07 | −1.060 |
| 8 | 5.34E − 08 | 5.04E − 08 | −5.617 |
| 9 | 1.28E − 09 | 1.05E − 09 | −17.961 |
5. Conclusions
A new mechanical model of high-cycle fatigue damage is proposed, and a predamage variable directly related to fatigue crack initiation is introduced. The high-cycle fatigue damage mechanical model is successfully implemented in the UEL subroutine of ABAQUS. It establishes a linear relationship between the number of fatigue load cycles and the predamage variable. This approach quantifies deterioration specifically, focusing on the predamage variable rather than traditional parameters such as stiffness or bending.
We conducted high-cycle fatigue tests on simply supported composite beams. The four sets of simulated values from the model, considering the lower load limit, exhibit strong conformity with the actual test data. This correlation suggests that the lower load limit significantly affects the predamage parameter γ, thereby leading to imprecise forecasts of the predamage variable. Further investigation into the determining factors influencing the predamage parameter γ is imperative.
We refer to the continuous beam fatigue test by Song et al. and compare its experimental results with the simulation results from the UEL predamage subroutine. The simulation results are relatively accurate, which verifies the effectiveness of the high-cycle fatigue predamage subroutine model proposed in this paper.
Taking the Daxi River Bridge as the engineering background, a Midas finite element simulation of the entire bridge was conducted. The simulation comprehensively considers the self-weight, cable forces, prestress, and random traffic loads of the entire bridge to determine the location with the maximum stress amplitude, which is considered the most critical point. Predamage analysis was conducted on the most dangerous points and midspan nodes, and the results showed that the predamage variables at the most dangerous points were relatively large, indicating that stress amplitude is the main factor affecting the fatigue performance of bridges. Comparing the predamage values of the beam segment simulated by the UEL subroutine with the predamage values of the full bridge model simulated by Midas, the error range is small, further verifying the effectiveness of the proposed model in this paper.
Conflicts of Interest
The authors declare no conflicts of interest.
Funding
This study was partially supported by the National Key R&D Program of China (Grant no. 2022YFB2602700), the National Natural Science Foundation of China (Grant no. 52378216), and the Chongqing Natural Science Foundation for Outstanding Young Scientists Fund (Grant no. CSTB2024NSCQ-JQX0027).
Open Research
Data Availability Statement
The data that support the findings of this study are available from the corresponding author upon reasonable request.


