Fatigue Monitoring of 321 Steel Coated by Laser Additively Manufactured CoCrFeMnNi High-Entropy Alloy Using Acoustic Emission Technique
Abstract
Fatigue failure is a common mode of deterioration for steel cables (e.g., 321 stainless steel) in cable-stayed bridges. In this case, given that the FeCoNiCrMn high-entropy alloy (HEA) coatings have been found to simultaneously improve the fatigue and corrosion resistance of 321 steel, the fatigue crack growth behavior of 321 steel coated with selective laser melting CoCrFeMnNi HEA was further studied in this work. The results indicate that the CoCrFeMnNi alloy coating is able to increase the fatigue crack growth resistance of 321 steel by 21.43% compared to the uncoated 321 steel, and this is because the initiation of crack is mitigated by the angular disparities between adjacent grains and an increased dislocation density in the coating. Furthermore, the acoustic emission (AE) technique was used to track fatigue damage and predict fatigue crack growth life. It was found that crack length could be effectively monitored and predicted using the count and energy parameter, suggesting material and stress ratio independence in the AE technique.
1. Introduction
Cable steels in cable-stayed bridges, for instance, 321 stainless steel, are subject to complex cycling external loading, leading to the stress concentration and abrupt changes in stiffness and a reduction in the service life of the bridges [1–4]. Therefore, improving the fatigue resistance and predicting service life of cable steel are critical considerations for the maintenance and safety of cable-stayed bridges. Therefore, conventional aluminizing and ceramic coatings are commonly employed on such structural steels [5–7]. Recently, high-entropy alloy (HEA), which is a newly developed alloy system and breaks away from the traditional alloying concepts [8], holds great promise to be the coatings with excellent corrosion, fatigue, and oxidation resistance at harsh marine environment [9–16]. For instance, Meghwal et al. [11] reported that the AlCoCrFeNi HEA coatings exhibited excellent mechanical properties and corrosion resistance. As to the fatigue resistance of HEA coating, Cavaliere et al. [17] observed that FeCoCrNiMn coatings could evidently improve the fatigue life of the steel substrate due to compressive residual stresses and grain refinement. In principle, the superior performance of the HEA can be attributed to significant solid solution strengthening, pronounced lattice distortion effects that impede dislocation motion, activation of deformation twinning, and slip generation [18–21]. For instance, the deformation-induced twins in the CoCrFeMnNi alloy resulted in an increase in the yield strength and the ultimate tensile strength of the alloy to 1284 and 1297 MPa, respectively [18]. Likewise, Picak et al. [21] discovered that hot-extruded CoCrFeMnNi alloys facilitated the initiation of planar and cross-slip/wavy slip mechanisms at high strain amplitudes, thereby improving the fatigue life. During fatigue crack propagation, crack closure effects due to surface roughness and residual plastic strain in the wake of the crack also play a significant role [22–25]. For instance, Fujita et al. [25] demonstrated that FeCoCrNiMn alloys with a coarser microstructure have a higher degree of crack closure effect due to their higher roughness, which in turn improves their resistance to fatigue crack growth (FCG). Therefore, the steel coated with HEA coatings is expected to yield a structural material with significant application potential. In this case, although some research has been carried out on the FCG behavior of HEAs [24, 26, 27], there is limited information available on the crack growth characteristics of HEA coatings. In addition, the mechanisms by which HEA coatings affect the crack growth behavior of the steel substrate warrant further investigation.
On the other hand, the detection and prediction of fatigue cracks is essential to ensure the safety and reliability of cable-stayed bridges. Acoustic emission (AE) technology is widely used to monitor the dynamic deformation and fracture processes in a range of materials by using highly sensitive sensors, which is based on the passive recording of crack initiation [28], crack extension [29, 30], crack opening/closure [31], and plastic deformation [32, 33] during FCG in metallic materials. Moreover, common AE parameters include amplitude [34], energy [35], entropy [36], counts [37], and frequency [38], which can be effectively identified in the three stages of crack propagation. For instance, because the count and amplitude were found to be able to well identify the crack [39], the first crack length prediction model with high accuracy and multifactor AE parameters for different stress ratios was successfully developed. Similarly, Chen et al. [40] indicated that the accumulated acoustic energy can be divided into three stages based on the slope, which matches well with the three characteristic states of FCG. Further, Chai et al. [32] showed that AE entropy accurately identified the crack initiation sites and the transition in stress condition from plane strain to plane stress state under high peak load. Therefore, the efficacy of AE parameters such as amplitude, number, energy, and entropy in detecting FCG has been verified, and there are many approaches developed to monitor the fatigue life. However, the relationship between various AE signal features and the specific characteristics of FCG as well as the accuracy of fatigue life prediction remains uncertain and represents a significant research challenge.
In this study, given that the FeCoNiCrMn HEA coatings have been found to simultaneously improve the fatigue and corrosion resistance of 321 steel in our recent work [41], the FCG behavior of the 321 steel coated by selective laser melting CoCrFeMnNi HEA was further studied. In detail, the FCG tests were carried out on both coated and uncoated 321 stainless steel specimens, and the FCG characteristics were examined using scanning electron microscope (SEM), electron backscattered diffraction (EBSD) to reveal the mechanism of FCG in these materials. Moreover, the AE parameters were used to delineate the damage stage associated with FCG and predict the fatigue life.
2. Experimental Procedures
The equiatomic proportions of CoCrFeMnNi commercial alloy powders were used to produce the coatings on 321 stainless steel by laser additively manufacturing, and our previously published article [41] describes the preparation method in detail, so it is not presented in this paper. Compact tension (CT) specimens were machined from coated and uncoated 321 stainless steel, and three stress ratios (R) of 0.1, 0.3, and 0.5 for FCG testing are selected. As depicted in Figure 1, the dimension of specimens is 25.4 mm in width (W), 4 mm in thickness (B), and 10 mm in notch length (a). The FCG tests were performed on YYF-50 fatigue testing machine with a 4 kN load under sinusoidal waveform frequency of 1 Hz, and the crack growth was tracked using the direct current potential drop (DCPD) method. Triplicate tests were performed for each stress ratio to ensure experimental reliability.
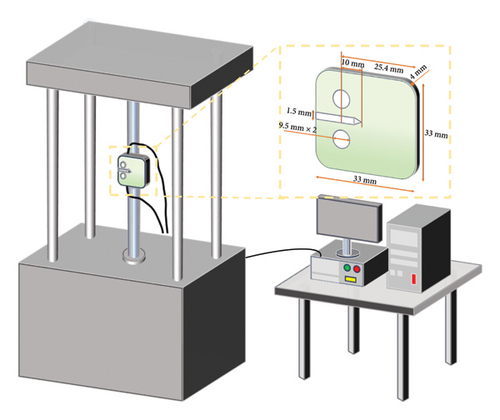
Meanwhile, during FCG test, an AE sensor was positioned in close proximity to the notch of specimen to in situ monitor the FCG behaviors, as illustrated in Figure 1. A pencil break test was performed before each experiment to confirm that the system could detect the resulting AE. The AE testing parameters were set up using the AE detection device LMS SCADAS XS with a sampling rate of 1 MHz, and the peak definition time (PDT), hit definition time (HDT), and hit locking time (HLT) were set to 300, 600, and 1000 μs, respectively. In addition, to filter out external noise different from AE signals corresponding to crack growth, the combination of an amplitude threshold and a band-pass filter was used. Concretely, a dummy specimen without the notch was first performed under the same loading condition to record AE signals from external noise, which could be recorded as baseline. Hence, an amplitude threshold was determined to suppress the low-amplitude environmental and mechanical noises. In this case, the AE system would only record signals for which the peak amplitude exceeded the predefined threshold, by which the external noise could be filtered out. Simcenter Testlab software was used to extract energy, amplitude, and count features from the AE waves and manually calculate the entropy features after the FCG test was finished. Afterward, all AE signals produced throughout the fatigue loading process were collected, stored, and analyzed. A variety of AE parameters were hence calculated from the waveforms to evaluate the state of the fatigue crack. In addition, SEM and EBSD were employed to characterize fractographic features and ascertain the crack growth mechanisms.
3. Results
3.1. Comparison of FCG Trends and Rates
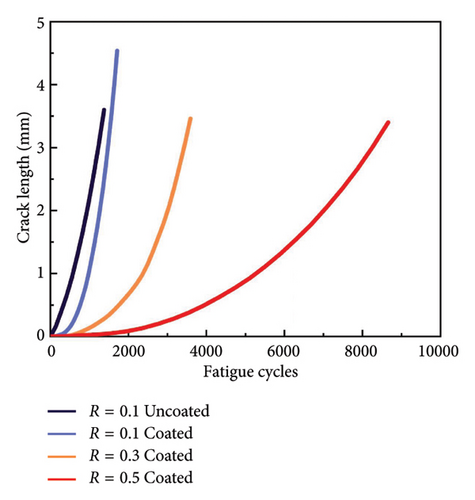
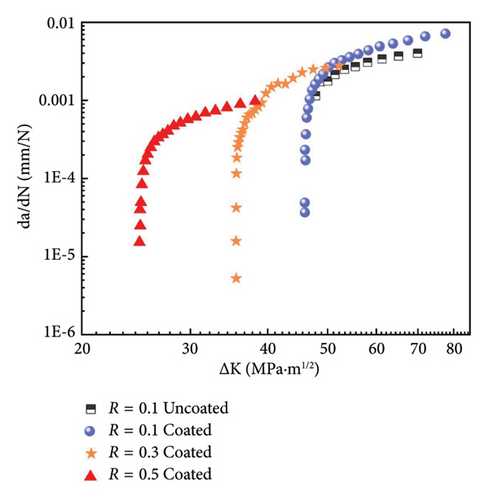
Figure 2(a) illustrates the correlation between fatigue crack length and fatigue load cycles for both uncoated and coated specimens under different stress ratios. For the uncoated specimen, the crack length until fracture is 3.6 mm after approximately 1400 cycles at a stress ratio of 0.1. In contrast, the crack length until fracture of the coated specimen reached 4.6 mm after 1700 cycles at a stress ratio of 0.1. Moreover, the testing results show that the coating has the ability to impede the initial propagation of fatigue cracks. In detail, the fatigue cycles for the appearance of initial crack with 0.5 mm in length are 400 and 800 for uncoated and coated specimens, respectively. Such difference illustrates clear effectiveness of the HEA coating in enhancing the fatigue resistance of 321 steel by impeding the crack propagation. Furthermore, the FCG testing results with stress ratios of 0.3 and 0.5 for coated specimen also demonstrated that higher stress ratios resulted in longer fatigue life. For instance, the fatigue cycles until failure of the coated specimen with a stress ratio of 0.5 could withstand up to 8500 cycles, which is approximately 5 times than that with a stress ratio of 0.1.
| Paris coefficients | Uncoated | Coated R = 0.1 | Coated R = 0.3 | Coated R = 0.5 |
|---|---|---|---|---|
| logc | −6.027 | −6.140 | −6.986 | −7.054 |
| m | 1.980 | 2.132 | 2.565 | 2.575 |
3.2. Fractural Surface Morphology
Figures 3(a) and 3(b) illustrate the crack paths in both coated and uncoated specimens at a stress ratio of 0.1, where the crack growth direction was shown from left to right, and the crack path is overall perpendicular to the fatigue load direction. Low angle crack deflections and branching were noted in both specimens, while high angle deviations were more pronounced in the coated specimens, resulting in a more convoluted crack trajectory. The coated specimen exhibited a more extensive crack front with branching characteristics compared with the uncoated specimen. This phenomenon contributes to the dispersion of stress and the creation of a passivating effect at the main crack tip. Subsequently, during the latter half of the crack growth, the flanks of the cracks come into contact. In areas where the crack flanks meet, evidence of localized out-of-plane plastic deformation is observed. This is attributed to intense local compression which enables the coated steel flow and extrusion along the path of least resistance. In addition, the fracture progression deviates from its initial growth direction, with the crack demonstrating a tendency to circumnavigate the plastic zone rather than continuing along its original trajectory. In contrast, the uncoated specimen displays a more pronounced crack opening effect. Further, as shown in Figures 3(c) and 3(d), the primary cracks perpendicular to the direction of cyclic stress loading mainly propagate through transcrystalline fracture, but there are different deflections occurring at grain boundary (GB) intersections for both coated and uncoated specimen. For instance, the crack in the coated specimen exhibits 16 deflections across 25 grains while 7 deflections in uncoated specimen (9 grains). Furthermore, crack branching within the grains is evident in the coated specimen, which is correlated with the appearance of plastic slip lines. In addition, with regard to the specific interactions at the GBs, the crack is deflected 11 times in the coated specimen and 6 times in the uncoated specimen.
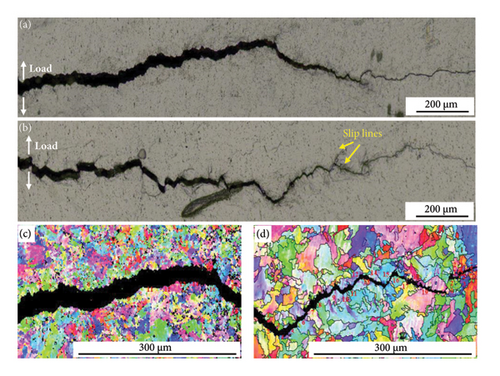
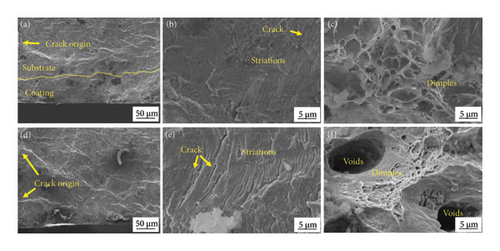
Figure 4 depicts the surface fracture morphology of both coated and uncoated specimens under a stress ratio of 0.1. The fracture surface of the coated specimen is characterized by the presence of two distinct regions, with the coated area exhibiting more pronounced and steep ravines as compared to the uncoated specimen, as illustrated in Figures 4(a) and 4(d). This indicates that the fracture process involves a greater degree of crack deflection and energy dissipation. Furthermore, the presence of striations and cracks is evident in both the coated and uncoated specimens, as illustrated in Figures 4(b) and 4(e), but higher density of striations is observed in the coated specimen. In general, a higher density of striations indicates a greater number of load cycle repetitions. Therefore, the rate of crack growth for the coated specimen is reduced. Moreover, the presence of voids and dimples in Figures 4(c) and 4(f) shows typical features of ductile fracture characteristics.
3.3. Damage Identification Using AE Parameters
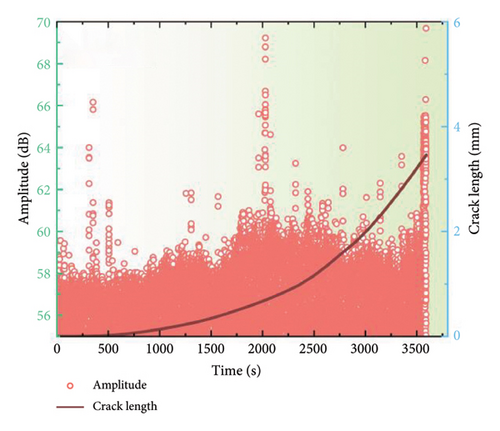
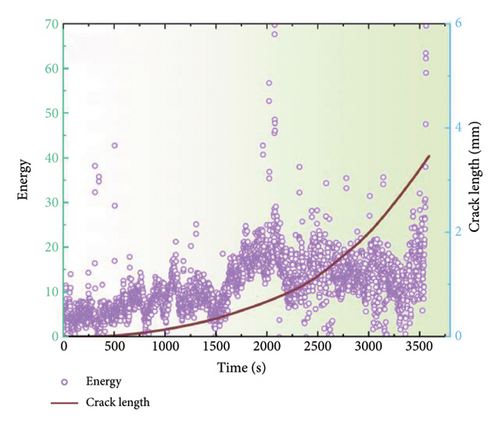
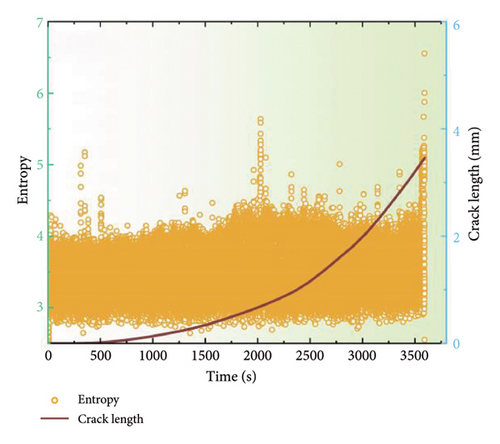
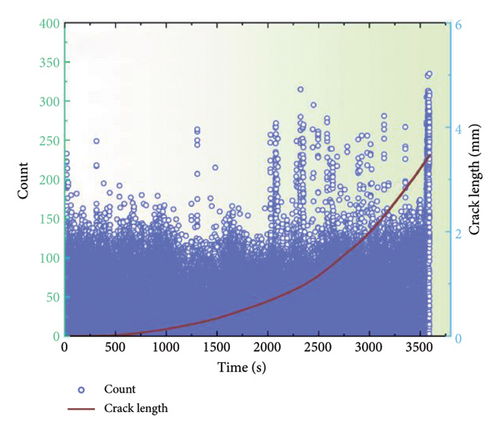
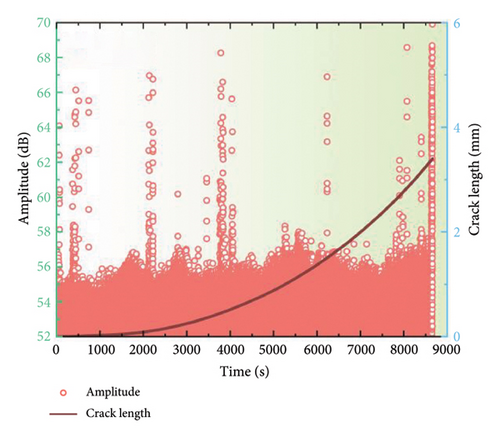
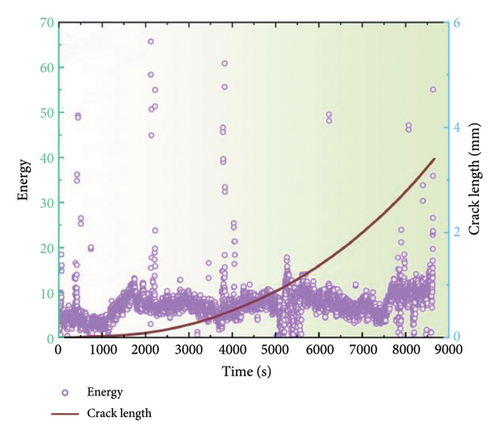
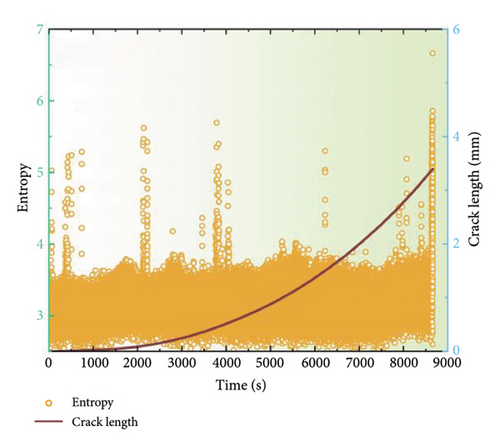
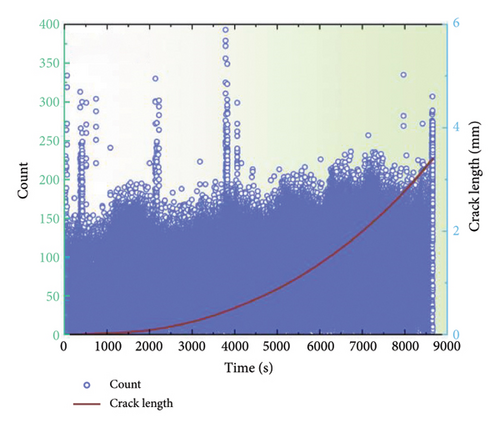
AE signals are generated in conjunction with the material once fatigue cracking occurs. To obtain more insightful results, four AE parameters, peak amplitude, entropy, energy, and count, were selected and analyzed to distinguish the various stages of fatigue damage. Figure 5 depicts the alterations in these time-domain parameters throughout the fatigue loading process for the coated specimens at a stress ratio of 0.1. The evolution of the AE parameters enables the identification of three distinct damage stages: the crack initiation stage, the steady-state crack propagation stage, and the ultimate fracture stage. Generally, a multitude of AE signals characterized by high energy and entropy would be identified during the crack initiation stage. And these signals could be associated with plastic deformation at the notch tip and the initiation of cracking because there is minimal visible crack growth at this stage. During steady-state crack growth stage, the AE parameters demonstrate a gradual increase. Nevertheless, with the ending of this crack growth stage, the rate of crack expansion accelerates, and hence the associated AE signals become increasingly active, indicating an imminent transition to the failure fracture stage. Additionally, a limited number of high-amplitude, high-energy, and high-entropy AE parameters are observed during the failure fracture stage. However, the number of such phenomena does not increase significantly, which can be attributed to the rapid destruction and fracture of the specimen under a short loading duration. It is noteworthy that AE signals with amplitudes approaching 66 dB, energies of approximately 70, and entropies exceeding 5 are particularly evident during this stage. Furthermore, the data demonstrate a comparable upward trend throughout the FCG stage, indicating a consistent relationship between these parameters and the fatigue damage. Consequently, it could be concluded that the AE technique could effectively distinguish the three distinct stages. Similar results were also reported in previous work [30].
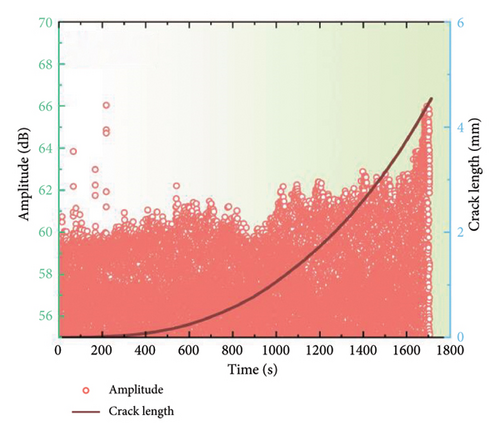
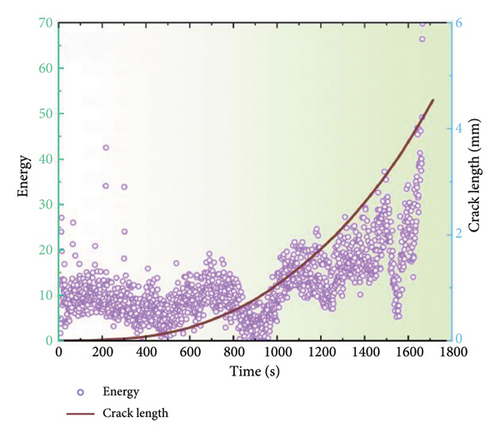
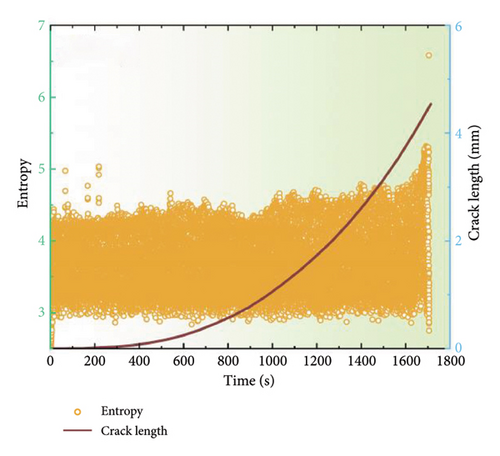
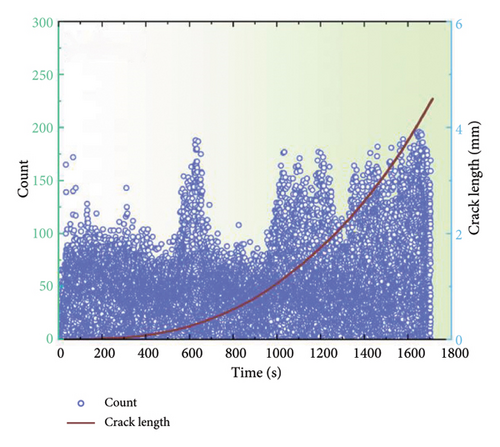
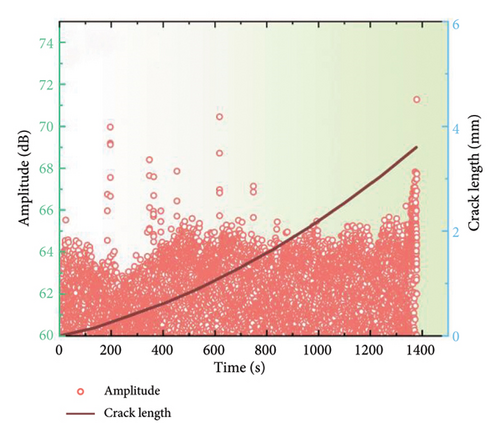
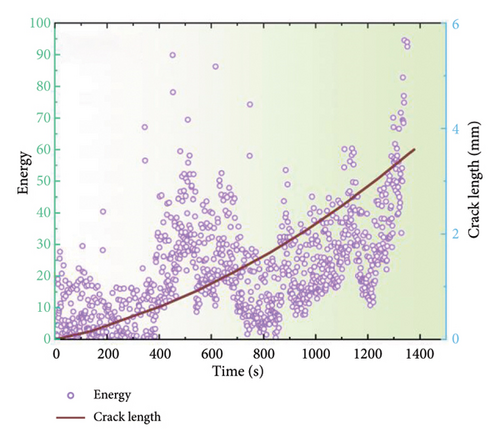
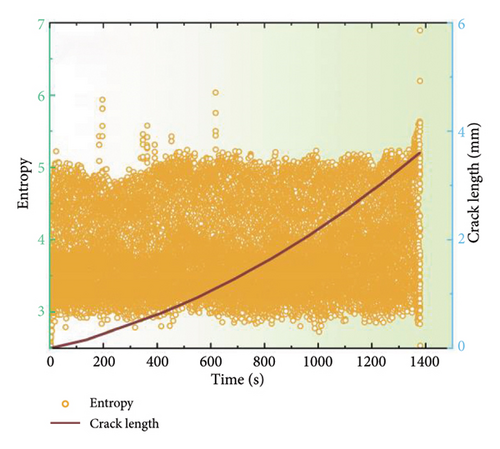
Figure 6 illustrates the damage identification outcomes for uncoated samples subjected to a stress ratio of 0.1. Similarly, the discernible AE parameters facilitate the unambiguous delineation of the three damage stages. However, a notable increase occurs during the second stage, which may be attributed to noise interference from the testing procedure. Furthermore, the AE signals from the uncoated specimen appear to be more intense than those from the coated specimen. For instance, while the amplitude of the coated specimen was below 60 dB at the onset of fatigue loading, the uncoated specimen already has a minimum amplitude of 60 dB. This is because the uncoated specimen has a lower thickness. Concretely, under the plane stress state, the tensile stress of the uncoated specimen is higher and the stress perpendicular to the specimen surface is closer to zero due to its relatively smaller thickness, resulting in shear stresses. In this case, because the shear crack growth can emit AE signals with much higher duration and rising time as compared to those of ductile crack growth [32], there would be a lower amplitude for the uncoated specimen.
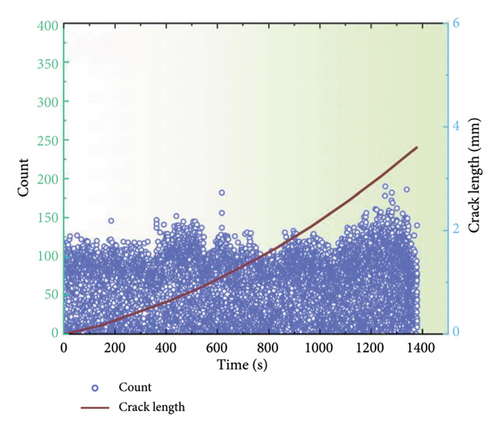
Figures 7 and 8 depict the temporal alterations in AE parameters for the coated specimen at a stress ratio of 0.3 and 0.5, respectively. Similar AE characteristics during FCG to those at a stress ratio of 0.1 are observed. The progression of amplitude, energy, and entropy parameters provides a clear delineation of the three stages of FCG. At the onset of crack initiation, a concentration of high AE signals characterized by high amplitude, entropy, and energy is observed. As the crack progresses into the steady-state growth stage, a reduction in amplitude, energy, and entropy is evident, followed by a gradual increase. During the failure stage, all AE parameters surge abruptly, indicating the imminent destruction of the specimen. However, it is noteworthy that the amplitude for a stress ratio of 0.1 typically remains below 60 dB with an energy maximum of 70, while the amplitude for a stress ratio of 0.5 is reduced to 55 dB, and the energy maximum does not exceed 50. These findings indicate that alterations in the stress ratio have strong influence on the discernment of FCG from AE data, emphasizing the imperative for further investigation to optimize AE parameters for accurate fatigue damage identification.
3.4. Quantitative Relationships Between AE and FCGR
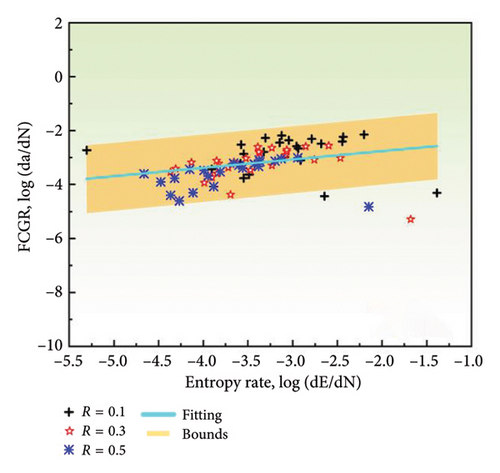
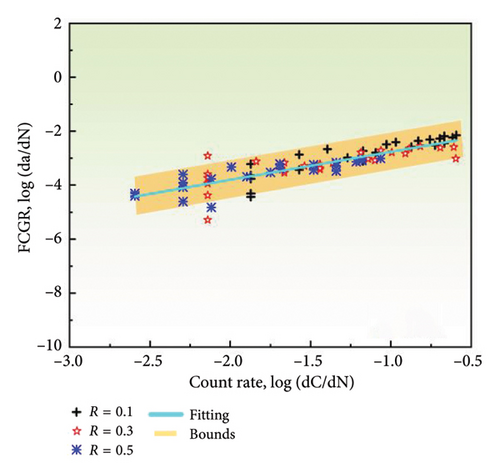
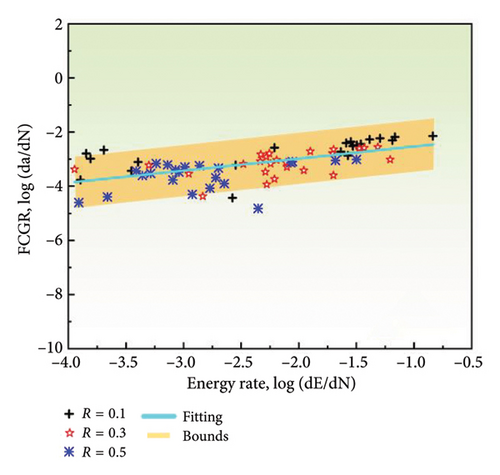
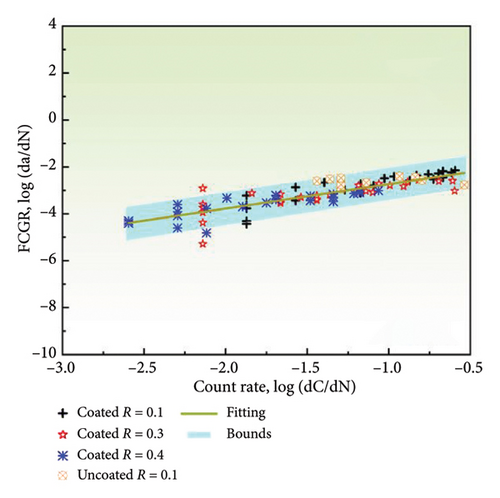
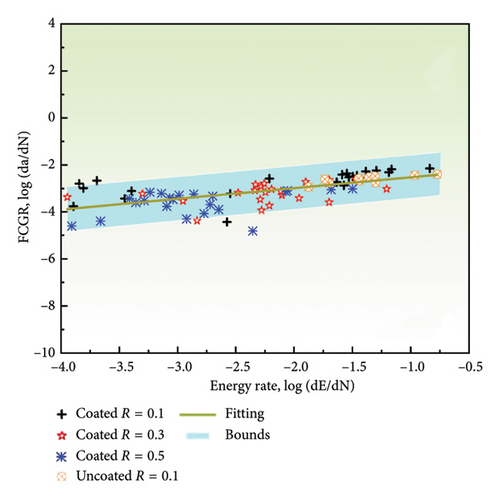
The correlation between the change rates of entropy, count, energy, and amplitude with the FCGR on a log-log plot is illustrated in Figure 9. It is evident that there is a linear relationship between the rates of all AE parameters and the FCGR, with the majority of data points falling within the 95% prediction interval of the regression curve. However, the extent of overlap in the fits for the various AE parameters is different. The count rate displays the highest level of goodness of fit, with the majority of data points exhibiting a close alignment with the regression line. In contrast, a subset of amplitude data points falls outside the prediction interval, showing the poorest goodness of fit. The linear fit parameters are presented in Table 2. The AE count rate displays the most optimal fit among all the parameters, with the smallest sum of squared errors (SSE) of 8.4790 and the highest R-squared value of 0.7268. This indicates that the count rate data are in close adherence to the regression line, thereby making it the most suitable parameter for monitoring in conjunction with the FCGR. The count rate demonstrates a lower degree of dependence on predetermined thresholds and effectively captures the variability of the AE data. Conversely, the AE amplitude rate exhibits the poorest fit, with an SSE of 22.8836 and an R-squared of 0.0102. The larger SSE and smaller R-squared values indicate that monitoring FCG using amplitude-based parameters is prone to higher errors. This is potentially due to the fact that the amplitude is significantly affected by the chosen thresholds. This emphasizes the importance of selecting the appropriate AE parameters for accurate damage assessment.
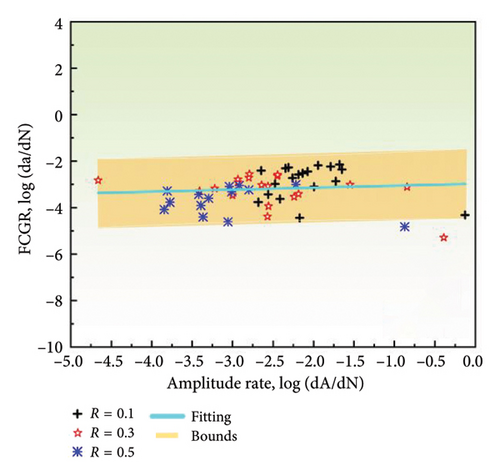
| AE parameters | Slope | Intercept | SSE | R-square |
|---|---|---|---|---|
| Entropy rate (without uncoated) | 0.3108 | −2.1399 | 23.9241 | 0.1066 |
| Count rate (without uncoated) | 1.0396 | −1.7241 | 8.4790 | 0.7268 |
| Energy rate (without uncoated) | 0.4448 | −2.0910 | 13.6783 | 0.3956 |
| Amplitude rate (without uncoated) | 0.0858 | −2.9743 | 22.8836 | 0.0102 |
| Entropy rate (with uncoated) | 0.2318 | −2.3871 | 32.6005 | 0.0608 |
| Count rate (with uncoated) | 1.0397 | −1.6932 | 10.0553 | 0.7103 |
| Energy rate (with uncoated) | 0.4636 | −2.0602 | 16.6699 | 0.4143 |
| Amplitude rate (with uncoated) | −0.0169 | −3.1898 | 33.0199 | 0.0003 |
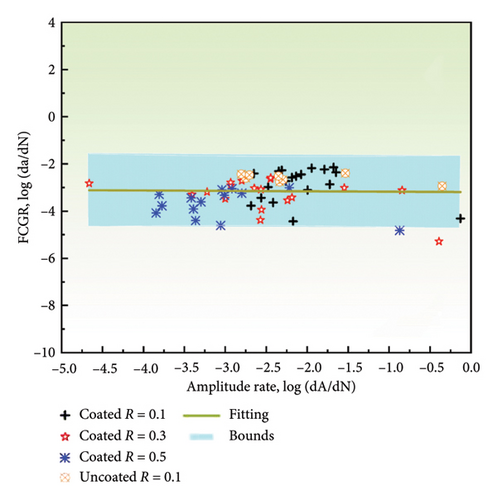
Further, the goodness of fit for different AE parameters alters significantly when uncoated data are incorporated into the regression analysis, as shown in Figure 10. The SSE and the R-squared value for the amplitude parameter are 33.0199 and 0.0003, respectively, showing a 44.29% increase in SSE and a 97.06% decrease in R-squared compared to the values obtained in the absence of AE data of uncoated specimen (Figure 9). In contrast, the SSE and R-squared for the count parameter are 10.0553 and 0.7103, respectively, which are similar to the results in Figure 9. Hence, the material type has a minimal effect on the fit parameters for the count. However, all AE parameters exhibit a linear relationship with the FCGR on a logarithmic scale, which is beneficial for subsequent monitoring and predictive purposes. Furthermore, the correlation between AE parameters and FCGR remains consistent under different stress ratios. And the count and energy parameters demonstrate less sensitivity to material variations and hence have superior capability to obtain goodness of fit. Consequently, the count, energy, and entropy parameters should be prioritized for their robustness and reliability in assessing FCGR under various experimental conditions.

4. Discussion
4.1. The Influence of HEA Coating on FCG Behaviors
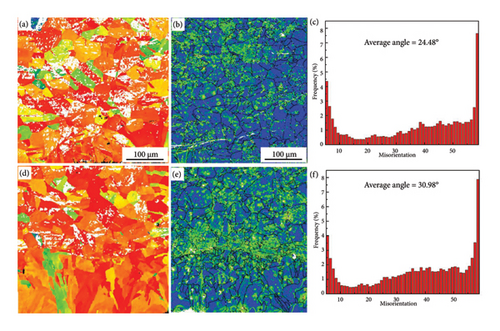
Generally, the magnitude of the Schmid factor is a critical determinant of the activation of a slip system: the lower the Schmid factor values, the more difficult for slip system to activate. In this case, there would be higher stress concentration and a subsequent increase of crack propagation for materials with higher Schmid factor [45, 46]. Once a critical level of defects has been reached, the fatigue crack is able to traverse the grain more easily, thereby accelerating the rate of crack propagation. As illustrated in Figures 11(a) and 11(d), the Schmid factor is observed to be lower on the surface of the coated specimen as compared to the uncoated specimen. Consequently, crack initiation rate of the coated specimen is reduced. However, the higher Schmid factor within the coated specimen indicates stress concentration is higher, which would facilitate crack expansion once the crack has progressed to a certain extent. In addition, the available evidence suggests that the specimens with a more irregular crack path tend to exhibit a slower crack growth rate and greater resistance to crack propagation [47–49]. Such conclusion could be verified by the experimental results in this work, where a more heterogeneous FCG path could be observed in the coated specimen. GBs are acknowledged as significant impediments to the FCGR. The misorientation angle is therefore considered to be a pivotal parameter that reflects the resistance of GBs to crack propagation. The critical stress required for a dislocation to penetrate the GB increases with the misorientation angle of the GB, as reported by previous studies [50, 51]. In other words, larger GB misorientation angle typically correlates with greater resistance to FCG and slower crack growth rate. In general, fatigue cracks tend to propagate in a relatively direct path when the misorientation angle is below 20°. Conversely, the rate of crack propagation is significantly reduced when the misorientation angle exceeds 30° [52, 53]. The weighted-average GB misorientation angles for the coated and uncoated specimens are 30.98° and 24.48°, respectively, as illustrated in Figures 11(c) and 11(f). This discrepancy indicates that the coated specimen exhibits enhanced resistance to FCG and a reduced crack growth rate, which contributes to the more complex crack trajectory (Figures 3(a) and 3(b)).
4.2. Prediction of FCG
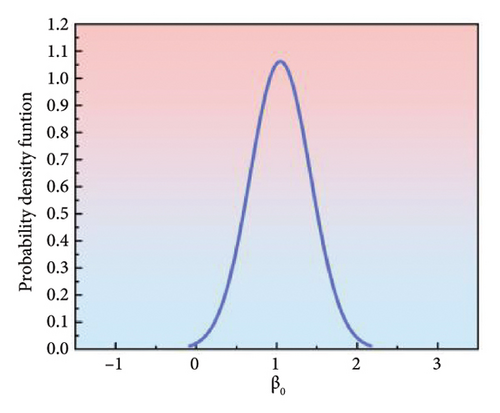
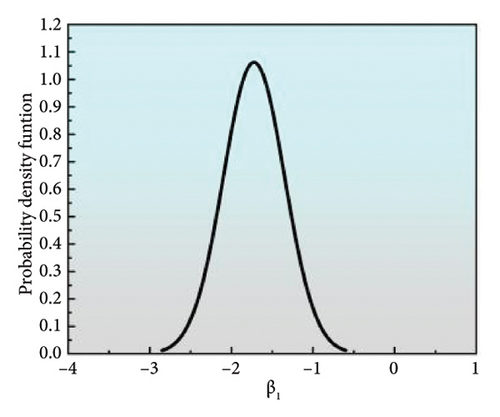
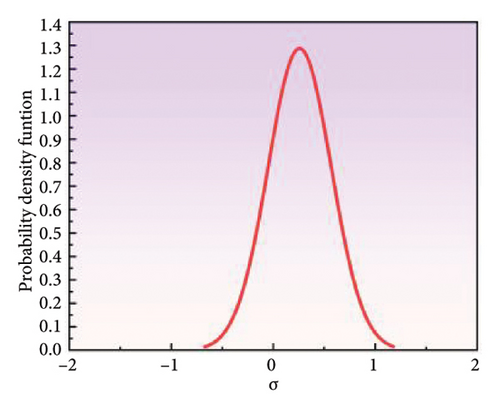
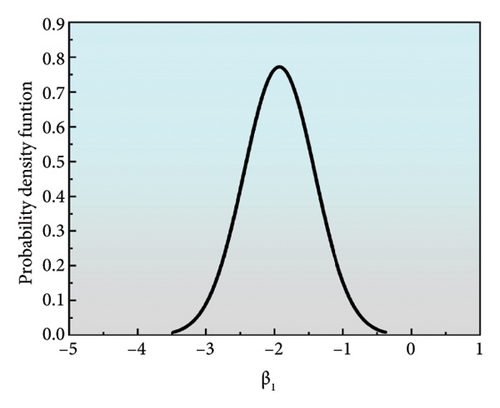
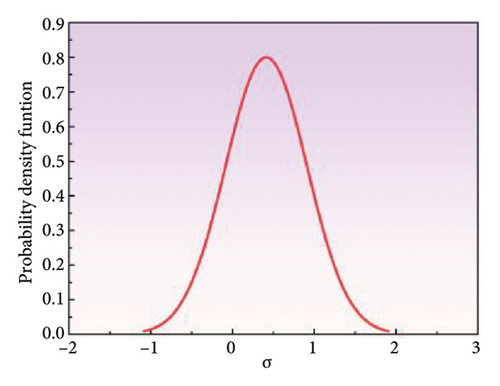
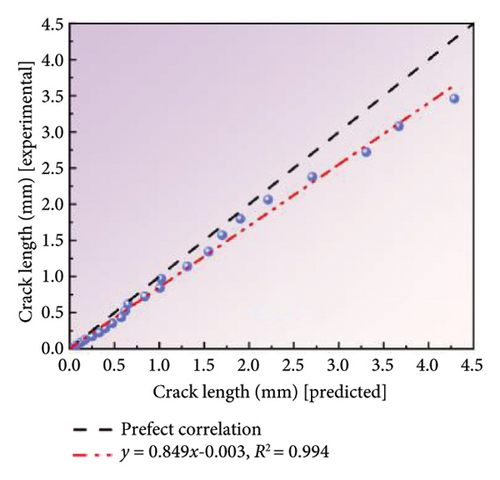
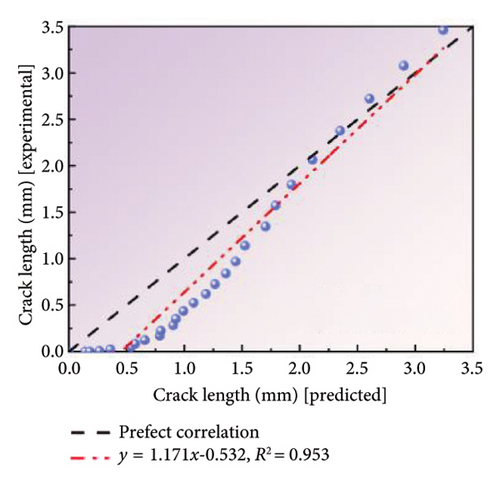
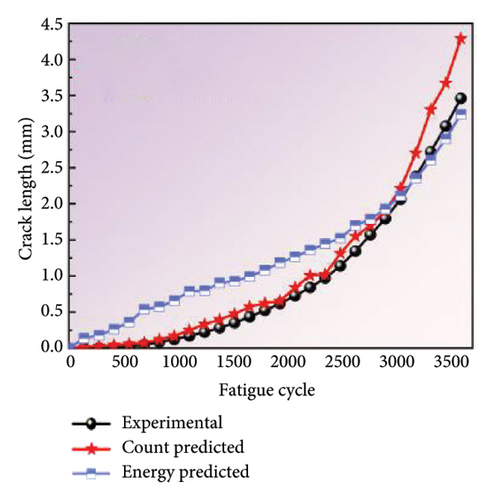
The coated specimens with 0.3 stress ratio were selected for model validation purposes, while the remaining data points were employed for model calibration and estimating the posterior distributions of the model parameters. The posterior distributions of the count and energy model parameters, as illustrated in Figures 12(a), 12(b), 12(c), 12(d), 12(e), and 12(f), are employed to predict the FCGR using new AE data. As illustrated in Figures 12(g) and 12(h), a general alignment between the predicted and actual crack lengths could be observed. Specifically, when the predicted values are plotted on the x-axis and the actual values on the y-axis, the data fitting results show that the slope and R-squared of the count-based prediction are 0.849 and 0.994, respectively, while the energy-based predictions exhibit a slope and R-squared of 1.171 and 0.953, respectively. Such results indicate the good agreement between modeling and experimental results. Moreover, the data points are distributed around the line of perfect correlation, with the predicted count parameter exhibiting a greater degree of alignment with the actual values than the energy parameter. It is noteworthy that the prediction results of count model initially adhere closely to the line of perfect correlation before gradually diverging. In contrast, the prediction results of energy model start with a worse fit and then show a tendency to moderate more significantly. Figure 12(i) provides a visual concordance between experimental and predicted values, illustrating the strong correlation between fatigue life and crack length as predicted by different parameters. The predicted crack sizes agree well with the measured values, notwithstanding some discrepancies. Therefore, using the count parameter are more closely aligned with actual observations during the initial stages. Conversely, as the steel reach closely to fracture point, using the energy parameter are more closely aligned with actual observations. Thus, a combination of AE parameters can enhance the precision of crack monitoring during actual testing.

5. Conclusion
- 1.
The HEA coating could improve the fatigue life of 321 steel by 21.43% by mainly retarding the crack initiation rate. This is because the dislocation density of the coated steel was increased significantly due to the presence of the HEA coating during FCG testing, which would impede the activation of the slip system. Hence, the crack initiation was suppressed. Moreover, lower stress ratio would lead to shorter fatigue life.
- 2.
AE count and energy are the better parameters for identifying and monitoring the fatigue damage. The FCG model based on AE count agrees well with experimental results at crack initiation and steady-state propagation stage, while the FCG model based on AE energy shows good prediction capability at the failure fracture stage. Therefore, various AE parameters can be comprehensively considered and combined to monitor FCG behaviors more accurately.
Conflicts of Interest
The authors declare no conflicts of interest.
Author Contributions
Wei Li: conceptualization; data curation; formal analysis; funding acquisition; methodology; writing – original draft; and writing – review and editing. Shengnan Hu: methodology; writing – original draft; and writing – review and editing. Shunpeng Zhu: conceptualization; data curation; supervision; funding acquisition; and methodology. Cong Li: conceptualization; data curation; supervision; funding acquisition; and methodology. Guowei Bo: conceptualization; data curation; and writing – review and editing. Chipeng Zhang: data curation; formal analysis; and software. Dapeng Jiang: data curation; formal analysis; and software. Hui Chen: data curation; formal analysis; and software. Jianjun He: data curation; formal analysis; and software. Wenjun Duan: data curation; formal analysis; and writing – review and editing. Jian Chen: conceptualization; data curation; formal analysis; funding acquisition; and methodology.
Funding
The authors received financial support from the National Natural Science Foundation of China (Grant nos. 52475149, 12232004, and 52075048), National Natural Science Foundation of Hunan (Grant no. 2023JJ30025), Science and Technology Innovation Program of Hunan Province (2023RC1058), Hunan Provincial Association for Science and Technology Talent Raising Program—Young and Middle-Aged Training Objects (2022TJ-Q02), Hunan Provincial Department of Education Science and Technology Research General Project (23C0143), and Hunan Students’ Platform for Innovation and Entrepreneurship Training Program (S202310536117).
Open Research
Data Availability Statement
The data that support the findings of this study are available on request from the corresponding authors. The data are not publicly available due to privacy or ethical restrictions.


