Temperature Monitoring of Mass Concrete Structure Using Wireless Sensing System
Abstract
Rapid temperature changes during the early stages of mass concrete construction can cause thermal cracking, which negatively impacts structural integrity and longevity. Reliable temperature monitoring is essential for effective crack control. Traditional methods, such as manual inspections and wired structural health monitoring systems, are often hindered by high labor costs and maintenance challenges, limiting their effectiveness for large-scale applications. This paper presents the development of a wireless temperature sensing system designed to overcome these challenges. Both the hardware and software architectures of the wireless sensing unit are detailed. The system is characterized by easy deployment, low power consumption, and long-distance wireless communication, making it suitable for large-scale monitoring of concrete structures. To address data anomalies caused by wireless transmission failures, the sensing system includes robust data anomaly detection and recovery algorithms, ensuring reliable measurements. A prototype system was fabricated and field-tested on a massive concrete structure, validating the effectiveness of the sensing system. The experimental results demonstrate that the wireless temperature sensing system can reliably monitor the temperature distribution of mass concrete structures during construction, providing measurement data for preventing thermal cracking and ensuring structural integrity.
1. Introduction
Temperature monitoring is crucial for maintaining the structural integrity and longevity of mass concrete structures. During concrete placement, the hydration of cement generates significant heat. The outer edges of the concrete element dissipate heat faster than the core, creating a temperature gradient between the hotter core and the cooler edges. This temperature difference induces stresses that can potentially result in thermal cracking [1]. In addition, early-age thermal cracking is particularly concerning during the initial days after pouring, as rapid temperature changes can induce stresses in the still-hardening concrete [2, 3]. Such thermal stresses and cracking can compromise the structural integrity, leading to costly repairs, reduced durability, and even in extreme cases, catastrophic failure of the structure. Continuous monitoring during the construction period allows for timely adjustments in curing practices, such as using curing blankets or insulation to maintain a stable temperature field [4].
Traditionally, temperature monitoring in mass concrete structures has involved manual checks and wired structural health monitoring (SHM) systems [5, 6]. Manual checks use handheld thermometers to measure temperatures at specific points. This method is simple and cost-effective but lacks the precision and continuous monitoring capabilities required for large structures. Wired SHM systems utilize temperature sensors, such as thermocouples [7], resistance temperature detectors [8], and distributed optical fiber sensors [9], placed at various depths and locations to capture a detailed temperature distribution. Data loggers record the collected data, providing continuous monitoring and thorough analysis over time. Despite their accuracy and reliability, wired systems present significant drawbacks, such as complicated installation, increased labor costs, and maintenance challenges in harsh construction environments where cables are prone to damage [10].
Recent advancements in wireless sensing systems offer significant benefits for SHM [11, 12]. Key advantages include ease of installation, scalability, cost-effectiveness, and enhanced durability. Wireless sensing systems eliminate the need for extensive wiring, simplifying installation and reducing both time and labor costs. These systems are highly scalable, ideal for large and complex structures, allowing sensors to be easily added or repositioned as needed. Furthermore, the reduction in installation and maintenance labor lowers the overall cost of implementing these systems. Barroca et al. [13] illustrated the use of wireless communications to eliminate cables in a temperature monitoring system, demonstrating both the feasibility and cost-effectiveness of wireless temperature sensing systems. Lee et al. [14] developed an integrated wireless sensor network (WSN) for curing management of early-age concrete at construction sites. Through experimental validation, the proposed WSN highlights the practicality of improving the quality control of the concrete curing process. Regarding the architectural design of wireless SHM systems for temperature sensing, Cabezas et al. [15] proposed a compact embedded wireless sensor system which features reliable temperature measurements within the harsh concrete environment. The sensor system was validated through both laboratory and field tests, demonstrating its practicality and reliability for real-world applications. Zuo et al. [16] developed a remote real-time monitoring system (RRTMS) based on IoT wireless technology and cloud computing to determine concrete strength during the construction of high-rise buildings. The system integrates thermistor temperature sensors, wireless data transmission, and cloud servers to enable real-time monitoring, data analysis, and early warning for improved construction quality and safety. In addition to systems specifically designed for temperature monitoring of concrete structures, many other research efforts have also been made in the development of generic wireless sensing systems. These studies provide valuable insights and methodologies on the power consumption, data rate, and communication range that can be effectively adapted for temperature sensing applications. Interested readers are referred to [17–24] for more details.
However, wireless SHM systems face several unique technical challenges [25]. Because wireless sensing units typically rely on batteries with limited energy supplies, research has centered on two primary strategies. The first aims to reduce energy consumption through optimized system architectures and configurations. For instance, Geoffrine and Geetha [26] developed a wireless SHM architecture employing energy-efficient routing and optimized sensor node placement. Fu and Zhu [27] developed a demand-based wireless smart sensor system for sudden event monitoring, integrating an ultra-low-power trigger accelerometer mechanism to address power consumption challenges. This trigger mechanism enables the system to remain in a low-power state during standby and rapidly activate upon detecting a sudden event such as an earthquake. The second strategy focuses on more efficient energy harvesting from environmental sources such as wind, vibration, sound, heat, and radio frequency (RF) signals. Rubes et al. [28] introduced a self-powered wireless vibration sensor node equipped with a vibration energy harvester, and Luo et al. [29] designed RF energy-powered sensor nodes that convert RF signals into usable energy. Although wireless energy transfer and passive solutions have also been explored [30–32], current harvesting techniques remain insufficiently mature and stable to provide a reliable, convenient, and low-cost power solution for large-scale, long-term monitoring applications.
In addition to energy constraints, wireless data transmission is inherently less reliable than cable-based systems, with performance diminishing over longer communication distances. Limited bandwidth further impedes high-speed, real-time data acquisition from multiple sensors. To address these issues, error-correcting codes such as low-density parity-check (LDPC) codes and turbo codes, along with hybrid automatic repeat request (HARQ) and adaptive modulation technologies, have been employed to enhance signal reliability [33–35]. Meanwhile, edge computing techniques process data locally, thus reducing transmission volumes and optimizing network resource usage [36, 37]. Nevertheless, construction-specific optimizations remain necessary to achieve practical, large-scale implementation of wireless sensing systems in demanding field environments.
The wireless temperature sensing system presented in this study is tailored for large-scale, low-power SHM applications in mass concrete structures, thereby addressing several of these technical challenges. By carefully selecting system components, it achieves a balance between low energy consumption and extended transmission range. The host processor implements low-power modes to further reduce energy use. To enhance the reliability of data transmission and storage, local data storage at each sensing unit buffers data during transmission outages, ensuring no data are lost. Data anomaly detection and recovery algorithms in the central server further ensure data integrity. In typical temperature monitoring applications, the sampling interval is usually 10 min or longer [38, 39], making data synchronization less critical than in other SHM applications such as dynamic response sensing for modal analysis, and the available wireless bandwidth is sufficient for this application.
The rest of the paper is organized as follows. Section 2 describes the temperature monitoring plan for a mass concrete structure, highlighting the need for a wireless temperature sensing system. Section 3 presents the prototype of the wireless sensing unit, detailing major circuit components and key hardware performance features, along with aspects of the system software design, employing a state machine concept for robustness. Section 4 discusses data anomaly detection and recovery algorithms, using experimental data to assess the performance of the wireless sensing system. Finally, Section 5 provides conclusions and suggestions for future work.
2. Temperature Monitoring Plan
2.1. General Description of the Project
This study examines the raft foundation, characterized by a cylindrical structure. The raft foundation has a radius of 27 m and a thickness of 3.7 m, which is shown in Figure 1.
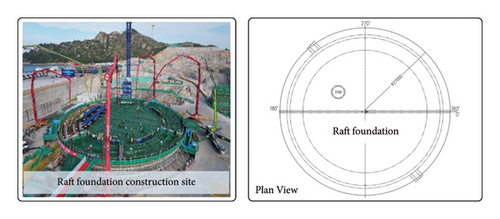
Mass concrete classification varies by region: the United States defines it as concrete with a member of dimension of at least 4 ft [40], Canada uses 1 m [41], and China defines it as concrete larger than 1 m or prone to cracking from temperature and shrinkage [8, 42]. A 3.7-m-thick raft foundation is classified as mass concrete. Hydration heat generates complex temperature and stress fields, increasing crack risk, making temperature monitoring essential for proper curing and quality control.
2.2. Materials and Environmental Conditions
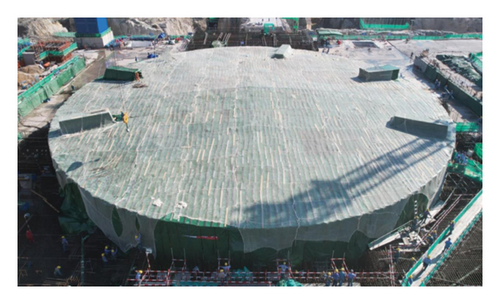
Ready-mixed concrete is utilized for pouring the raft foundation, specifically using C45 concrete. Concrete pouring and curing of the raft foundation took place from June to July, with the average daily maximum temperature 33.8°C and the average daily minimum temperature 27.4°C according to weather statistics from the past 5 years. A 68-h continuous pouring was followed by curing. A curing shed was erected 76 h later, with insulation layers on the top and sides, as shown in Figure 2. The shed was removed on Day 39, and all curing materials by Day 44.
2.3. In Situ Temperature Monitoring Deployment
- a.
0° direction: Four points are selected at 6.5 m (No. 1), 13.5 m (No. 2), 22 m (No. 3), and the radius point (No. 4).
- b.
45° direction: Three points are selected at 13.5 m (No. 5), 22 m (No. 6), and the radius point (No. 7).
- c.
90° direction: Four points are selected at 6.5 m (No. 8), 13.5 m (No. 9), 22 m (No. 10), and the radius point (No. 11).
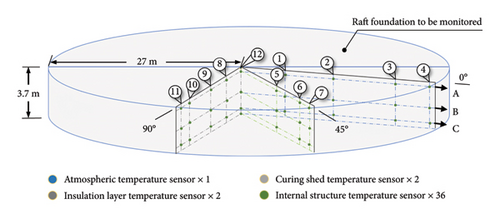
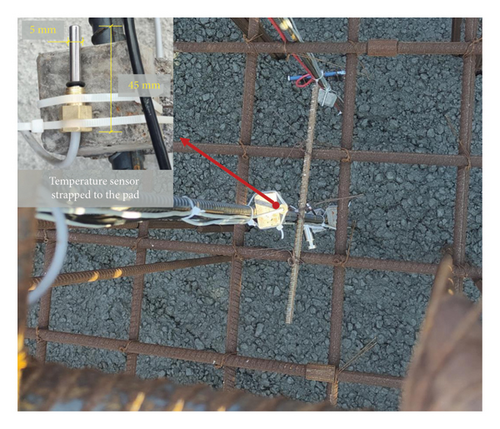
In addition to the raft foundation’s center point (No. 12), temperature sensors are installed at the upper, middle, and lower layers at each point, as shown in Figure 4. Sensors are numbered by position, e.g., 6-A denotes the upper layer sensor at point No. 6. There are also one atmospheric temperature sensor, two sensors for the insulation layer, and two for the curing shed. Prior to concrete pouring, sensors were pre-embedded and securely fastened to concrete spacers and reinforcement bars to ensure stability. To enhance durability in the concrete environment, it is housed in the protective casing composed of a pure copper base and a 304 stainless steel probe, with dimensions of 45 mm in length and 5 mm in diameter, as shown in Figure 4. This design offers excellent thermal conductivity, corrosion resistance, and mechanical strength, ensuring reliable performance throughout the monitoring period.
2.4. Monitoring Requirements
In mass concrete temperature monitoring, traditional wired systems often require placing the monitoring office near the structure, and the extensive cabling can disrupt ongoing construction activities. This study aims to address the specific monitoring requirements in large-volume concrete projects to improve the effectiveness and practicality of quality control. The monitoring requirements are categorized into three main aspects.
2.4.1. Long Duration
To ensure construction quality and meet regulatory standards, continuous temperature monitoring is essential throughout the several weeks of pouring and curing period. The monitoring system must be efficient and operate reliably over the long term, with minimal energy consumption.
2.4.2. Low Frequency and High Precision
Temperature data can be collected at low frequencies, with intervals ranging from 10 to 20 min. Each data transmission should include readings from all sensor points, typically numbering in the dozens. The system must ensure data completeness and accuracy, tracking critical parameters such as maximum temperature, cooling rate, and temperature differentials, and providing essential guidance for appropriate curing measures.
2.4.3. Minimizing Site Impact
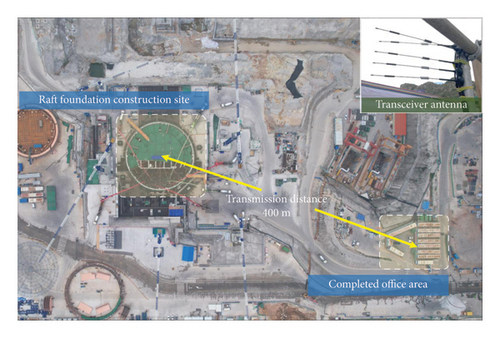
Considering that the nearest office area is approximately 400 m from the construction site (Figure 5), advanced long-distance wireless technology is preferred over complex and lengthy cable-based data transmission to minimize disruption. Additionally, the system should ensure robust and reliable data transmission in complex environments through high interference resistance, a compact design, and ease of deployment.
To address the monitoring needs and challenges mentioned above, a wireless temperature sensing system was developed. The system features easy deployment, low power consumption, long-distance wireless communication, and high precision, making it well suited for large-scale concrete structure monitoring. Additionally, it incorporates efficient data anomaly detection and recovery algorithms to ensure reliable measurements and data integrity, even in the presence of wireless transmission failures.
3. Wireless Sensing Unit
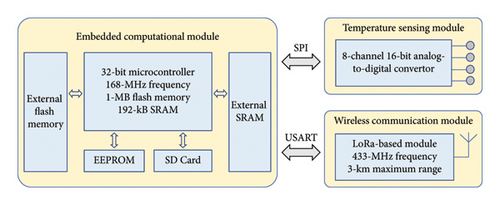
The prototype temperature monitoring system features an integrated hardware and software design to implement a simple yet effective star-topology WSN. This network consists of multiple wireless sensing units connected to temperature sensors, all coordinated by a central server. In this system, the central server, which can be a computer connected to a compatible wireless transceiver, commands all wireless sensing units to conduct data collection, receives measurement data from them, and stores the data in files. The wireless sensing units are responsible for acquiring sensor measurements and transferring the data to the central server for storage. The functional properties of the system rely on the design of the individual wireless sensing units, the function diagram of which is presented in Figure 6. This section details the design and development of the wireless sensing system for monitoring the temperature of mass concrete structures.
3.1. Embedded Computational Module
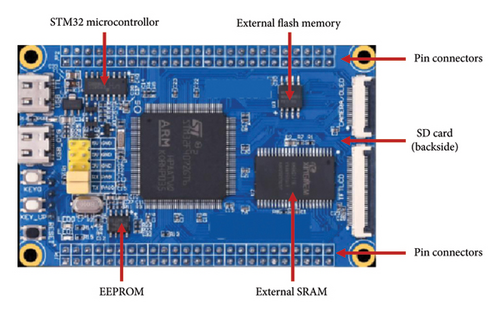
The wireless sensing unit is powered by an STMicroelectronics STM32F407ZGT6 microcontroller, featuring an ARM Cortex-M4 core running at 168 MHz, with 1 MB of flash memory and 192 KB of SRAM. It supports various communication interfaces (SPI, I2C, SDIO, CAN, and USART) for seamless integration with other components, and its timer and interrupt modules enable precise sensor sampling. With a focus on power efficiency, the microcontroller operates at around 90 mA with all peripherals active and offers low-power modes to extend battery life. Additional storage includes onboard EEPROM for essential data, an external 1-MB SRAM chip, a 16-MB flash memory chip, and an SD card for temperature data backup. The PCB size is approximately 8 cm by 5 cm, as shown in Figure 7.
3.2. Temperature Sensing Module
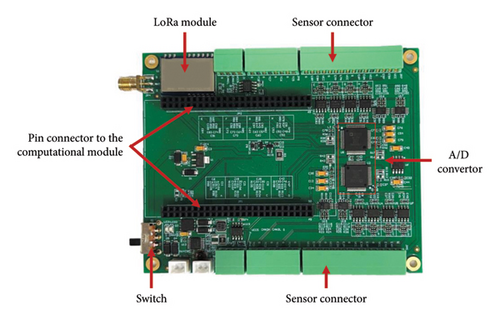
Each wireless sensing unit operates as an autonomous node within the wireless monitoring system, tasked with collecting and analyzing data from multiple sensors. The sensing interface module in each unit incorporates two eight-channel, 16-bit analog-to-digital (A/D) converters, specifically Texas Instruments AD7606, to convert analog sensor signals into digital data recognizable by the microcontroller. These A/D converters can simultaneously interface with up to eight sensors, with their 16-bit resolution providing sufficient accuracy for temperature monitoring applications. The total 16 channels are allocated with eight channels for temperature measurement and eight channels for strain sensing. This study focuses primarily on temperature measurement, so strain sensing is not discussed.
In the designed wireless sensing unit, the temperature sensing module and the wireless communication module, detailed later, are integrated on the same PCB, as shown in Figure 8. This PCB interfaces with the embedded computational PCB through pin connectors.
3.3. Wireless Communication Module
The wireless communication module facilitates data exchange between sensing units and the data server, requiring high reliability, adequate range, and efficient data transfer rates for effective SHM network operation.
In this prototype system, each sensing node integrates a Semtech SX1278–based wireless communication module. This module connects to the microcontroller via a USART to handle data and radio command exchanges. The SX1278 employs the LoRa long-range modem, enabling extended data transmission distances and strong interference immunity while consuming minimal power. LoRa technology, designed for low power wide area networks (LPWANs), operates on license-free sub-gigahertz RFs. It uses chirp spread spectrum (CSS) modulation, where information is encoded through frequency chirps that vary linearly over time, enhancing communication robustness against multipath propagation interference.
To illustrate the advantages of LoRa technology in this scenario, Table 1 compares the parameters of commonly used wireless communication technologies.
| Technology | Frequency band | Transmission distance | Maximum data rate | Interference resistance | Low power consumption |
|---|---|---|---|---|---|
| Bluetooth | 2.4 G 802.15.1 | 1–10 m | 720 kbps | Low | Not supported |
| Wi-Fi | 2.4 G 802.11 | < 30 m | 11–54 Mbps | Medium | Not supported |
| ZigBee | 2.4 G 802.15.4 | < 100 m | 250 kbps | Low | Supported |
| NB-IoT | Licensed bands | 5–20 km | 200 kbps | Low | Not supported |
| LoRa | Unlicensed bands | < 10 km | 62.5 kbps | High | Supported |
As illustrated in the table, different technologies have distinct transmission ranges and data rates. Bluetooth and Wi-Fi are effective for short-range communications with high data rates but are unsuitable for large construction sites due to their limited range and lack of low-power support. ZigBee offers slightly longer communication distances compared to Bluetooth and Wi-Fi, along with moderate data rates and low power support. NB-IoT is ideal for wide-area monitoring but does not support low power consumption.
LoRa technology exhibits a superior communication range to other wireless technologies, alongside its low power consumption. These characteristics make LoRa particularly effective for temperature monitoring applications in large-scale concrete structures [43]. In typical temperature monitoring applications, the sampling interval is usually 10 min or longer, making data synchronization less critical compared to other SHM applications, such as dynamic response sensing for modal analysis and system identification. Additionally, in the designed wireless sensing system, each sensing unit connects four thermistors, generating 64 bits of data for each wireless transmission. The air data rate of LoRa adequately meets the requirements for this application. Considering these requirements, LoRa is selected after evaluating factors such as transmission distance, data volume, and power consumption requirements.
3.4. Energy and Lifetime of the Wireless Sensing System
The wireless sensing system employs a state machine model to ensure reliable data transmission, with the unit transitioning through various states, including initialization, data acquisition, acknowledgment, and low-power mode. In the event of transmission failures, the unit retries data transmission while remaining in low-power mode until the next acquisition cycle, thus continuously cycling between wake-up and low-power mode. In the low-power mode, the embedded computational module, LoRa module, and other components enter a low-power sleep state [44]. This switching helps extend system operation under limited energy conditions at the construction site.

3.5. Laboratory Test
To validate the accuracy of the developed temperature measurement system, a series of laboratory tests were performed using a thermostat with a PID controller, the wireless sensing unit, and a mercury thermometer. The thermostat has a temperature range of −30°C to 100°C, with a measurement accuracy of 0.01°C and a uniformity of 0.01°C both horizontally and vertically. The thermostat was programmed to incrementally increase the temperature from 5°C to 95°C in 10°C steps, resulting in a total of 10 test groups. The temperature measurements obtained from the developed system were compared with those from the mercury thermometer and the thermostat. The experimental setup is illustrated in Figure 10.
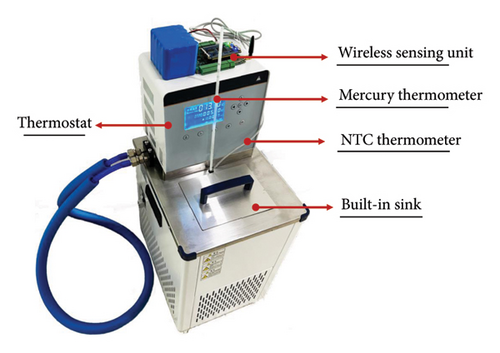
The accuracy of the wireless sensing unit and the thermostat reaches 0.01°C, and the mercury thermometer has an accuracy of 0.1°C. Table 2 presents the measurement results and corresponding relative differences. Across all 10 test groups, the relative difference between the wireless sensing unit and the thermostat remained within 0.1°C. Additionally, the measurements from the wireless sensing unit, after being approximated to one decimal place, were also close to those obtained from the mercury thermometer. The comparison results indicate that the developed wireless temperature sensing unit meets the accuracy requirements for mass concrete temperature control. As the temperature increased, the wireless sensing unit maintained stable performance, demonstrating high accuracy and robustness.
| The wireless sensing unit (°C) | The thermostat (°C) | Difference with respect to thermostat (°C) | The mercury thermometer (°C) | Difference with respect to mercury thermometer (°C) |
|---|---|---|---|---|
| 5.14 | 5.11 | 0.03 | 5.1 | < 0.1 |
| 15.02 | 15.05 | −0.03 | 15.1 | < 0.1 |
| 24.98 | 25.05 | −0.07 | 25.0 | < 0.1 |
| 35.08 | 35.06 | 0.02 | 35.1 | < 0.1 |
| 45.02 | 45.09 | −0.07 | 45.0 | < 0.1 |
| 54.99 | 55.07 | −0.08 | 55.0 | < 0.1 |
| 65.03 | 65.05 | −0.02 | 65.1 | < 0.1 |
| 75.09 | 75.01 | 0.08 | 75.1 | < 0.1 |
| 85.03 | 85.06 | −0.03 | 85.0 | < 0.1 |
| 94.98 | 95.05 | −0.07 | 95.0 | < 0.1 |
4. Data Anomaly Detection and Recovery
4.1. Results From Temperature Monitoring
The harsh operational environment of the equipment introduces various types of anomalous data in the monitoring records, severely impacting data analysis and health monitoring accuracy. The raw monitoring data often contains these anomalies. Figure 11 displays a portion of the raw monitoring data, collected continuously for approximately 20 days after the start of concrete pouring. To facilitate clearer observation, data outside the range of 0°C–100°C have been preliminarily trimmed.
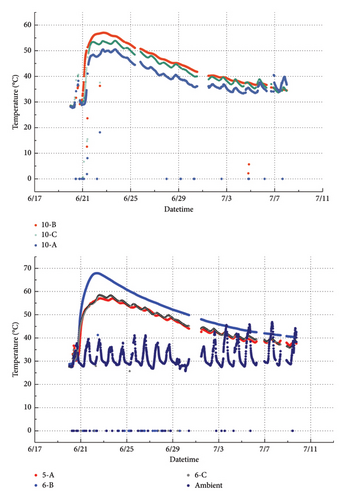
The expected temperature variations resulting from hydration heat in large-volume concrete should form a continuous curve. However, two common anomalies are evident in the raw data: missing values and outliers. Missing values typically occur due to external interference with the wireless signal, preventing proper data transmission. In such cases, data are backed up on an SD card. The pronounced discontinuities observed around July 1 resulted from power interruptions at the construction site, where environmental factors prevented the central server from receiving the monitoring data. Outliers often appear as abrupt, isolated spikes caused by voltage fluctuations in the data collection equipment. Data outside the range of 0°C–100°C have been preliminarily trimmed, causing most outliers in Figure 11 to cluster near 0°C, while others, generally below 30°C, remain outside the displayed curve.
The occurrence of anomalous data is random. Various methods for detecting and recovering anomalous data already exist, primarily divided into statistical probability methods and predictive models [49]. Statistical methods analyze the statistical characteristics of data, are easy to implement, and can work quickly once a model is established. However, they perform poorly in detecting complex anomalies and may require substantial computational resources for large datasets. While predictive model-based methods show promise, they require large datasets, high memory, and significant computational resources, making them unsuitable for resource-constrained environments or tasks requiring high real-time performance. Under these conditions, simpler, customized, and more efficient methods for detecting and handling anomalous data are preferred.
4.2. Framework of the Temperature Monitoring Data Processing Method
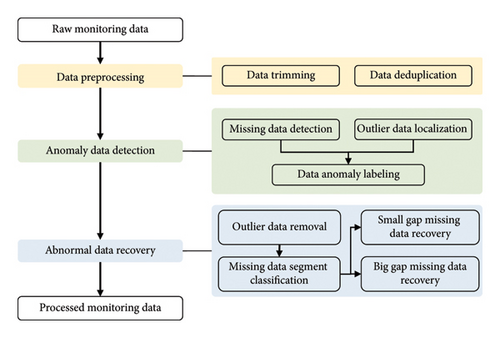
To address potential anomalies in monitoring data, a data processing method for mass concrete temperature monitoring systems is proposed. This method periodically evaluates and corrects anomalies in each data channel. It is simple, effective, and fast, meeting on-site requirements. The flowchart of the proposed hybrid model, shown in Figure 12, summarizes key processes including data preprocessing, anomaly detection, and anomaly recovery.
4.2.1. Data Preprocessing
Data preprocessing mainly includes data trimming and deduplication. Considering the typical temperature range of the concrete structure, data outside 0°C to 100°C range are clipped to these boundaries, and duplicate data are removed based on ID information and predefined sampling intervals. This prevents extreme values from skewing analysis and improves data stability and interpretability.
4.2.2. Anomaly Data Detection
4.2.2.1. Missing Data Detection
4.2.2.2. Outlier Data Detection
Lower quartile q1 and upper quartile q3 are the first and third quartiles, respectively. The median (q2) is the 50% of the value. The first quartile is the 25%, and the third quartile is the 75%. QR is the interquartile range, namely, QR = q3 − q1, which is a comparatively steady statistic in terms of the standard deviation. The lower bound is the QL and the upper bound is the QU of data, and any data lying outside these defined bounds can be considered an outlier. This method has a certain advantage that it can be employed even when data spots are not normally distributed because the quartile method relies on the median and not the mean of the samples.
4.2.3. Anomaly Data Recovery
- a.
Small gap missing data: The missing segments are short and do not exceed a predefined threshold. The surrounding data typically show high correlation and trend continuity.
- b.
Large gap missing data: These gaps span multiple consecutive sampling points, exceeding a predefined threshold, leading to information loss that may affect the overall data trend and structure.
Liu et al. [52] compared various imputation techniques, examining their sensitivity to gap length. The results indicate that the root mean square error (RMSE) increases with gap length, reducing the performance of gap-filling techniques. For large gaps, considering trend changes in the data is essential. To address this, a two-stage missing data recovery method based on interpolation and slope similarity metrics is sequentially applied to small and large gap data losses.
4.2.3.1. Classification of Missing Data Types
A threshold is established to differentiate between large and small data gaps. By traversing the dataset, consecutive missing segments M = {(s1, e1), (s2, e2), …, (sk, ek)} are identified, with si and ei representing the start and end time indices of the i-th missing segment, respectively. The length of each segment Li = ei − si is calculated and compared to the predefined threshold. Based on this comparison, the segments are classified as either large or small gaps.
4.2.3.2. Imputation of Small Gap Missing Data
For small gap data imputation, the data surrounding the missing values usually exhibit high correlation and continuity. Therefore, the values of the missing points can be accurately estimated using the surrounding known data points. Cubic spline interpolation is employed to fill the small gap missing data, ensuring smooth and gradual changes around the interpolated points. Within the missing data interval (ts, xs), (te, xe), a spline function S(x) that satisfies the S(xs) = ys and S(xe) = ye boundary conditions are constructed. This spline function S(x) = ai + bix + cix2 + dix3 is a cubic polynomial function within the interval x ∈ [xs, xe], and the coefficients of the cubic polynomial ai, bi, ci, and di ensure the smoothness of the generated data, S(x) maintaining S(x), S′(x), S″(x) continuity throughout the interval [53].
4.2.3.3. Imputation of Large Gap Missing Data
- a.
The missing data segments are preliminarily filled using cubic spline interpolation. Next, it is essential to standardize the reference data. This ensures that the distance and slope calculations are reasonable and accurate:
() -
where xi is the processed data, zi is the unprocessed data, zmin and zmax are the minimum and maximum of original wind power series, respectively, and n is the total number of samples.
- b.
A sequence twice the length of the missing data segment 2Lm is used as the reference data segment, and a sliding window of size 2Lm is employed to search for candidate data segments preceding the missing data segment. Calculate the slope difference Dk and numerical difference Dv between the target data segment and the candidate data segments, using Euclidean distance to uniformly measure these differences:
()() -
Here, ki = xi+1 − xi represents the slope between adjacent data points. Subsequently, the slope and numerical differences are combined, and the overall difference D is used to select the most similar data segment:
()()() -
By evaluating the variances of the slope and numerical differences, the relative weights α and β in the overall difference are dynamically adjusted. This automatic weight calculation balances the impact of slope and numerical differences on similarity assessment based on the intrinsic characteristics of the data, thereby minimizing subjective interference.
- c.
After identifying the most similar data segment by indicator D, the slope sequence of adjacent points in the similar segment is calculated. The values of the missing data points are then calculated sequentially based on the slope values corresponding to the positions of the missing data points:
Here, represents the slope between adjacent points in the reference data segment, represents the normal data before the missing segment, and represents the slope of the last data point in the similar data segment. Subsequently, the filled data segment undergoes smoothing to ensure continuity before and after the missing segment.
4.3. Performance Evaluation
In this section, the raw data monitored by the wireless collection system in an engineering case is used for testing, and the established method is applied to evaluate its effectiveness. The raw data were continuously collected about 20 days. After undergoing preprocessing, anomaly detection, and anomaly recovery, the processed data are compared with the real data. The SD card backed up the measurement data lost due to wireless transmission issues or other interruptions. It is important to note that abnormal data caused by sudden voltage fluctuations were also recorded, and this portion of data was replaced with manually recorded normal data. Consequently, the real data used for comparison are obtained.
The proposed method is compared with classic time series data recovery algorithms such as Kalman filter, seasonal autoregressive integrated moving average (SARIMA), and distance-weighted moving average (DWMA) to assess accuracy by comparing the imputed values with the original values. The evaluation includes three typical data types in mass concrete construction: core internal measurement points with a stable hydration heat trend, ambient temperature measurement points, and top/bottom monitoring points significantly affected by ambient temperature changes.
As shown in Figure 13, the monitoring results of the bottom point reveal a distinct periodic trend significantly influenced by the environment. Two regions with noticeable data gaps are selected to demonstrate the effectiveness of the data recovery method.
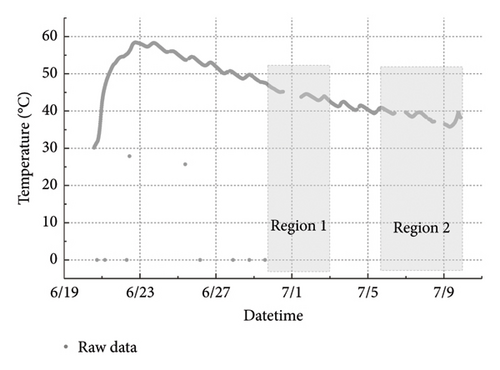
As shown in Figure 14, the corrected values from KF and SARIMA are close to the actual data but fail to capture the changing trend. Although DWMA follows the overall trend, it exhibits noticeable deviations compared to the actual data. In contrast, the proposed method aligns more closely with the actual data in terms of both numerical accuracy and trend continuity.
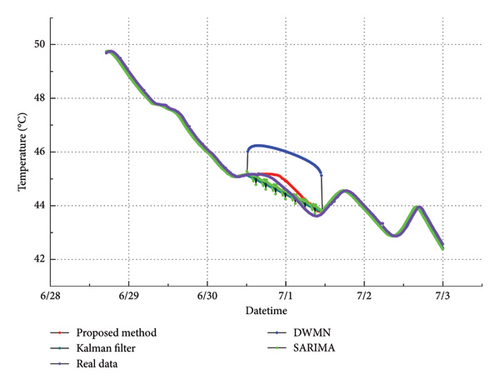
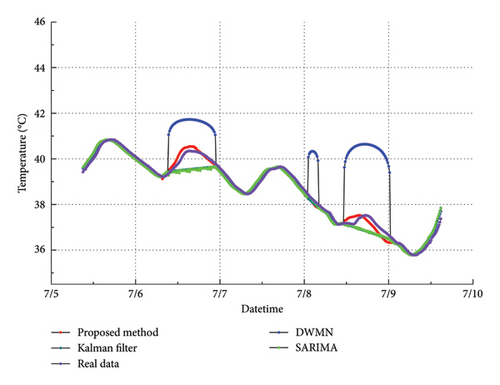
Figure 15 shows data from the top surface measurement point, with a close-up of the region around July 1. The real data in the missing segment exhibit a clear trend change, as shown in Figure 16. In this scenario, both KF and DWMA produce significant deviations. Although SARIMA has smaller numerical deviations, it still fails to accurately capture the changing trend. The proposed method also shows slight deviations but aligns better with the actual data trend compared to the other methods.
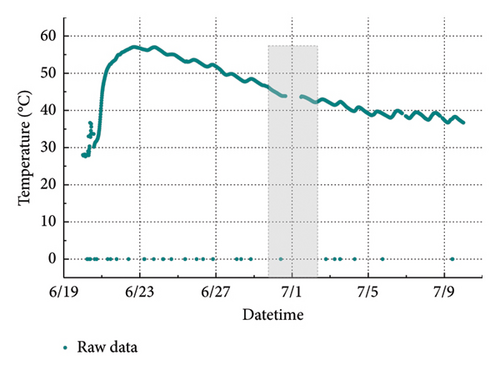
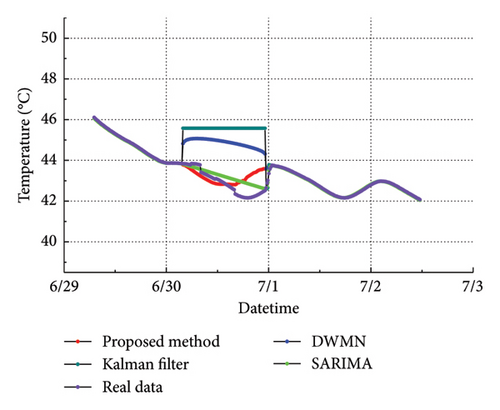
Figure 17 shows data from the core measurement point of the structure, with maximum temperatures higher than the surface measurement points, reaching up to 70°. As the sensor is located inside the structure, its temperature changes are less influenced by the environment, reflecting the typical temperature trend of mass concrete hydration heat. We enlarged the area in Figure 18, revealing that the real data’s actual trend is monotonic. In this scenario, all methods, except DWMA, can effectively restore the missing data. DWMA still exhibits slight deviations.
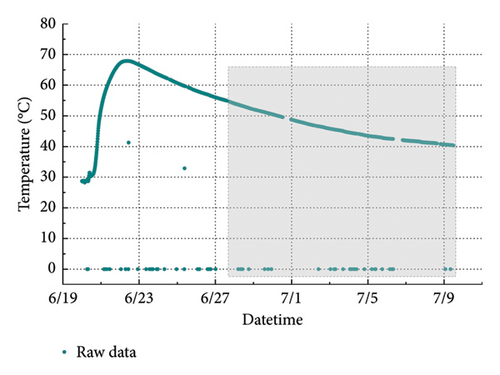

Figure 19 shows data from the ambient temperature measurement point. Throughout the monitoring period, the ambient temperature exhibits significant diurnal fluctuations and periodic changes. We have enlarged three specific areas, with a sudden temperature drop around July 1 caused by a heavy rainstorm.
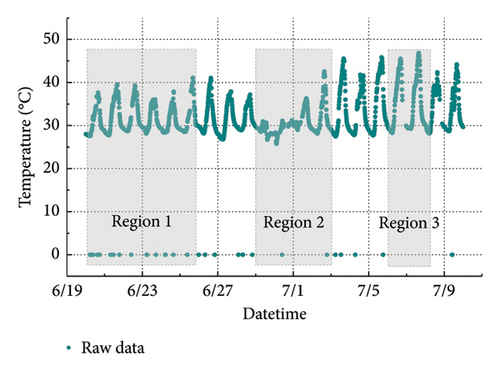
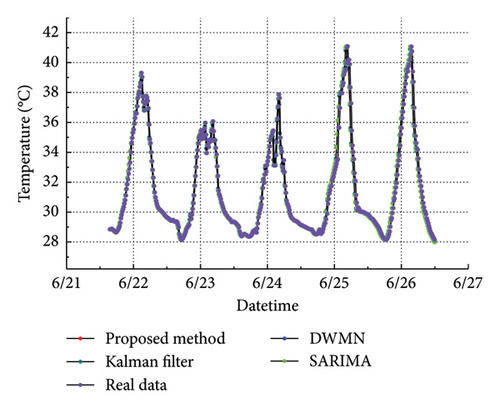
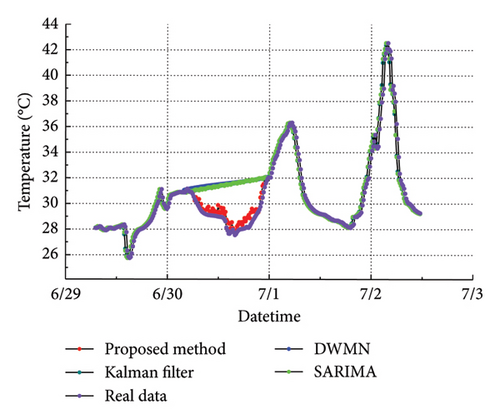
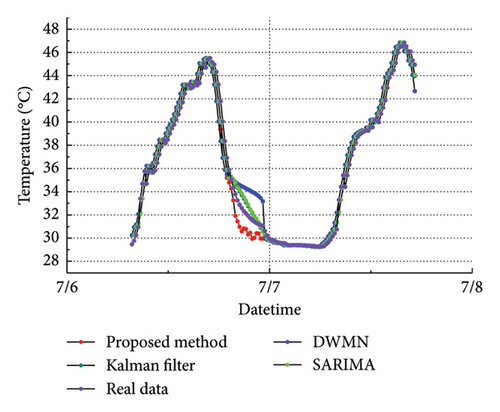
As shown in Figure 19(b), this area predominantly contains small gaps of missing data with a single trend within the missing segments. Based on the normal data before and after the missing segments, the missing data can be effectively restored, resulting in good performance from all methods. In Figure 19(c), the missing segment exhibits a complex trend. Except for the proposed method, other methods fail to restore the original trend and show significant deviations. The proposed method, however, successfully restores the trend with high accuracy. In Figure 19(d), the missing data occur during a downward trend, and both the proposed method, SARIMA, and KF exhibit minimal deviations from the real data.
As shown in Table 3, the proposed method demonstrates superior performance across most metrics and positions, particularly in the “Core” position where it achieves the lowest RMSE (0.05), MAE (0.05), and MAPE (0.09). Similarly, it performs well in the “Top” and “Ambient” positions, achieving the lowest MAPE values (0.55 and 1.81, respectively). DWMN and Kalman filter exhibit higher errors in most cases; however, Kalman filter shows competitive performance in the “Bottom” position (lowest RMSE: 0.23 and MAE: 0.18). SARIMA’s performance is closer to the proposed method, exhibiting lower errors in the “Top,” “Bottom,” and “Core” positions, but it struggles to accurately recover data from ambient monitoring.
| Method | Bottom | Top | Core | Ambient | ||||||||
|---|---|---|---|---|---|---|---|---|---|---|---|---|
| RMSE | MAE | MAPE | RMSE | MAE | MAPE | RMSE | MAE | MAPE | RMSE | MAE | MAPE | |
| The proposed method | 0.27 | 0.21 | 0.49 | 0.31 | 0.25 | 0.55 | 0.05 | 0.05 | 0.09 | 0.73 | 0.57 | 1.81 |
| DWMN | 1.56 | 1.06 | 2.61 | 1.76 | 1.72 | 3.98 | 1.17 | 0.71 | 1.54 | 2.16 | 1.88 | 6.38 |
| Kalman filter | 0.23 | 0.18 | 0.45 | 2.33 | 2.27 | 5.26 | 0.05 | 0.05 | 0.10 | 2.11 | 1.80 | 6.10 |
| SARIMA | 0.25 | 0.19 | 0.46 | 0.29 | 0.26 | 0.56 | 0.19 | 0.08 | 0.16 | 2.10 | 1.79 | 6.05 |
- Note:The bold values represent the minimum error values in each column, highlighting the best performance for each metric (RMSE, MAE, and MAPE).
For the “Core” monitoring data, the trend is monotonic, making the imputation of missing data straightforward and accurate. However, for monitoring data with trend fluctuations (“Bottom,” “Top,” and “Ambient”), traditional methods exhibit limitations. The proposed method outperforms others in filling missing data, achieving robustness and accuracy across different types of monitoring data.
For restoring missing data with small gaps and single trends, all the above methods can achieve good results. However, in cases of large gaps with complex trend changes, the method proposed in this paper based on interpolation and slope similarity metrics can restore missing data with significant trend characteristics without introducing noticeable data deviations. It is also computationally simple, making it suitable for the wireless system designed in this study.
5. On-Site Monitoring Results
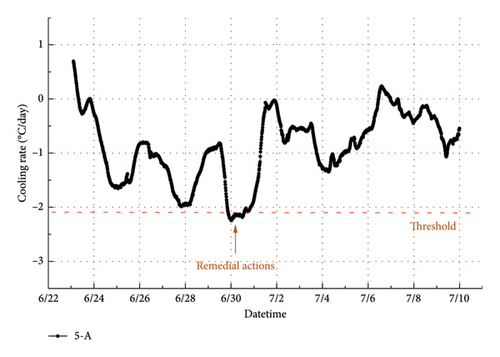
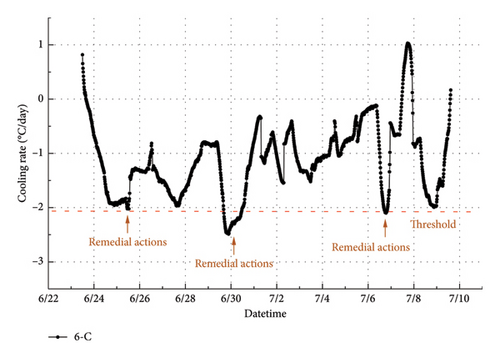
In this study, the developed wireless sensing system and rapid abnormal data processing methods ensure the integrity and accuracy of temperature monitoring throughout the pouring and curing of mass concrete. This system operated continuously during the mass concrete construction stage until the temperature distribution gradually stabilizes. Utilizing the collected data, the cooling rate—defined as the temperature difference between the current moment and the same time on the previous day (ΔT = (T(t) − T(t − 1 day)/1 day))—can be calculated in real time. This cooling rate is a critical parameter for the curing process of mass concrete. An excessively rapid cooling rate can induce significant temperature gradients between the interior and surface of the concrete, leading to stress concentration. Such stress concentrations may ultimately result in internal cracking, thereby compromising the overall structural performance of the concrete.
Figure 20 illustrates the cooling rate data from measurement Points 5-A and 6-C, showing significant fluctuations. Regions highlighted by red arrows indicate cooling rates that exceed the established threshold of 2°C/d. When such exceedances are detected, the affected points are immediately reported to the management team, which then implements remedial actions, such as deploying heaters to rapidly warm the surrounding areas. Subsequent data trends demonstrate that the cooling rates typically return to acceptable levels following these interventions. Additionally, throughout most of the monitoring period, the cooling rates at the measurement points remain below the threshold. The system and methodology developed in this study enable real-time, continuous temperature acquisition and cooling rate calculations at monitoring points, providing quantitative support for dynamic concrete curing and effective crack control measures.
6. Conclusion and Future Work
This paper presents the design of a wireless sensing system for temperature monitoring of mass concrete structures. The prototype sensing system features low costs and rapid deployment, low power consumption with long-range wireless communication, and robust data anomaly detection and recovery. Field tests have validated the capability and reliability of the temperature sensing system for large-scale deployment in mass concrete structures.
While the designed wireless sensing system has proven effective in continuous temperature monitoring, there is room for improvement. Signal conditioning can be designed in the wireless sensing unit to improve measurement fidelity. Advanced communication protocol is needed in the embedded software to better manage large-scale sensing networks. Incorporating local data compression algorithm can reduce the wireless transmission load and improve overall reliability of wireless sensing system. Additionally, further field tests are necessary to refine the design and performance of the sensing system.
This research establishes a promising framework for wireless temperature monitoring in mass concrete structures, with potential advancements to further enhance its application and reliability.
Disclosure
Any opinions, findings, and conclusions or recommendations expressed in this publication are those of the authors and do not necessarily reflect the view of the sponsors.
Conflicts of Interest
The authors declare no conflicts of interest.
Author Contributions
Tengyi Wang and Dan Li contributed equally to this work.
Funding
This research was financially supported by the National Key R&D Program of China (No. 2022YFC3801700), the Research Fund for Advanced Ocean Institute of Southeast University (Key Program, No. KP202407), and the Young Scientists Fund of the National Natural Science Foundation of China (Grant No. 52108273).
Acknowledgments
This research was financially supported by the National Key R&D Program of China (No. 2022YFC3801700), the Research Fund for Advanced Ocean Institute of Southeast University (Key Program, No. KP202407), and the Young Scientists Fund of the National Natural Science Foundation of China (Grant No. 52108273).
Open Research
Data Availability Statement
The data that support the findings of this study are available from the corresponding author upon reasonable request.


