Using Deep Learning to Estimate Vibration Comfort of Large-Scale Shake Table During Operation
Abstract
Shake tables are useful earthquake simulation tools for structural seismic experiment, but they may also inadvertently induce vibrations to nearby buildings while in operation. Accelerating the comfort level quantification process of these vibrations before conducting a shake table test is necessary. To this end, this paper focuses on the influence of vibration introduced by a 6 × 9 m large-scale shake table at Southeast University and presents a one-dimensional convolutional neural network–based deep learning approach to efficiently estimate the vibration comfort of the shake table laboratory and surrounding buildings. Based on the on-site structural vibration monitoring of shake table test, a three-dimensional numerical model of the shake table–soil–surrounding building system is established and validated through the finite element method, and thus a dataset comprising 12,215 groups of input (i.e., peak acceleration values and time-history of the triaxial ground motion) and output (i.e., three-directional acceleration response for nine measuring points of surrounding buildings) data is simulated. Thereafter, the deep learning network is trained with 80% of the dataset and tested with the remaining 20%. The test results indicate that the approach enables the network to directly extract dynamic features from triaxial ground motion accelerations and to accurately estimate the weighted acceleration level (WAL) of nine different locations at the surrounding buildings. Finally, the optimized network is verified through an actual shake table experimental test on a self-centering concrete structure, which confirms the superior performance of the proposed approach on shake table–induced vibration comfort estimation. The approach is also beneficial for researchers to design reasonable loading scenarios before conducting shake table tests.
1. Introduction
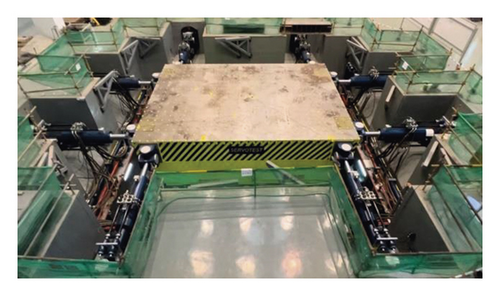
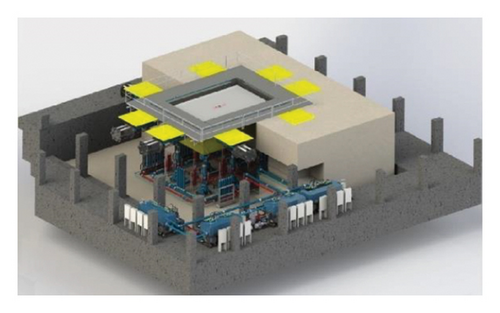
Shake table test is developed to simulate earthquake-induced ground motions and to reproduce nonlinear dynamic response of structures during earthquakes, which has been the most efficient and realistic approach for structural seismic performance evaluation [1]. With the advancements of modern automatic control technology and mechanical systems [2], the scale and performance of shake tables, such as maximum bearing capacity, maximum output load, table size, and operating frequency range, also experienced prominent improvement during the past decades. The Large High-Performance Outdoor Shake Table (LHPOST), built at the University of California, San Diego, is the world’s largest outdoor shake table, with a table size of 7.6 × 12.2 m and a vertical bearing load of 20 MN [3]. In Japan, E-defense [4] houses the world’s largest indoor shake table test system that has a 15 × 20 m table and a maximum payload capacity of 1200 tons. The booming of large shake table construction makes it possible to conduct full-scale dynamic experiments on diverse structures. At Southeast University (SEU), the second largest shake table in China, which has a size of 6 × 9 m (expandable to 9 × 9 m), has been in operation since 2023. Figure 1 shows the shake table system and its 3D model.
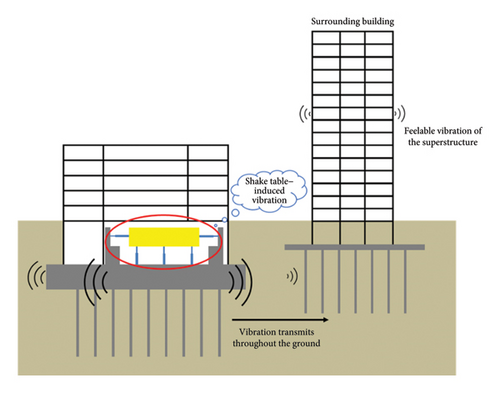
As an excitation source, the large shake table not only triggers vibration of the tested structures on the table but its operation also causes significant dynamic loads on its foundation and surrounding soil, leading to vibration of the whole laboratory building. Simultaneously, the vibration is transmitted directly through the foundations of the nearby buildings, and ultimately results in feelable vibration and secondary noise on every floor of the superstructures, as shown in Figure 2. As the shake table laboratory (STL) is built on SEU campus, evident floor vibrations will also influence precision of the research-oriented electronic devices and medical instruments housed in the surrounding buildings. Therefore, measuring the shake table–induced vibrations of the structures near the laboratory and correspondingly assessing their vibration comfort are essential. A conventional method is to establish a finite element model (FEM) and conduct dynamic time-series analysis to predict the vibrational response of the structures [5]. The method is reliable and direct, but the FEM analysis tends to be time-consuming and places heavy demands on computing resources, which is not ideal for practical evaluation of vibration comfort [6].
Given the swift advancements in data science and computational methodology, many researchers and engineers have begun to employ deep learning (DL) technology for structural vibration analysis and vibration comfort evaluation. As an intelligent algorithm, DL-based method can create simple and accurate surrogate models to substitute complex and computationally expensive dynamic systems. By extracting useful features from massive training data, the DL network will be able to efficiently analyze the vibrations for structure assessment and comfort prediction. Liang et al. [7] proposed a two-dimensional convolutional neural network–aided (2D CNN–aided) DL method to identify ground-borne vibration measured from train–soil–building system and utilized the approach on long-term underground train-induced vibration identification, validating the feasibility of DL-aided method for train-induced vibrational data identification. Liu et al. [8] utilized the Bayesian inference–based neural network (BNN) on train-induced vibration prediction of several subway stations in Beijing city and concluded that the proposed BNN approach can not only provide the mean predicted vibration value but also quantify the uncertainty of the probability. Huang and Kaewunruen [9] developed a railway passenger comfort evaluation method that combines CNN and support vector regression (SVR). By analyzing vibrational data collected from a corridor between two stations in Birmingham, the method demonstrated high accuracy in comfort level evaluation. The developed CNN and SVR-based application was proven to be able to automatically quantify the real-time comfort of the passengers. These studies proved that the DL-based approach has unique advantages on vibration signal feature extraction, analysis, and vibration comfort evaluation. However, utilization of DL to deal with shake table–induced vibration effect has been rarely reported.
In this paper, a DL-aided framework is proposed to quantify and estimate the vibration comfort of the STL and surrounding buildings during operation of the shake table. First, design of the vibration monitoring system, arrangement of measuring points, numerical model analysis, and vibration comfort evaluation strategy are introduced. The framework of the developed DL-based vibration comfort estimation approach as well as the ground motion record selection method, preprocessing method for ground motion signals, training and testing strategy of the DL model, and implementation of the trained model for vibration comfort estimation are then illustrated in detail. A dataset, comprising 9772 groups of triaxial ground motion signals as inputs and vibration comfort levels as outputs, is prepared through dynamic time-history analysis (DTHA) of the shake table–soil–surrounding building (SSS) system. The model optimized with the dataset is used to analyze 2443 groups of new input records with different peak ground accelerations (PGAs), and the vibration comfort estimation performance of the model is tested and discussed. In addition, another test applied the proposed framework on an actual shake table experimental test of a self-centering concrete structure to estimate the vibration effect of different measuring points through input ground motion signals. The relationship between the estimated vibration comfort levels and their actual evaluation results computed from the real-time monitoring data was also compared and discussed. The impressive performance of the test results indicates that the proposed framework is an effective and reliable tool for pre-experiment estimation of vibration comfort of shake table tests.
2. Vibration Monitoring and Evaluation of the STL and Surrounding Buildings
2.1. Introduction to the STL and Surrounding Buildings
The STL building at SEU occupies an area exceeding 7000 square meters and was completed and put into use in 2021. The building includes 4 stories above ground, and the shake table system is installed on the first story. The three-dimensional shake table system has 14 actuators. The maximum load for the 8 horizontal actuators is 1084 kN, while the 6 vertical actuators have a maximum load of 993 kN. The detailed performance index of the shake table system is presented in Table 1.
| Parameter | Value |
|---|---|
| Operating directions | 3 directions and 6 degrees of freedom |
| Bearing capacity limit | 120 tons |
| Peak acceleration under full load | ±1.5 g in horizontal directions; ±1.0 g in vertical direction |
| Peak overturning moment | 6000 kN·m |
| Peak eccentric moment | 1800 kN·m |
| Eccentricity range | 0–1.5 m |
| Operating frequency range | 0.1–50 Hz |
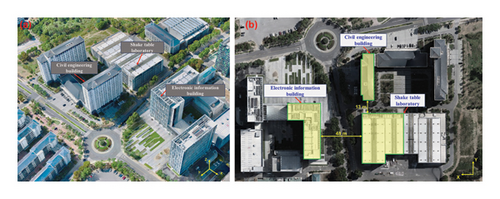
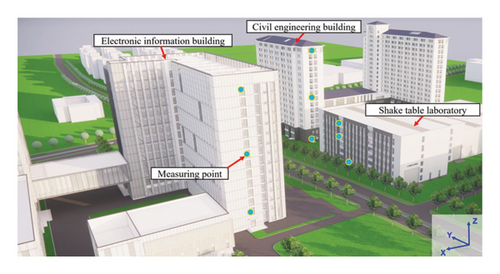
Figure 3 shows the aerial view and top-down view of the STL and surrounding buildings at SEU’s Jiulonghu Campus, including the civil engineering (CE) building and the electronic information (EI) building. The laboratory building is a reinforced concrete frame structure, and the other two surrounding tall buildings are reinforced concrete frame-shear wall structures.
2.2. Structural Health Monitoring and Vibration Comfort Evaluation
2.2.1. Structural Health Monitoring System (SHMS)
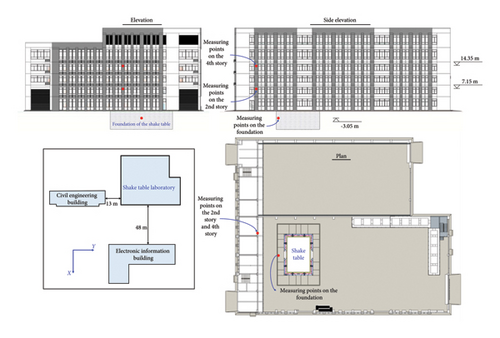
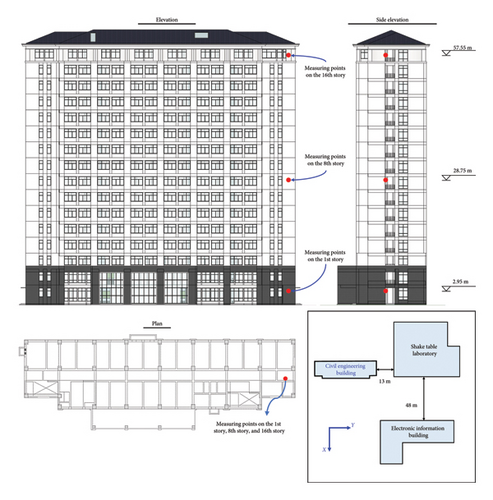
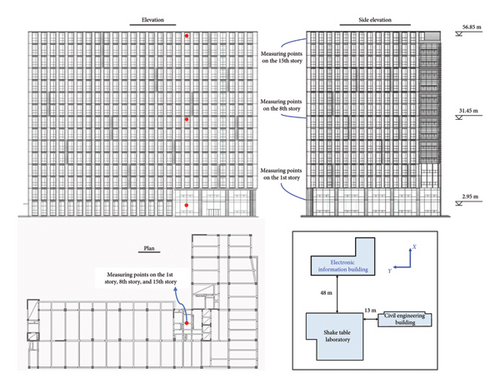
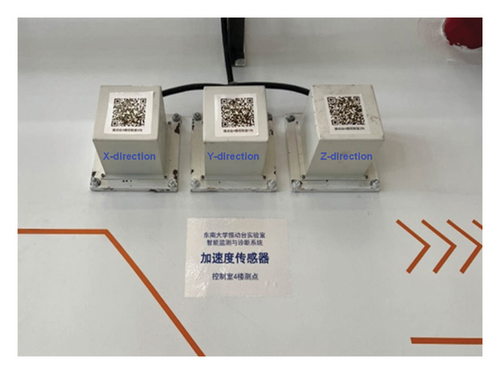
To investigate the impact of shake table–induced vibration on the surrounding structures, a SHMS is established by installing accelerators at different locations of the laboratory and the two surrounding buildings; thus, the vibration comfort of every measuring point can be calculated when shake table tests are conducted. Figure 4 depicts the layout of the nine measuring points at the three buildings: the STL building has its measuring points on the foundation, 2nd story, and 4th story; the CE building on the 1st story, 8th story, and 16th story; and the EI building on the 1st story, 8th story, and 15th story, respectively. At each measuring point, three unidirectional magnetoelectric accelerometers are installed to capture the real-time vibration response in the vertical direction as well as in the two horizontal directions, as shown in Figure 5. Each accelerometer has a sensitivity of 0.3 V/m·s−2, a max range of 20 m/s2, and a frequency range of 0.25–200 Hz.
2.2.2. Comfort Evaluation Approach
According to the Chinese GB 50868 standard, thresholds for the WAL values at different measuring points are specified with reference to the usage functions of the three buildings, as shown in Table 2. The function of the STL building is to provide fields for structural dynamic or static characteristic tests, so its threshold is relatively higher. The CE building serves as offices and studios for staff and graduate students. Given the requirement for human comfort, its threshold is set lower than that of the laboratory building. Furthermore, the EI building houses many vibration-sensitive instruments with high precision, and thus its threshold is the strictest among the three buildings.
| Building name | La threshold (dB) |
|---|---|
| Shake table laboratory building | 89 |
| Civil engineering building | 83 |
| Electronic information building | 71 |
2.3. On-Site Vibration Monitoring and Comfort Evaluation
Before the STL was put into service for seismic ground motion experiments of real-sized structures, a series of tests were conducted to investigate the influence of shake table–induced vibration on the surrounding buildings. The tests included frequency sweep wave test, sine wave test, and seismic time-history wave test. In this section, the results of representative tests are briefly introduced, focusing on the vibration responses at measuring points of the three surrounding buildings and the dynamic characteristics of these vibrations, as detailed results of all tests have been provided in the previous study [11].
2.3.1. Sweep Frequency Wave Test
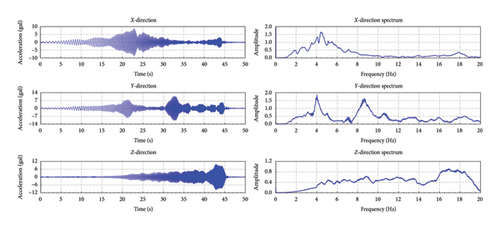
Figure 6 plots the acceleration curves and their corresponding spectra for the three-directional responses under sweep frequency wave excitation measured at the monitoring point on the fourth story of the STL building. Each directional response had a peak acceleration of 0.15 g during the sweep frequency wave, with the shake table bearing a load of 60 tons. The frequency range for each wave extended from 0 to 20 Hz. In the X-direction spectrum, a prominent resonance peak appeared at approximately 4.5 Hz. In the Y-direction spectrum, resonance peaks were noticeable at around 4 and 9 Hz. In the Z-direction spectrum, the resonance peak was in the 16–18.5 Hz range.
2.3.2. Sine Wave Test
As an example of sine wave tests, Table 3 presents the maximum acceleration (amax) and WAL (La) values for each measuring point in the EI building under different test scenarios. The threshold of La in this building is 71 dB. The maximum vibrational response occurred at the Z-direction sensor on the 15th story during the 10 Hz X-direction sine wave test. Generally, the X-direction response on the 8th and 15th stories was significantly lower than that on the 1st story. The maximum La occurred at the X-direction sensor on the 15th story during the 2 Hz X-direction sine wave test. According to the distribution of La values across different scenarios, the WAL of the 2 Hz tests was the highest, and most of the measuring points recorded La values that exceeded the threshold. In addition, as the frequency of the sine wave increased, there was a decrease in the number of measuring points exceeding the threshold.
| Test scenario (direction-frequency-peak acceleration) (g) | Vibration index | 1st story of electronic information building | 8th story of electronic information building | 15th story of electronic information building | ||||||
|---|---|---|---|---|---|---|---|---|---|---|
| X | Y | Z | X | Y | Z | X | Y | Z | ||
| X-2 Hz-1.5 | amax (gal) | 0.734 | 0.486 | 0.517 | 0.409 | 0.641 | 0.450 | 0.543 | 0.991 | 0.674 |
| La (dB) | 76.30 ∗ | 72.72 ∗ | 68.78 | 71.22 ∗ | 75.13 ∗ | 67.57 | 73.69 ∗ | 78.91 ∗ | 71.08 ∗ | |
| X-10 Hz-1.5 | amax (gal) | 0.773 | 0.405 | 0.710 | 0.448 | 0.497 | 0.889 | 0.577 | 0.418 | 1.467 |
| La (dB) | 63.85 | 58.24 | 76.93 ∗ | 59.12 | 60.02 | 78.88 ∗ | 61.31 | 58.51 | 83.23 ∗ | |
| X-30 Hz-1.5 | amax (gal) | 0.877 | 0.739 | 0.565 | 0.380 | 0.452 | 0.645 | 0.476 | 0.716 | 0.510 |
| La (dB) | 54.88 | 53.39 | 67.18 | 47.62 | 49.12 | 68.33 | 49.57 | 53.12 | 66.29 | |
| Y-2 Hz-1.5 | amax (gal) | 0.578 | 0.536 | 0.648 | 0.401 | 0.384 | 0.368 | 0.529 | 0.682 | 0.345 |
| La (dB) | 74.23 ∗ | 73.57 ∗ | 70.74 | 71.05 ∗ | 70.68 | 65.83 | 73.46 ∗ | 75.67 ∗ | 65.27 | |
| Y-10 Hz-1.5 | amax (gal) | 0.508 | 0.366 | 0.437 | 0.317 | 0.671 | 0.474 | 0.350 | 0.351 | 0.556 |
| La (dB) | 60.21 | 57.36 | 72.71 ∗ | 56.11 | 62.62 | 73.42 ∗ | 56.97 | 57.00 | 74.80 ∗ | |
| Y-30 Hz-1.5 | amax (gal) | 0.552 | 0.424 | 0.716 | 0.384 | 0.399 | 0.433 | 0.389 | 0.366 | 0.389 |
| La (dB) | 50.86 | 48.57 | 69.24 | 47.71 | 48.04 | 64.87 | 47.82 | 47.29 | 63.94 | |
| Z-2 Hz-1.3 | amax (gal) | 0.708 | 0.318 | 0.503 | 0.332 | 0.304 | 0.311 | 0.357 | 0.308 | 0.334 |
| La (dB) | 75.99 ∗ | 69.04 | 68.54 | 69.41 | 68.65 | 64.37 | 70.04 | 68.76 | 64.98 | |
| Z-10 Hz-1.3 | amax (gal) | 0.777 | 0.342 | 0.472 | 0.319 | 0.317 | 0.307 | 0.351 | 0.314 | 0.357 |
| La (dB) | 63.90 | 56.77 | 73.38 ∗ | 56.17 | 56.11 | 69.64 | 57.00 | 56.03 | 70.95 | |
| Z-30 Hz-1.3 | amax (gal) | 1.035 | 0.599 | 0.493 | 0.454 | 0.364 | 0.692 | 0.395 | 0.443 | 0.450 |
| La (dB) | 56.32 | 51.57 | 66.00 | 49.16 | 47.24 | 68.94 | 47.95 | 48.95 | 65.20 | |
- Note: “gal” (galileo) represents a unit of acceleration, where 1 gal = 1 cm/s2, and “g” refers to the acceleration due to gravity, approximately 9.8 m/s2.
- ∗indicates that La exceeded the threshold.
2.3.3. Ground Motion Test
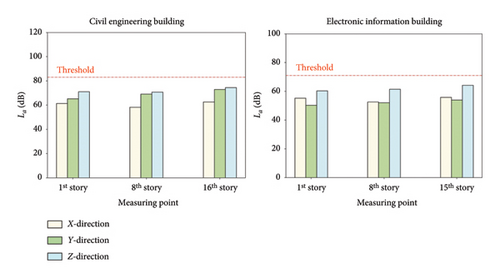
The three-directional Wenchuan seismic wave, with a peak acceleration value of 8.2 m/s2, was employed to conduct the ground motion test. The responses at each measuring point in both the CE building and the EI building are detailed in Table 4. The corresponding WAL results are plotted in Figure 7. In the CE building, the highest vibrational response was observed at the Z-direction sensor on the 16th story. In the EI building, all response values were below 0.5 gal, with the maximum response occurring at the Y-direction sensor on the first story. According to the bar chart in Figure 7, the Z-direction WAL at each measuring point in the two surrounding buildings was the highest among the three directions, with the Y-direction’s value exceeding that of the X-direction. The highest La in the CE building was observed at the Z-direction sensor on the 16th story, registering a value of 74.46 dB, which is below the 83 dB threshold. In the EI building, the highest La was noted at the Z-direction sensor on the 14th story, with a value of 64.23 dB, also below the threshold of 71 dB.
| Measuring point | X (gal) | Y (gal) | Z (gal) |
|---|---|---|---|
| 1st story of civil engineering building | 2.853 | 3.005 | 4.532 |
| 8th story of civil engineering building | 0.713 | 3.407 | 4.023 |
| 16th story of civil engineering building | 1.314 | 3.595 | 4.735 |
| 1st story of electronic information building | 0.359 | 0.45 | 0.413 |
| 7th story of electronic information building | 0.332 | 0.335 | 0.328 |
| 14th story of electronic information building | 0.384 | 0.377 | 0.339 |
2.4. Numerical Simulation of the SSS System
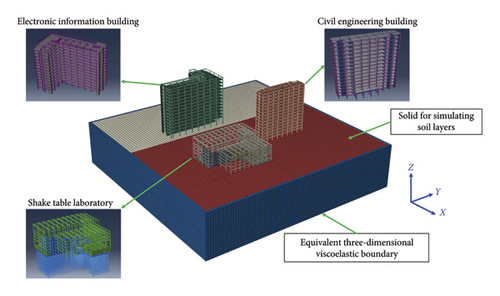
To investigate the vibrational characteristics and impact of the shake table test on the building occupants, a FEM of the SSS system—including the STL, foundation, and surrounding buildings—is established using ABAQUS, as shown in Figure 8. The concrete beams and columns in the three buildings are modeled using B32 elements, a type of Timoshenko beam element. The foundations are modeled with C3D8R elements, a type of solid element. The slabs between stories and the concrete walls are modeled using S4 elements, a type of shell element. C3D8R elements are also used to simulate the soil layers of the ground, and the infinite soil is simulated by defining a viscoelastic boundary [11]. According to the modal analysis results of the FEM, the first three natural periods of the two surrounding buildings are as follows: for the CE building, the periods are 1.603, 1.058, and 0.851 s; for the EI building, the periods are 1.685, 1.483, and 1.230 s. The story weights of these buildings are detailed in Tables 5 and 6.
| Story | 1 | 2 | 3 | 4 | 5 | 6 | 7 | 8 | 9 |
|---|---|---|---|---|---|---|---|---|---|
| Weight | 9.86E + 5 | 9.01E + 5 | 8.59E + 5 | 8.59E + 5 | 8.59E + 5 | 8.59E + 5 | 8.59E + 5 | 8.59E + 5 | 8.59E + 5 |
| Story | 10 | 11 | 12 | 13 | 14 | 15 | 16 | Total | |
| Weight | 8.59E + 5 | 8.59E + 5 | 8.59E + 5 | 8.59E + 5 | 8.59E + 5 | 8.59E + 5 | 4.30E + 5 | 1.35E + 7 |
| Story | 1 | 2 | 3 | 4 | 5 | 6 | 7 | 8 |
|---|---|---|---|---|---|---|---|---|
| Weight | 1.78E + 6 | 1.67E + 6 | 1.67E + 6 | 1.67E + 6 | 1.67E + 6 | 1.67E + 6 | 1.67E + 6 | 1.67E + 6 |
| Story | 9 | 10 | 11 | 12 | 13 | 14 | 15 | Total |
| Weight | 1.67E + 6 | 1.67E + 6 | 1.67E + 6 | 1.67E + 6 | 1.65E + 6 | 1.10E + 6 | 2.85E + 5 | 2.32E + 7 |
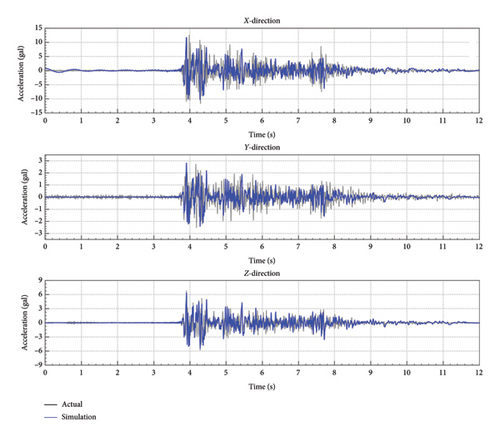
Figure 9 compares the simulated and actual curves of the three-directional responses at the measuring point located on the second story of the STL building under ST58 ground motion. The close alignment between the two curves validated the numerical model to be generally accurate in representing the vibrational characteristics of the system.
3. DL-Based Framework for Pre-Experiment Vibration Comfort Estimation
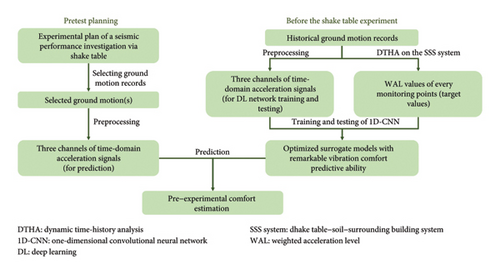
The proposed DL-based framework for pre-experiment comfort estimation of the shake table is illustrated in Figure 10. It consists of four steps. (1) Prepare a dataset of representative historical ground motion records that could be employed on a shake table test. (2) Carry out DTHA on the SSS system with each ground motion signal to obtain the vibrational responses at different monitoring points of the three surrounding buildings and to compute their WAL values. (3) Develop the mapping principles between computed WAL values and ground motions using a DL network. Specifically, the preprocessed triaxial acceleration signals of each ground motion, along with the corresponding WAL values, serve as input–output pairs for training a one-dimensional convolutional neural network (1D-CNN) model. (4) When planning a seismic performance investigation through shake table experiment, the selected records for simulating real ground motions are obtained and input into the optimized 1D-CNN model to estimate their corresponding vibration comfort. It is noted that, despite the potential uncertainties introduced by surrogate models, their applications in estimating vibration comfort are more efficient before conducting the shake table test, particularly in the preliminary assessment of the shake table’s operational effects.
3.1. Step 1: Preparation of Ground Motion Dataset for DL Network Training
3.1.1. Selection of Ground Motion Records
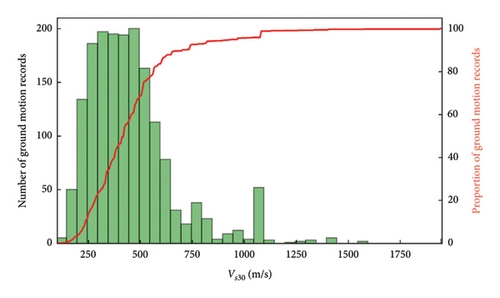
During the seismic performance experiment, ground motions with diverse dynamic characteristics may be employed for the shake table tests. To collect sufficient ground motion records for training the DL network, several open-access ground motion databases can be utilized. These include the PEER NGA-East [12], NGA-West [13], and NGA-Sub [14] databases from the United States, the ESM database [15] from the European Union, and the K-NET database [16] from Japan. In this paper, 1745 ground motion records with a magnitude greater than 4.0 were selected from the NGA-Sub database, a newly developed resource by UCLA, specializing in ground motions from global subduction zone regions. Figure 11 illustrates the distribution of Vs30 (the mean velocity of the site’s shear wave in the uppermost 30 m of soil) for the selected ground motion records.
3.1.2. Preprocessing of the Ground Motion Signals
To adapt ground motion records of various formats to the designed 1D-CNN model, this section introduces the signal preprocessing workflow for each selected record and also explains the rationale behind each procedure.
After the normalization procedure, the acceleration signals of each ground motion record will be resampled because the selected ground motions are recorded by different seismographs and their sampling frequencies varied. The polyphase resampling method is employed to adjust the sampling frequency of each signal to 50 Hz. This method has been proven to effectively avoid frequency aliasing and mirroring during sampling rate conversion in signal processing [18]. It also ensures data consistency when processing different ground motion records and preserves the integrity of acceleration signals for time-history analysis, in accordance with the requirements for seismic performance analysis of civil structures.
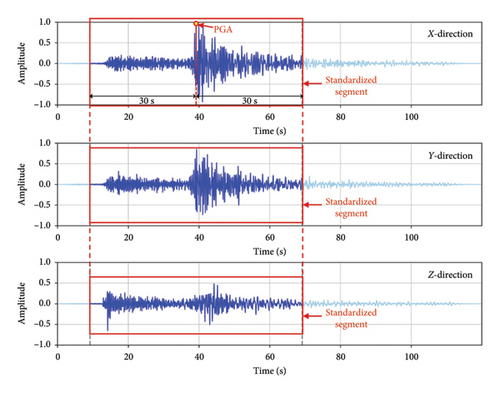
Last but not least, the duration of each ground motion should be standardized before input into the DL network. According to the Chinese specification for seismic test of buildings (JGJ/T 101-2015), the duration of the ground motion should be a minimum of 20 s and between 5 and 10 times the fundamental period of the structure being tested. Hence, after modification, we have set 60 s as the standardized duration for each signal. In detail, the standardization work is conducted as follows. (1) For signals shorter than 60 s, the original record is kept intact and extended to 60 s with padding of zeros. (2) For signals longer than 60 s, a 60-second segment centered around the X-direction signal’s PGA, comprising 30 s before and after the PGA, is preserved. In cases where the PGA occurs within the first or last 30 s of the signal, the initial or final 60-second segment is preserved. (3) For the Y- and Z-direction signals, the same time axis labels as the X-direction are applied for standardization. Figure 12 shows an example of the standardization of a three-directional ground motion record.
The three procedures described in this section will ensure that ground motion records with varying PGA values, sampling frequencies, and durations are normalized, resampled, and standardized to the same format after preprocessing. Without these procedures, the data from different records input into the 1D-CNN model will have varying physical meanings, making them incomprehensible to the network.
3.2. Step 2: Estimating Vibration Comfort With DTHA on the SSS System
In order to assess the impact of different ground motions operated by the shake table on the vibration comfort of the surrounding buildings, DTHA is conducted on the numerical model of the SSS system [19]. The triaxial acceleration responses of the nine measuring points on the surrounding buildings (as shown in Figure 4) excited by the selected ground motions are obtained, and the WAL values of vibrations at every point are computed by expressions (1) and (2).
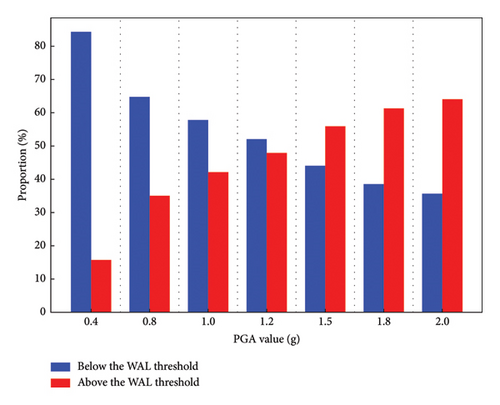
Figure 13 illustrates the percentages of vibrations that are above and below the WAL limit, as defined by the vibration comfort criteria for the surrounding buildings, induced by ground motions with varying PGA values. Evidently, the proportion of ground motions that exceed the WAL threshold increases from 15.64% to 64.13% with the growth of the PGA values. It should also be noted that even the ground motions with lowest PGA value (0.4 g) might induce vibrations exceeding the threshold. The main reason is that the vibration comfort of the surrounding buildings not only is determined by the peak values of the excitation signals but also significantly relates to the dynamic characteristics of the time-series signals.
3.3. Step 3: DL Network Training and Testing
The 1D-CNN is utilized as the DL network to establish the surrogate model for vibration comfort estimation. The network is trained and tested using preprocessed ground motion records and computed WALs. To synchronously extract and analyze the intrinsic features of the three-directional acceleration signals, the 1D-CNN model is structured with multichannel one-dimensional convolutional kernel layers and fully connected deep neural network layers. During the training and testing procedures of the designed model, 1745 selected ground motion records with different recorded sequence numbers (RSNs) are divided into two groups: 80% for training (including 10% of the total for hyperparameter tuning) and 20% for testing.
Testing of the optimized DL network is conducted through two phases. First, the model will analyze the three-directional acceleration signals from the testing dataset and output the predicted WAL values for nine measuring points, and the nonlinear feature extraction/regression performance of the model will be examined. Second, an actual shake table experimental test will be performed, and the estimated vibration comfort level of different measuring points will be compared with the on-site monitoring data.
3.4. Step 4: Vibration Comfort Estimation of Surrounding Buildings
To effectively evaluate the performance of various seismic structure systems, the ground motions used on the shake table are always varied. To estimate the potential adverse effects of the shake table test, preprocessing program is employed to process the prepared ground motion data and to generate three channels of scaled accelerations. These signals are then input into the optimized 1D-CNN model, which can anticipate the vibration comfort at nine different locations in the three surrounding buildings by means of the WAL values. By comparing the output WALs with the predetermined thresholds at corresponding points, the vibration comfort state of these locations can be estimated. Finally, it will be straightforward to offer suggestions on the feasibility of using scaled ground motion records on the shake table. In addition, after the shake table test is conducted, the measured real vibration data, as well as the computed WAL values acquired from the SHMS, will be used to further update the 1D-CNN model.
4. Network Training and Testing
4.1. Architecture of the 1D-CNN Model
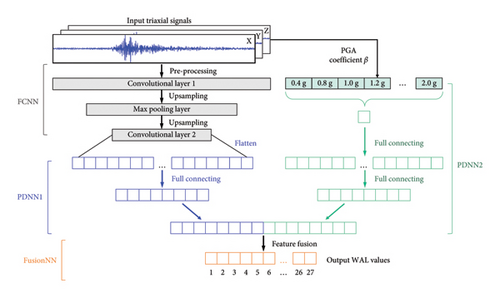
Figure 14 illustrates the architecture of the 1D-CNN model for vibration comfort estimation. The model includes four subnetworks: a fully convolutional neural network (FCNN), two parallel deep neural networks (PDNN), and a fusion neural network (FusionNN). Their configurations are depicted in Tables 7, 8, 9, and 10.
| Layer name | Kernel size | Stride | Output size | Activation function |
|---|---|---|---|---|
| Conv1 | [25, 1] | [1, 1] | [32, 3000, 1] | LeakyReLU |
| MaxPool | [2, 1] | / | [32, 1500, 1] | / |
| Conv2 | [11, 1] | [3, 1] | [64, 500, 1] | LeakyReLU |
| BatchNorm | / | / | [64, 500, 1] | / |
| Layer name | Input size | Output size | Dropout ratio | Activation function |
|---|---|---|---|---|
| Linear1 | [32000, 1] | [5120, 1] | 0.1 | LeakyReLU |
| Linear2 | [5120, 1] | [1024, 1] | / | LeakyReLU |
| Linear3 | [1024, 1] | [512, 1] | / | LeakyReLU |
| Layer name | Input size | Output size | Dropout ratio | Activation function |
|---|---|---|---|---|
| Linear1 | [1, 1] | [256, 1] | 0.1 | LeakyReLU |
| Linear2 | [256, 1] | [512, 1] | / | LeakyReLU |
| Layer name | Input size | Output size | Dropout ratio | Activation function |
|---|---|---|---|---|
| Linear1 | [1024, 1] | [128, 1] | / | LeakyReLU |
| Linear2 | [128, 1] | [128, 1] | / | LeakyReLU |
| Linear3 | [128, 1] | [27, 1] | / | / |
First, the triaxial signals of the original ground motion are preprocessed and input to the FCNN that includes two convolutional layers and a max pooling layer. These layers can upsample the input time-series data with the 1D convolutional kernels. Then, the processed features are flattened and input to the PDNN1, a multilayer neural network that includes three linear layers. It can compress the 32,000-long tensor to 512-long tensor. Meanwhile, the PDNN2 is utilized to process the PGA coefficient of the input original ground motion and downsample it into 512-long tensor. The two PDNNs operate in parallel. Next, the two tensors are concatenated together to form a new 1024-long tensor. Finally, the FusionNN can combine the features from both PDNNs and output a 27-long tensor, representing the WALs for 27 accelerometers at the STL building, the CE building, and the EI building.
4.2. Network Programming and Training
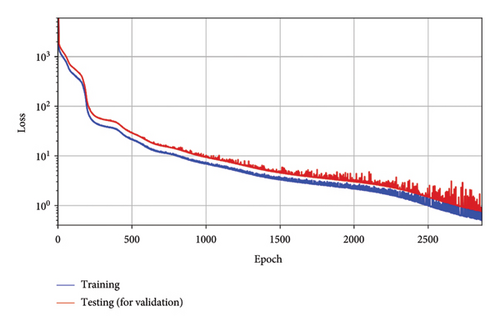
The 1D-CNN model for vibration comfort estimation is implemented using the CUDA version of the PyTorch DL library [20]. The FCNN is structured with two Conv1d operators and a MaxPool1d layers, packaging by the sequential container. The two PDNNs and the FusionNN are structured with numbers of linear operators and dropout layers. The LeakyReLU with a 0.2 negative slope value is employed as the activation function to introduce nonlinearity into the model [21]. The mean square error (MSE) is used as the loss function to compare the predicted WAL values and the ground truth [22]. The optimizer is AdaMAX [23] and the learning rate is 0.00005. The model is trained at least 2000 epochs until the MSE value is < 0.50. To boost the DL network training, a computer equipped with an Intel Core i9–12900 5.10 GHz CPU and Nvidia RTX GPU with 8704 CUDA cores was used.
The training dataset, comprising 9772 pairs of normalized ground motion signals and PGAs, is employed to optimize the network parameters of the model, while the testing dataset, containing 2443 such pairs, is used to validate the model’s performance. The loss curves for both the training and testing datasets are depicted in Figure 15. During the training process, hyperparameter tuning and optimization were performed using a 10% subset of the total dataset, while the remaining 70% of the dataset was used for training.
4.3. Network Test Based on Real Ground Motions
After optimizing the 1D-CNN model, the proposed DL method is applied to analyze the testing dataset that includes 2443 pairs of real ground motions and PGAs. To verify the performance of the model, a statistical analysis and a vibration comfort estimation test were conducted.
4.3.1. Statistical Analysis
| Dataset | Training dataset | Testing dataset | ||||
|---|---|---|---|---|---|---|
| Measuring point | X (%) | Y (%) | Z (%) | X (%) | Y (%) | Z (%) |
| STL building-foundation | 0.141 | 0.086 | 0.092 | 0.111 | 0.064 | 0.003 |
| STL building-2nd story | 0.052 | 0.081 | 0.333 | 0.074 | 0.096 | 0.263 |
| STL building-4th story | 0.350 | 0.045 | 0.058 | 0.243 | 0.093 | 0.038 |
| CE building-1st story | 0.072 | 0.015 | 0.219 | 0.028 | 0.073 | 0.108 |
| CE building-8th story | 0.044 | 0.059 | 0.330 | 0.122 | 0.121 | 0.232 |
| CE building-16th story | 0.094 | 0.256 | 0.417 | 0.148 | 0.309 | 0.320 |
| EI building-1st story | 0.196 | 0.063 | 0.108 | 0.114 | 0.064 | 0.322 |
| EI building-8th story | 0.173 | 0.143 | 0.066 | 0.070 | 0.159 | 0.348 |
| EI building-15th story | 0.259 | 0.268 | 0.018 | 0.101 | 0.318 | 0.230 |
4.3.2. Test for Vibration Comfort Estimation
To estimate the vibration comfort of nine different measuring points, the maximum WAL values from each of the three directions are analyzed for every measuring point. Figure 16 illustrates scatter plots of the maximum WAL values for predictions and ground truths at each measurement point. Figure 16(a) compares the WAL values for the training dataset, while Figure 16(b) displays those for the testing dataset.
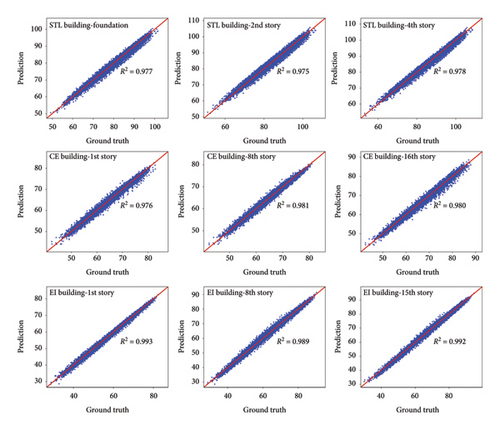
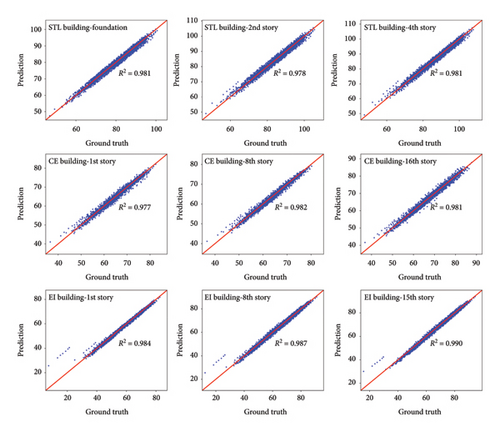
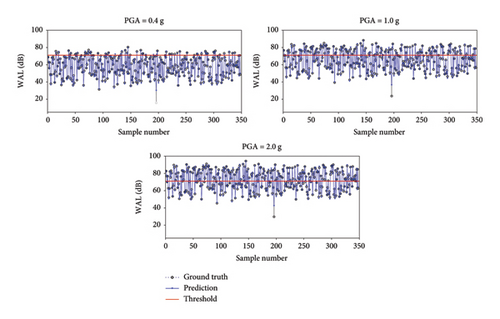
According to Figure 16, the predicted WAL values in both the training and testing datasets show a linear correlation with the corresponding true WAL values. The R-squared (R2) coefficients [25] for both the prediction and the ground truth are ≥ 0.975, indicating an outstanding fit of the optimized 1D-CNN model to vibration comfort quantification. Also, the R2 values of the testing dataset closely align with those of the training dataset, suggesting that there is no overfitting of the surrogate model. In addition, for the EI building, a few input samples’ predictions in the testing dataset were overestimated by the 1D-CNN model. Since both the predicted and actual values of these samples are < 50 dB and below the threshold for the EI building (71 dB), this will not impact the structural vibration comfort work of the model. Figure 17 depicts the predicted and actual WAL values of different PGA levels for the 349 samples in the testing dataset. With the growth of the PGA level, most of the predicted and actual WAL values increase, and their values remain close. It is also found that the percentages of predicted WAL values exceeding the threshold (15.76%, 40.69%, and 55.59%) closely approximate those of the ground truth values (15.47%, 40.11%, and 56.16%).
5. Case Study: Vibration Comfort Estimation and Verification of an Actual Shake Table Test
In order to verify the effectiveness of the proposed DL-based comfort estimation method and the optimized 1D-CNN model, a case study on the pre-experiment comfort estimation using an actual shake table test is presented in this section.
5.1. Description of the Shake Table Test
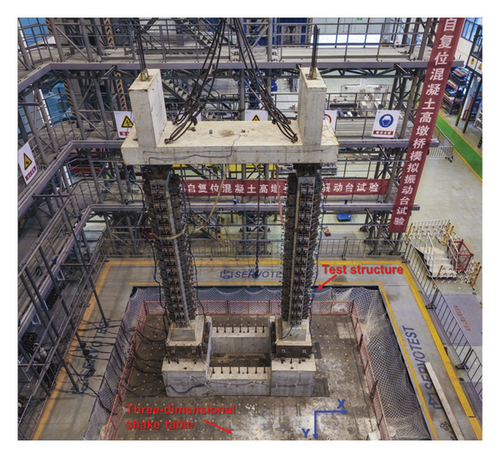
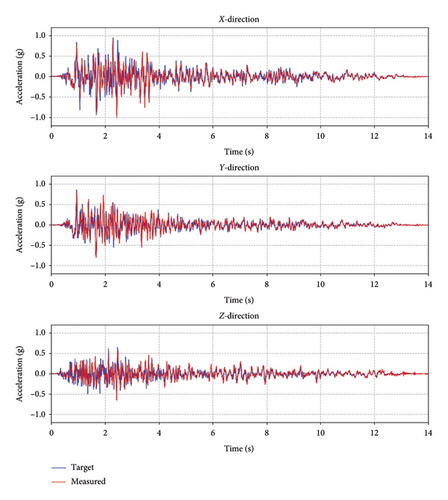
The shake table test is to investigate the seismic performance of a self-centering concrete bridge high pier [26] under three-directional ground motion. Figure 18(a) shows the arrangement of the test structure model on the shake table. The height of the model is 10.9 m, and the mass of the model is 69 ton. The Taft earthquake record is selected to simulate the ground motion, and the three-directional acceleration waves of it are plotted in Figure 18(b). The PGA values of the waves in three directions are 0.940, 0.799, and 0.611 g, respectively. The target wave curves and the curves measured from the shake table during the test are also compared in Figure 18(b), showing good concordance.
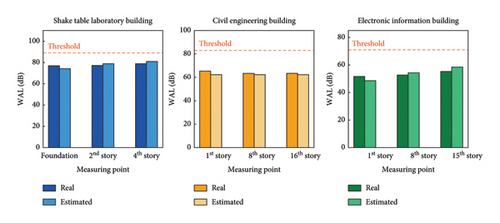
Before the shake table test, the three-directional ground motion was input to the 1D-CNN model to estimate the vibration comfort of the surrounding buildings. The estimated maximum WAL values for the STL building, CE building, and EI building were 80.80, 62.38, and 58.62 dB, respectively. The estimated WAL values for each building did not exceed the corresponding thresholds, and thus the influence of the shake table during operation was acceptable in this case.
5.2. Comparison of the Estimated and Real Vibration Comfort
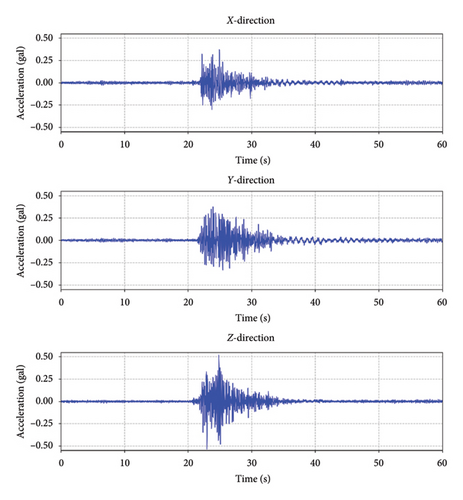
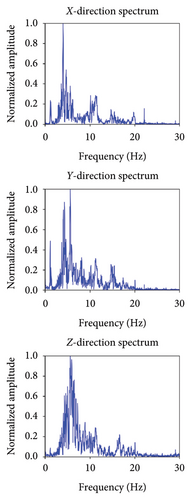
During the shake table test, the vibration responses of the surrounding buildings of the shake table were obtained from the SHMS. The Taft ground motion test was conducted on 27th October 2023, from 13:30 to 13:31 UTC + 8. Figure 19 shows the monitored accelerations in three directions at the 8th story of the EI building, as well as their Fourier spectra. The real vibration comfort of the surrounding buildings was calculated using the method introduced in Section 2.2.2. Figure 20 compares the real and estimated WAL values for the nine measuring points at the three buildings. The maximum relative errors of the estimated and real values for the STL building, CE building, and EI building were 3.37%, 4.96%, and 6.06%, respectively. As a result, the proposed method can accurately estimate the vibration comfort before conducting the shake table test, thus validating its practical value.
6. Conclusions
- (1)
According to the field monitoring data of the STL and the two surrounding buildings under the sine wave and ground motion tests, operation of the shake table can induce significant changes in maximum accelerations and WALs. Comparison between the monitoring data and the numerical analysis data proves that the vibration characteristics of the three buildings can be accurately simulated by the FEM of the SSS system.
- (2)
The vibration responses acquired through time-history analysis of the FEM excited by 12,215 groups of ground motion records represent diverse comfort evaluation results. The proportion of records that exceeds the WAL thresholds increases from 15.64% to 64.13% with the growth of the PGAs, and thus the vibration comfort cannot be simply inferred by peak acceleration values of the input ground motions.
- (3)
The designed 1D-CNN model that input the normalized three-directional ground motion signals and PGAs can well predict the vibration effect of the shake table on the surrounding buildings by estimating the WALs for nine triaxial accelerometers. The MAPE values are within 0.417% for the training dataset and 0.348% for the testing dataset; the R2 values at each measuring points exceed 0.98 for both training and testing datasets.
- (4)
In an actual shake table test, the WAL values estimated by the surrogate model before the experiment are in good agreement with the real measured values during the experiment, which indicates that the vibration comfort effects can be reasonably quantified.
Disclosure
The work described was the original research that has not been published previously and is not under consideration for publication elsewhere, in whole or in part.
Conflicts of Interest
The authors declare no conflicts of interest.
Author Contributions
The manuscript was approved by all authors for publication.
Funding
The authors would like to acknowledge the support of the National Natural Science Foundation of China (Grant Nos. 52125802, 524B2121, and U23A20661) and the Postgraduate Research and Practice Innovation Program of Jiangsu Province (Grant No. KYCX23_0278).
Acknowledgments
The authors would like to acknowledge the support of the National Natural Science Foundation of China (Grant Nos. 52125802, 524B2121, and U23A20661) and the Postgraduate Research and Practice Innovation Program of Jiangsu Province (Grant No. KYCX23_0278).
Open Research
Data Availability Statement
The data that support the findings of this study are available from the corresponding author upon reasonable request. The data are not publicly available due to privacy or ethical restrictions.


