Study on Vibration Control of Wind Turbine With an Optimised Eddy Current Tuned Rolling Cylinder Damper
Abstract
The increasing scale and capacity of wind turbines, driven by advancements in wind power technology, present significant challenges in managing fatigue loads and vibrations. To address these challenges, we have designed an eddy current tuned rolling cylinder damper (ECTRCD) which incorporates eddy current–induced damping into the traditional tuned rolling cylinder damper (TRCD) and optimised the parameters including the radius ratio, mass ratio, frequency ratio and damping ratio. The optimal frequency ratio is observed between 0.9 and 1, with the damping ratio around 0.05 and the radius ration of 1/6. On the contrary, the optimal damping performance improves as the mass ratio increases. Additionally, the reduction ratio of the equivalent fatigue load is 17.7% by the ECTRCD with the optimal parameters (a radius ratio of 1/6, a mass ratio of 1.2%, a frequency ratio of 0.943 and a damping ratio of 0.059). Compared with the TRCD, the enhancement in this value is modest, with only a 1% improvement. Nevertheless, the displacement at the tower top in the side-to-side direction is significantly mitigated, particularly under high wind speeds. This finding underscores the potential of the ECTRCD as a promising alternative to conventional TRCDs, offering enhanced damping performance and improved structural stability.
1. Introduction
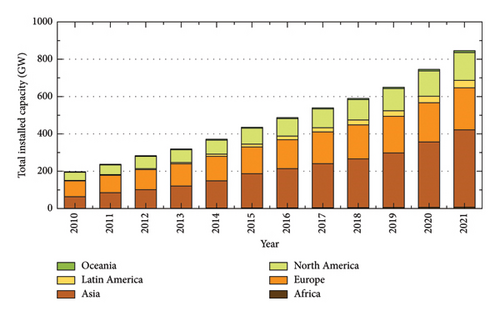
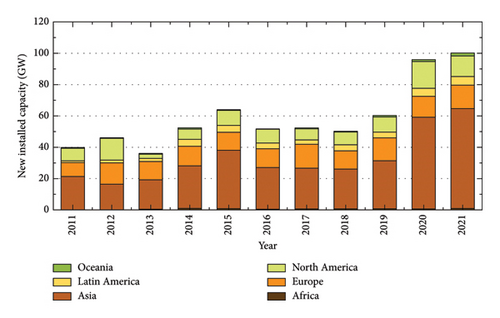
Wind energy represents a clean and renewable power source, distinctly advantageous over fossil fuels due to its nonemissive nature and minimal contribution to climate change. Utilising wind power significantly reduces dependency on fossil fuels and lowers greenhouse gas emissions, thus playing a crucial role in mitigating climate change impacts. Recent statistics from the World Wind Energy Association (WWEA) [1] highlight the rapid development of the global wind power industry over the past decade. Specifically, global installed wind capacity has surged from 197 GW in 2010 to 846 GW in 2021, now contributing 7% to the total electricity supply in Figure 1(a). Furthermore, the annual increase in installed capacity has shown a marked upward trend, with 59.3 GW added in 2019, rising to 100.2 GW in 2021, nearly doubling and exhibiting signs of stabilisation in Figure 1(b).
The rapid advancement of the wind power industry has led to an increase in the size and capacity of wind turbines, posing significant challenges in managing their vibration and fatigue loads. To enhance structural performance, dampers are commonly installed on high-rise buildings, towers and wind turbines to mitigate structural vibrations. Zuo, Bi and Hao [2] have reviewed the latest technologies for vibration control in wind turbines, highlighting the prevalence of passive dampers, such as tuned mass dampers (TMDs) [3, 4], tuned liquid dampers (TLDs) [5], tuned rolling ball dampers (TRBDs), tuned rolling cylinder dampers (TRCD) [6] and energy absorbing dampers [7].
The TMD has been widely adopted for controlling wind turbine vibrations. Both active [8–12] and semiactive [13] TMDs, alongside their passive counterparts [14–18], have been widely employed to address vibrations in turbine towers. Compared with the active and semiactive TMD, the passive TMDs are more robust, simple and cost-effective. Ghassempour, Failla and Arena [14] demonstrated the effectiveness of TMDs in mitigating wind turbine vibrations and proposed that tuning the TMD frequency to match varying wind conditions could enhance performance. Chen et al. [19] leveraging the artificial fish swarm algorithm (AFSA) within a pile–soil coupling framework, successfully optimised TMD parameters, lowering the tower’s natural frequency from 0.26 to 0.235 Hz. Similarly, optimisation techniques such as AFSA [20], particle swarm optimisation (PSO) [21] and iterative linear matrix inequalities [22] have been utilised to refine TMD configurations, taking into account model uncertainties and physical constraints. Several other improved TMDs [23–26] are also designed, to suppress bidirectional vibrations in wind turbine towers. The adaptive-passive TMDs [27–29] are proposed to reduce the vibration induced by winds and other external excitations. Despite these advancements of TMD, issues such as spring fractures and oil leakage still exist. Such failures not only diminish the effectiveness of vibration mitigation but also risk secondary damage to the main structure.
As an alternative to the conventional TMD, TRCD comprising primarily a rolling oscillator and its track, dispense with the need for additional spring stiffness and oil pump damping systems. Unlike pendulum-type TMDs, TRCDs adjust their operating frequency through modifications to the track radius, thereby eliminating the conventional suspension system. This design not only enhances space efficiency but also better meets the vibration reduction needs of structures of varying sizes, improving overall system flexibility, efficiency and applicability. The concept of the ball vibration absorber (BVA), first introduced by Priner [30] for mitigating pedestrian bridge vibrations, has since evolved with Matta [31] proposing uniform and discrete isomorphic BVA types. These designs were validated through experimental and numerical analyses, demonstrating BVA’s simplicity, cost-effectiveness, compactness and ease of maintenance. Legeza [32] further investigated the dynamic behaviour of homogeneous rolling balls within a spherical guide rail, deriving motion equations and calculating structural vibration responses under linear viscous forces. The exceptional characteristics of BVA as a passive vibration mitigation measure have promoted extensive research [33–35]. Based on these principles, Zhang et al. [36] and Li, Fu and Kong [37] developed TRCDs, replacing balls with rolling cylinders, resulting in a two-dimensional simplified model TRCD. Tsuda and Saeki [38] advanced this work by exploring TRCD parameters, establishing the relationship between damper structural features and vibration reduction performance and providing foundational guidelines for TRCD design. Wang, Liu and Ma [6] evaluated TRCD performance in wind turbine vibration control under real wind conditions, concluding that optimal performance is achieved when the roller’s moment of inertia is minimised. Meanwhile, Sarkar and Chakraborty [39, 40] designed a semiactive tuned liquid column damper with optimal parameters for mitigating wind turbine tower vibrations. However, TRCD relies on rolling friction for energy dissipation, which may not provide sufficient damping for systems with high vibration energy.
Eddy current damping is a phenomenon where a conductive material moving through a magnetic field generates electric currents that resist motion and help dampen vibrations. This technique can be integrated with traditional dampers to enhance vibration control efficacy. As early as 1995, Larose, Larsen and Svensson [41] designed a unidirectional eddy current TMD (ECTMD) for bridge vibration control, although practical applications were limited. Leng et al. [42] investigated the performance of magnetorheological elastomer (MRE)-based TMDs for wind turbine vibration control. Chen et al. [43] reviewed the efficacy of TMDs in vortex-induced vibration control and developed an eddy current device to replace traditional oil pump systems. They employed genetic algorithms to optimise the design parameters of the multiple tuned mass damper (MTMD), finding that permanent magnets arranged with the same polarity and a magnetic circuit design with a magnetic guiding outer cylinder resulted in the highest eddy current density and damping efficiency. Lou et al. [44] introduced an omnidirectional cantilever beam-type ECTMD for lattice tower structures, demonstrating its effectiveness in mitigating both along-wind and crosswind vibrations. Eddy current damping has been widely utilised to enhance the performance of TMDs. However, its application to improve the performance of TRCDs remains unexplored.
- 1.
A novel ECTRCD is designed, and the parameters including radius ratio, mass ratio, frequency ratio, damping ratio are optimised to improve the vibration mitigation performance.
- 2.
A comparative comparison of the vibration control performance between the traditional TRCD and the ECTRCD is carried out.
- 3.
An investigation into the impact of the optimised ECTRCD on the fatigue loads and vibrations of wind turbines is carried out.
This study is organised as follows: Section 2 outlines the numerical models employed, including the wind condition and wind turbine model. Section 3 details the damper models, including the TRCD, the eddy current damping model and the proposed ECTRCD. Section 4 presents the wind turbine verification, parameter optimisation for both the TRCD and ECTRCD in controlling wind turbine vibrations and the performance of both dampers. Finally, the conclusions of this study are summarised in Section 5.
2. Numerical Models
2.1. Wind Condition
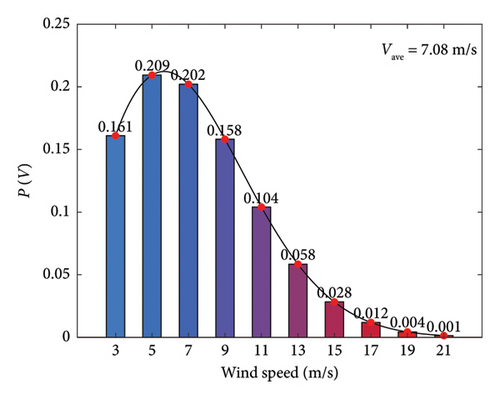
The Weibull parameters can be determined by the long-term observation data in a special region. In this study, the annual average wind speed design value for the actual operating wind field is 7.08 m/s, and the shape parameter is k = 2. The scale parameter is C = 7.99. According to IEC 61400-13 (2015) [46], statistical wind speed values are selected at intervals of 2 m/s, including 3, 5, 7, 9, 11, 13, 15, 17, 19 and 21 m/s. The occurrence probabilities of each wind speed are calculated based on equation (1), as shown in Figure 2. It can be observed from the figure that the maximum occurrence probability for a wind speed of 5 m/s is approximately 0.209.
In this study, the vertical wind speed profile is modelled using a power law with an exponent of 0.2. The wind speed at hub height serves as the reference, enabling the derivation of the corresponding vertical distribution of wind speed.
2.2. Aerodynamic Forces
2.3. Wind Turbine Model
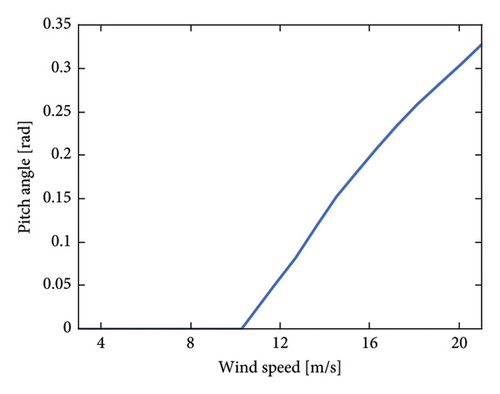
An onshore wind turbine Org-H155-4.5 MW is adopted in this study. The basic dynamic parameters of the wind turbine are shown in Table 1. It is noted that the hub height and rotor diameter are 94.5 and 155 m, respectively. The cut-in, rated and cut-off wind speeds are 3, 10.2 and 22 m/s. The relationship between the wind turbine’s pitch angle and wind speed is illustrated in Figure 3, serving as the basis for implementing the pitch control strategy. The Cartesian coordinate system is defined as shown in Figure 4.
| Terms | Values |
|---|---|
| Hub height | 94.5 m |
| Rotor diameter | 155.0 m |
| Rated power | 4500 kW |
| Cut-in wind speed | 3.0 m/s |
| Rated wind speed | 10.2 m/s |
| Cut-off wind speed | 22.0 m/s |
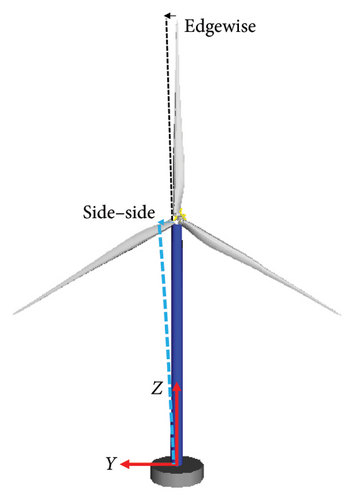
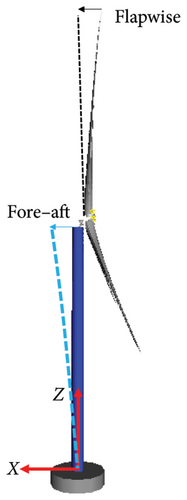
The commercial multibody simulation software Simpack [48] is adopted, and the detailed description of the process of constructing wind turbine model is presented in this study. In this model, a linear elastic material is used, and the relevant modelling is completed by referencing the material properties defined under the tower panel in the GH-Bladed model. The sectional properties at various heights are set according to the tower geometric model data in the GH-Bladed model. The tower is modelled using the linear SIMBEAM approach, specifying the height and sequence of each section. The initial damping ratio is defined as 0.02, as defined by Wang, Liu and Ma [6]. The tower base is fixed on the ground without any displacement during operation. In Simpack, an RBL file for blade modelling is first created based on the blade properties, and the automated modelling of the blade is completed using the utilities function page. The additional mass on the blade is defined using the same method as for the tower. The blade is fixedly connected to the hub unit, restricting relative displacement between the blade root and the connecting unit in all six degrees of freedom. The yaw system was set up and installed on the tower top which moves with the displacement of top tower. A rigid nacelle with a predefined mass and moment of inertia is built on the tower top, which is fixed on the yaw system. The gearbox and generator are built in the nacelle as rigid bodies, being able to rotate around the x-axis. Three blades are flexible bodies and installed at the hub. The blade pitching can be simulated by rotating around the z-axis. The initial damping ratios of blade in the flapwise and edgewise directions are 0.4 and 0.007, respectively, and the first six mode shapes are considered. Various inflow wind conditions generated by the TurbSim module are used, and aerodynamic loads are added using the AeroDyn V13 force element. The blade pitching and rotor angular velocity are controlled by the control element. The blades rotate under different inflow conditions to generate electricity and the blade and tower vibrates during operation. The numerical model in Simpack is shown in Figure 4.
3. Damper Models
3.1. TRCD
The TRCD typically consists of a rolling cylinder, a rolling cylindrical track and a track support system, as shown in Figure 5. The track (represented by the black arc in Figure 5) is fixed to the main structure through the support system (represented by the blue line in Figure 5). When the main structure vibrates under external excitations, the rolling cylinder (represented by the red circle in Figure 5) moves freely on the track. The motion of the rolling cylinder provides additional damping to the main structure. Therefore, after installing the TRCD, the vibration of the main structure can be controlled and its vibration damping ratio can be improved.
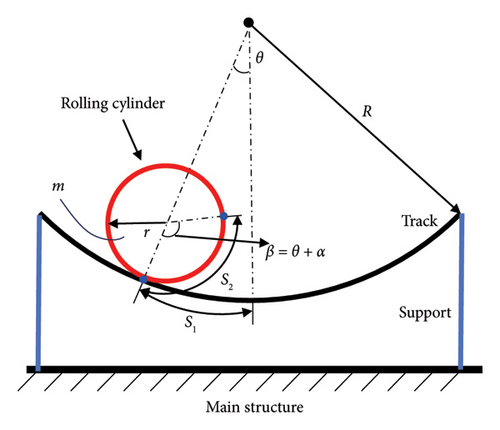
From the above equations, it is noted that the natural frequency of the TRCD is mainly determined by the gravitational acceleration g and the length of the pendulum l = R − r. The longer the pendulum length, the smaller the natural frequency of the TRCD.
3.2. Eddy Current Damping Model
In low-speed electromagnetic systems, the calculation of electromagnetic forces on conductors within a magnetic field often relies on magnetic circuit theory. Magnetic circuit theory is widely applied in engineering for determining linear electromagnetic forces and provides a foundational framework for approximating the effects of low-speed linear eddy current damping.
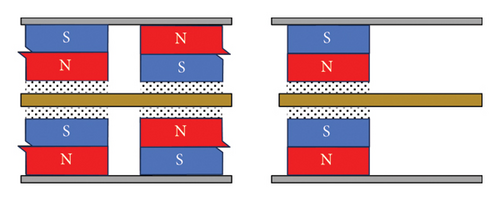
To explore the application of magnetic circuit theory in generating linear damping forces, we designed a rolling disk eddy current damper, as illustrated in Figure 6. This design accounts for the high linear velocity at the disk’s edge, where maximising the radius intersecting magnetic field lines enhances the eddy current damping force. To achieve this, the magnetic steel is strategically positioned along the outermost circumference with alternating poles and specific spacing to optimise magnetic performance. Additionally, magnetic steel is symmetrically arranged on both sides of the disk with opposing polarities to maintain balance. For analytical clarity, the cylindrical disk is unfolded radially, producing a schematic of its circumference and radial configuration, as depicted in Figure 7.
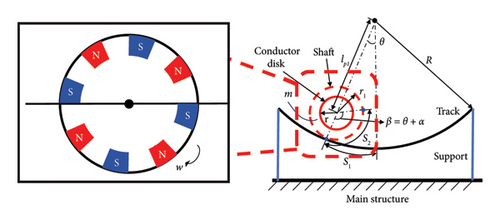
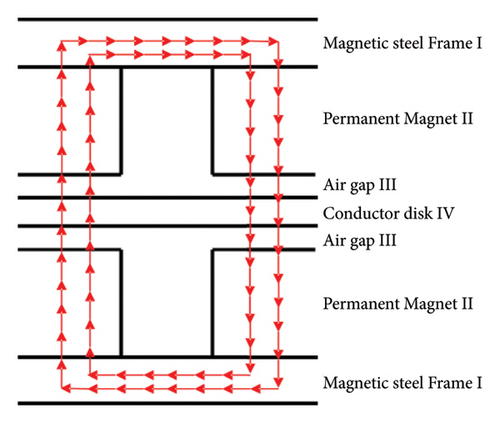
As illustrated in Figure 8, the cylindrical disk features a symmetrical structure on both sides, comprising the magnetic steel frame, the permanent magnet, the air gap and the conductor disk. According to magnetic circuit theory, the high magnetic permeability of the steel frames confines the magnetic flux between the central magnetic steel and the conductor disk. When the conductor disk moves relative to the magnetic steel, Kirchhoff’s law allows the disk to be conceptualised as composed of numerous rotating current elements. After half a cycle of motion, the magnetic field reverses direction, inducing a current that is dissipated as internal energy through the material’s resistance, resulting in energy loss. By considering half-cycle units and analysing half of the adjacent magnetic poles, the magnetic circuit projection on the circular arc surface, as shown in Figure 8, is derived, with arrows indicating the direction of magnetic flux.
3.3. ECTRCD
Based on the traditional TRCD model, the ECTRCD is designed where the electromagnetic damping mechanism enhances overall energy dissipation, making the ECTRCD more effective across a broader frequency range compared to the TRCD, which relies solely on rolling friction. The transmission component is uniquely engineered to allow variable velocities of the rolling cylinder during rotation, creating speed differentials at different positions along the cylinder. The structure of the ECTRCD includes a conductor disk, magnetic steel and magnetic disks in Figure 9. The conductor disk, along with the conical shaft, forms part of the rolling cylinder oscillator. Magnetic steel, mounted on the magnetic disk in alternating N and S poles along the circumference, generates electromagnetic damping through its interaction with the conductor disk. The conductor disk and magnetic disks are separated by an air gap, ensuring that when the rolling cylinder rotates, the magnetic disks remain stationary, causing relative motion between the conductor and magnetic steel. This motion induces eddy currents, producing electromagnetic damping torque.
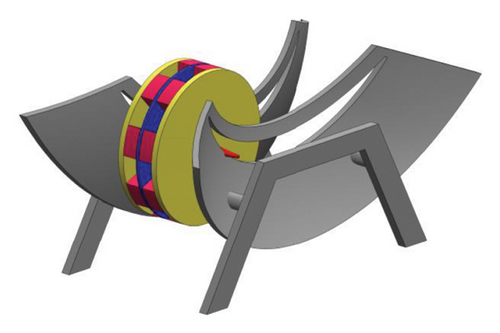
The ECTRCD’s design transforms horizontal vibrations of the main structure into rotational motion of the rolling cylinder via the support track, as seen in conventional TRCD systems. The electromagnetic torques convert the kinetic energy of the rolling cylinder into internal energy, effectively dissipating the vibration energy of the primary structure and mitigating its vibrational response.
- 1.
The conventional rolling cylinder is replaced by a combination of a rolling cylinder and conductor disk, increasing rotational inertia through the enhanced mass and radius of the conductor disk, while also enabling electromagnetic damping.
- 2.
An electromagnetic system, consisting of magnetic steel and magnetic disks, is added around the conductor disk. As the rolling cylinder system rotates, relative motion between the conductor disk and magnetic steel induces currents, providing additional damping.
- 3.
The conical roller and arc-shaped guide track are designed to enable speed variation across different positions. The greater the overall rotation angle of the rolling cylinder system relative to the guide track, the faster the conductor disk rotates, enhancing the system’s performance.
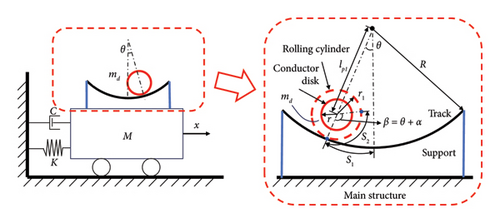
The theoretical model of the ECTRCD, simplified as shown in Figure 10, adheres to the fundamental design principles of a TRCD, comprising a rolling cylinder, a rolling cylinder track and a track support system. To enhance the rotational inertia of the wheel and accommodate electromagnetic damping, an auxiliary cylinder body supports the rolling cylinder. Additionally, a magnetic field is introduced between the auxiliary cylinder and the rolling cylinder.
4. Results and Discussion
4.1. Verification of Wind Turbine Model
To assess the accuracy of the wind turbine model, key structural parameters of the tower and blades were calculated and compared against those of the GH-Bladed model [49]. A comparison of the first six blade mode frequencies and the first four tower mode frequencies reveals a maximum error of 1.6% in Table 2, demonstrating strong consistency in dynamic characteristics between the two models, thereby validating the reliability of the Simpack model for subsequent analyses.
| Parameters | Simpack (Hz) | GH-Bladed (Hz) | Relative error (%) |
|---|---|---|---|
| Blade 1st order mode | 0.428 | 0.427 | 0.2 |
| Blade 2nd order mode | 0.696 | 0.695 | 0.5 |
| Blade 3rd order mode | 1.165 | 1.164 | 0.08 |
| Blade 4th order mode | 1.955 | 1.957 | 0.2 |
| Blade 5th order mode | 2.371 | 2.374 | 0.13 |
| Blade 6th order mode | 4.000 | 3.995 | 0.13 |
| Tower 1st order mode | 0.261 | 0.260 | 0.4 |
| Tower 2nd order mode | 0.266 | 0.262 | 1.6 |
| Tower 3rd order mode | 1.464 | 1.462 | 0.14 |
| Tower 4th order mode | 1.470 | 1.468 | 0.27 |
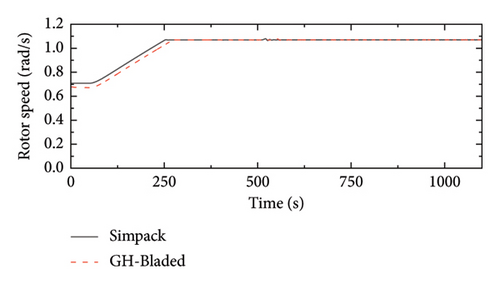
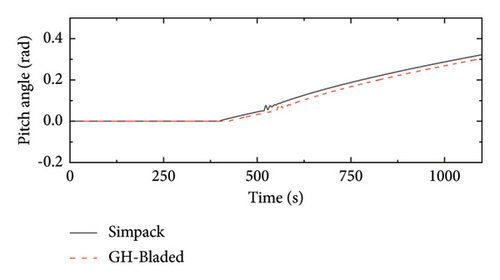
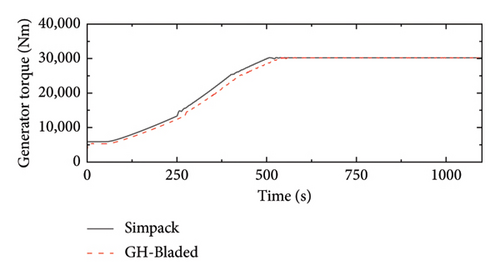
To further verify the Simpack model’s accuracy, a comparison of key state variables, including the rotor speed, the blade pitch angle and the generator torque, between the Simpack and GH-Bladed models, employs a linearly varying wind scenario. In this case, the wind speed starts at 5 m/s and increases linearly to 20 m/s over a period of 1100 s. The results for these variables were found to be in exact agreement, confirming the accuracy of the control system representation in the Simpack model in Figure 11.
4.2. Parameter Optimisation of TRCD for Vibration Control of Wind Turbine
The TRCD system consists of an oscillating cylinder with a mass of md and a two-dimensional curved guide track with a radius R. The arc surface of the curved guide track is coaxially aligned with the arc surface of the oscillating cylinder, allowing the cylinder to roll freely along its axis of rotation. Figure 12 illustrates the basic TRCD model and its installation in Simpack.
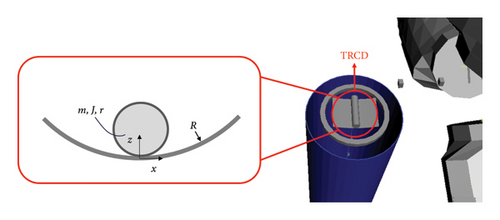
The oscillating cylinder is a rigid structure with a geometric dimension of r × h and a material density ρd. The rotational inertia about the axis is given by 1/2ρdhπr4. The 18-force element (Unilateral Spring-Damper Cmp) in Simpack is used to model the normal contact force between the cylinder and the track, which constrains the cylinder’s motion within the guide track. Additionally, the 100-force element (Nonlinear Friction Cmp) is employed to simulate the frictional force at the contact point between the cylinder and the track. Assuming the damping coefficient of the TRCD is cd, the friction damping force is constructed between the centre of the arc and the rotational reference point using the 43-damping force element (Bushing Cmp), in line with the theoretical derivation.
Using the derived formulas, the dimensionless parameters, namely, the mass ratio μ, frequency ratio ν and damping ratio ξ, are constructed across a gradient grid, as detailed in Table 3. The grid designates the following ranges: the mass ratio varies from 0.2% to 1.2%, in steps of 0.2%; the frequency ratio spans from 0.7 to 1.6, with increments of 1/15; and the damping ratio covers values from 0.01 to 0.2, with increments of 0.02. These settings yield 6, 10 and 10 values for each parameter, respectively, producing a total of 600 parameter combinations. To achieve the optimisation objective of minimising EFL, such as the tower base bending moment, simulations are conducted under 10 different wind speed scenarios for each combination. This approach results in a comprehensive analysis encompassing 6000 distinct operating conditions in the TRCD parameter study.
| Parameter | μ (%) | ν | ξ |
|---|---|---|---|
| Range | 0.2∼1.2 | 0.7∼1.6 | 0.01∼0.2 |
| Step | 0.2 | 1/15 | 0.02 |
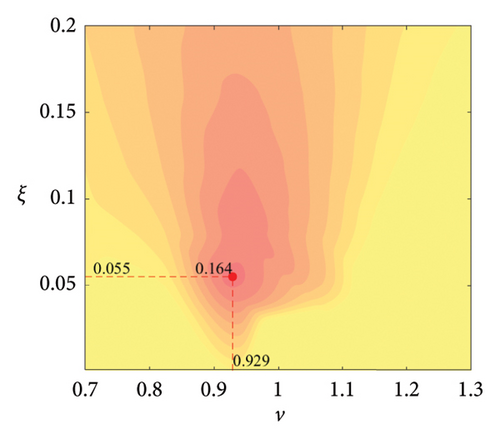
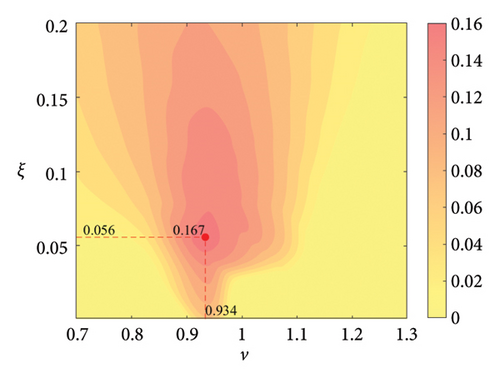
The cloud map illustrating vibration reduction performance across various parameters is presented in Figure 13. The optimal performance is achieved with a mass ratio of 1.2%, a frequency ratio of 0.934 and a damping ratio of 0.056. At a constant mass ratio, the relationship between vibration reduction performance, frequency ratio and damping ratio is distinctly nonlinear, generally increasing initially before tapering off. The optimal frequency ratio is observed between 0.9 and 1, with the damping ratio around 0.05. A comparative analysis of the damper’s vibration reduction effect across different mass ratios shows an initial increase followed by gradual convergence. The incremental improvements in vibration reduction performance for successive mass ratios are −0.002, 0.028, 0.0037, 0.009 and 0.003, respectively, with the peak performance occurring at a mass ratio of 1.2%. Beyond this threshold, further increases in mass yield negligible improvements, indicating a saturation effect in the TRCD system’s vibration reduction capacity.
4.3. Parameter Optimisation of ECTRCD for Vibration Control of Wind Turbine
Similar to the TRCD, the ECTRCD comprises a rolling cylinder oscillator and a two-dimensional curved guide track. The oscillator is further subdivided into a supporting shaft and a rotating disk, with the mass and moment of inertia of the supporting shaft set to 0.001 to avoid computational instability and reduce its influence on the simulation outcomes. The rotating disk is rigidly attached to the supporting shaft. A detailed schematic of the system configuration is presented in Figure 14, illustrating the overall structural layout and component integration.
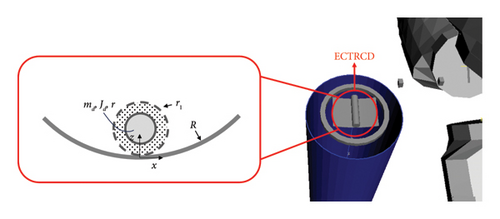
Similar to the friction damping force, the eddy current damping force is applied between the reference points of the rolling cylinder and the supporting structure using the 43-damping force element (Bushing Cmp) in Simpack with the damping coefficient ce. The eddy current damping coefficient ce can be derived by equation (33) once the damping ratio is specified. Additionally, for the ECTRCD system, the friction damping force is negligible, effectively rendering the friction damping coefficient cd is zero.
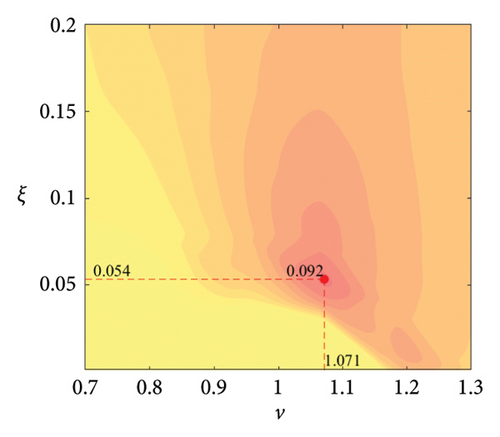
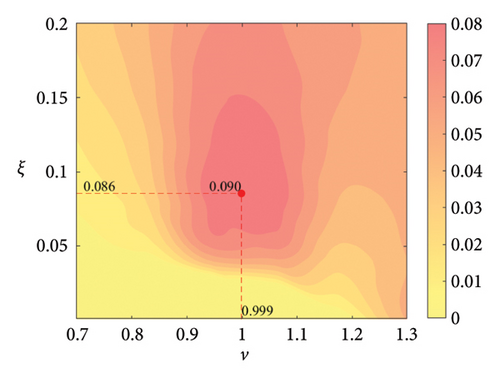
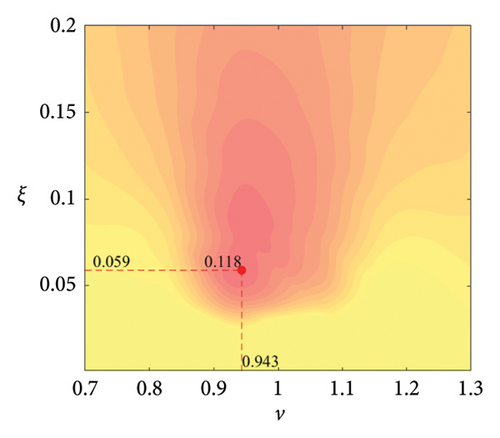
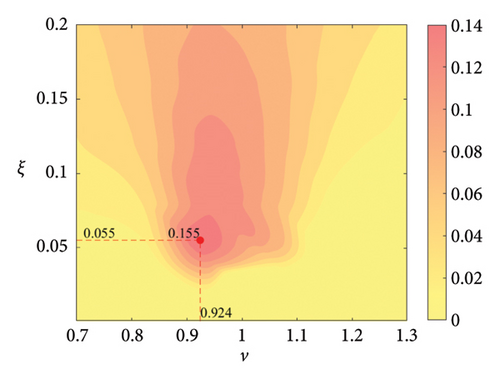
The parameter settings for the ECTRCD are detailed in Table 3, where multiple parameters are evaluated. The radius ratio τ is varied across values of 1/6, 1/3, 3 and 6, with the rolling cylinder radius denoted as r1. For each τ, the parameter configuration mirrors that of the TRCD, resulting in a total of 600 distinct parameter combinations. Using the EFL of the tower base bending moment as the optimisation objective, 10 wind speed scenarios are assessed for each parameter combination. Consequently, for each radius ratio, a total of 6000 operating conditions are analysed in the ECTRCD parameter study. The results of this optimisation are illustrated in Figures 15, 16, 17, 18.
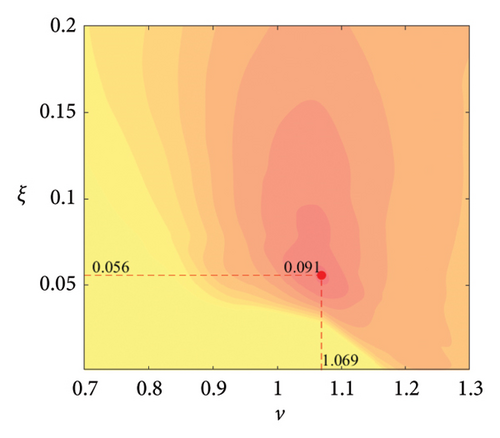
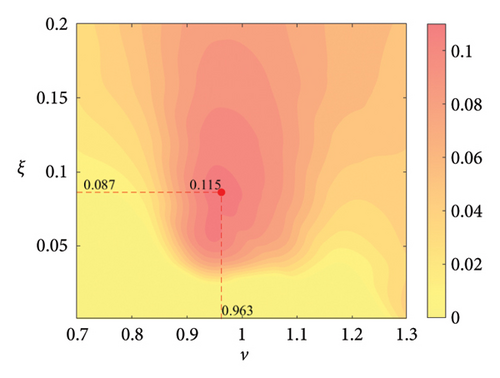
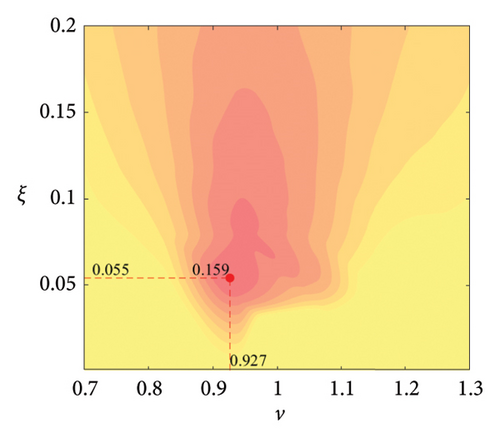
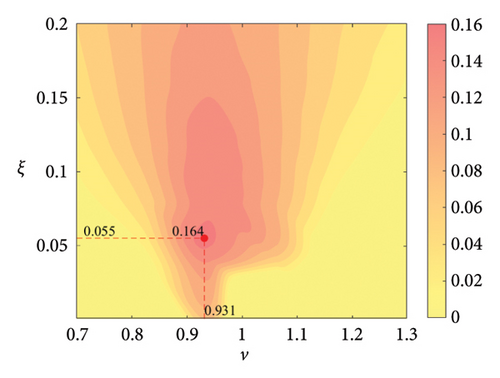
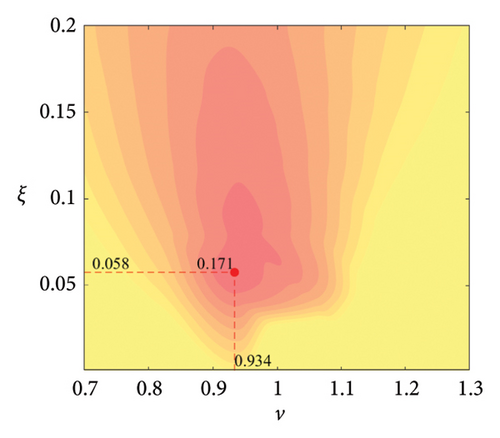
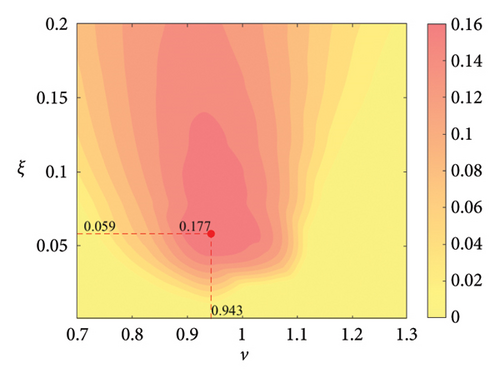
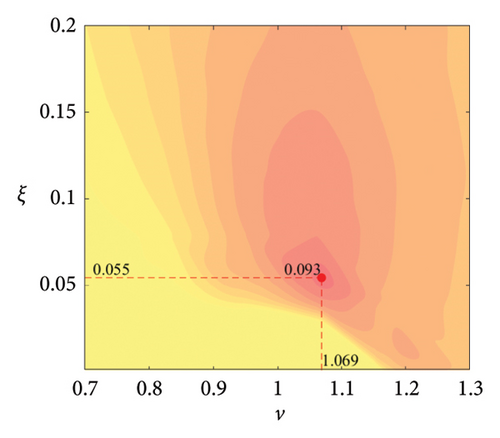
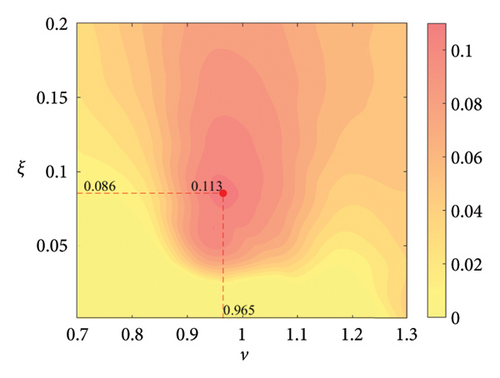
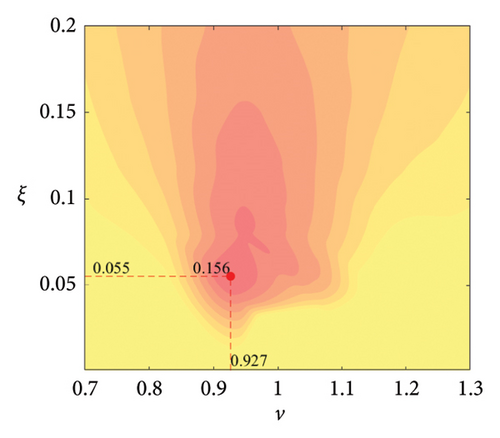
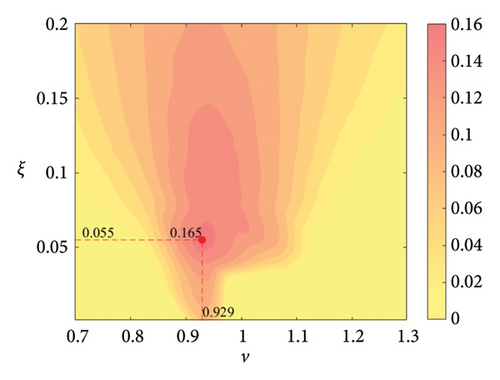
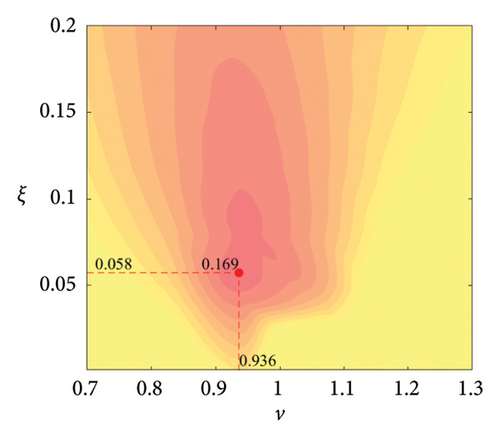
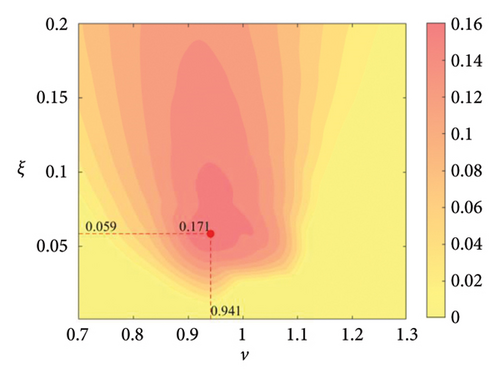
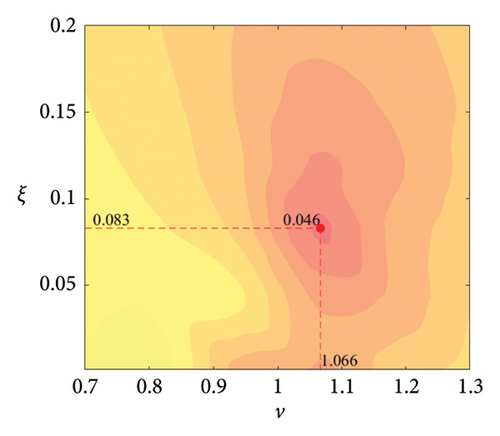
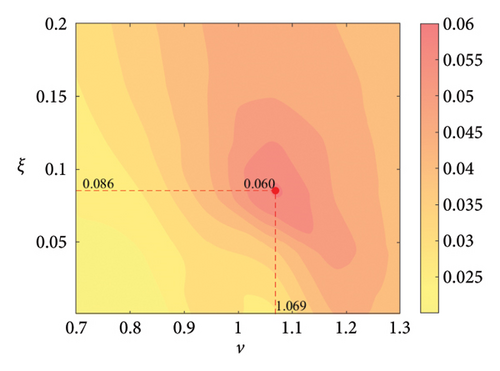
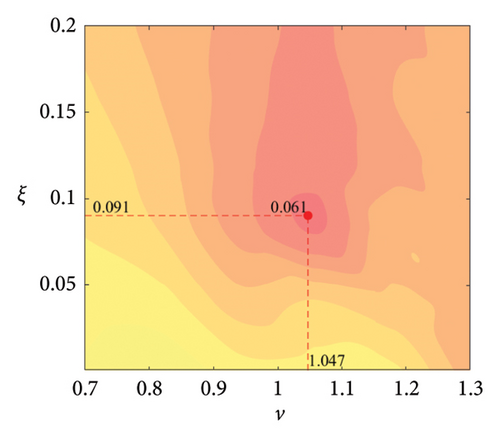
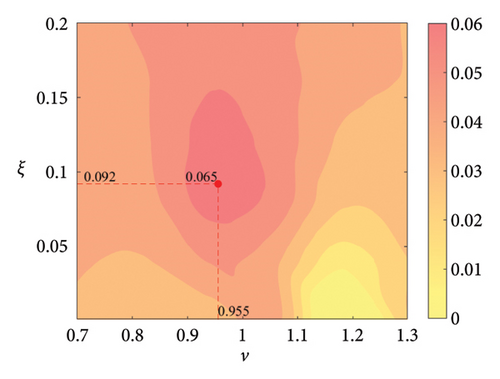
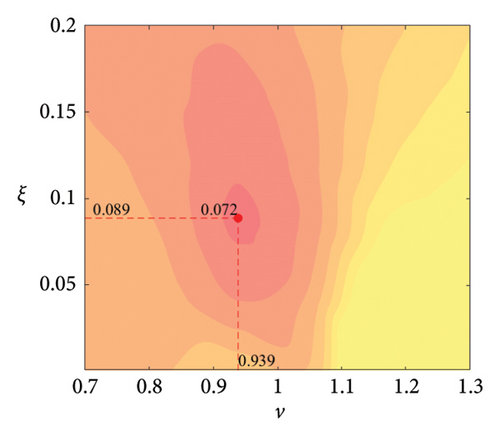
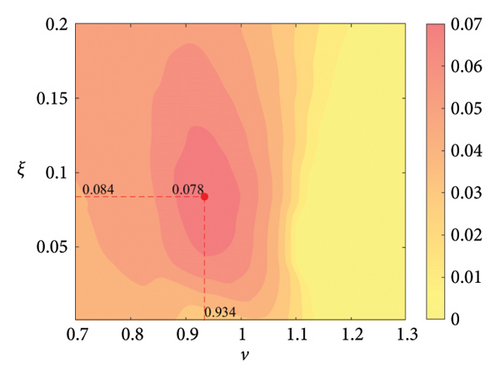

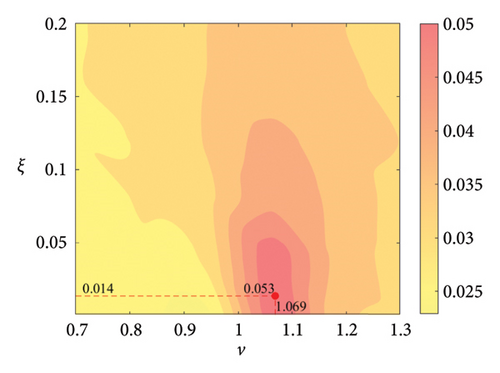
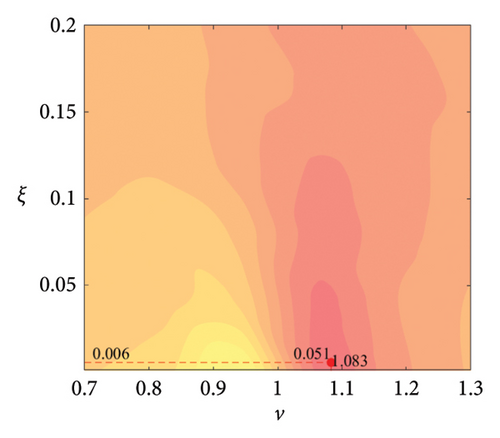
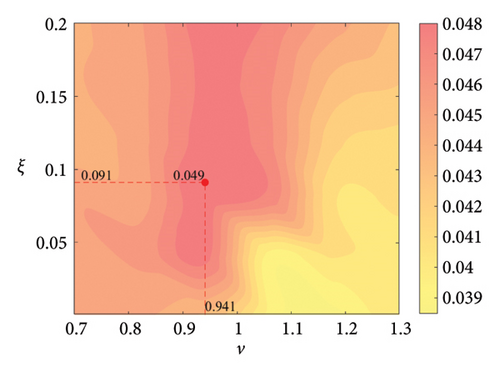
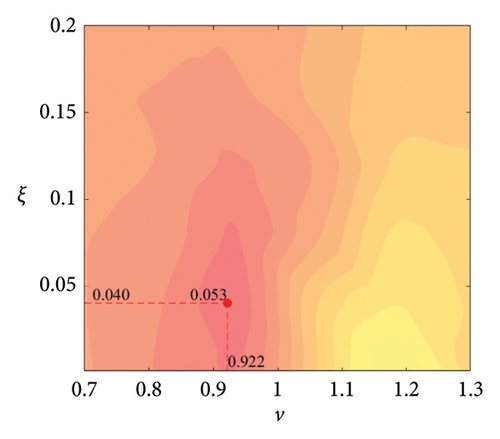
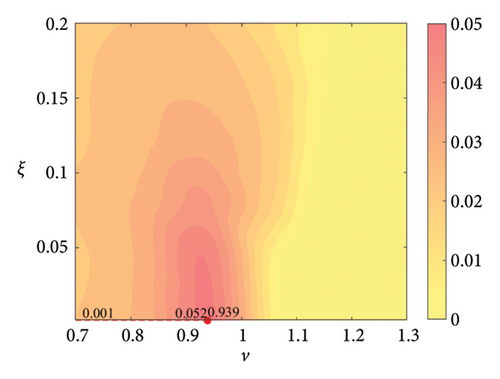
For each τ value, optimal parameter configurations for maximising damping performance can be identified. For instance, with a radius ratio of 1/6, a mass ratio of 1.2%, a frequency ratio of 0.943 and a damping ratio of 0.059, the ECTRCD achieves an optimal damping efficacy of 17.7%. Additional optimal configurations are presented in Figures 15, 16, 17, 18. Similar to the behaviour observed in the TRCD, the damping performance exhibits a nonlinear trend with respect to the frequency ratio ν, and damping ratio ξ, initially increasing before reaching a peak and subsequently declining as the parameters continue to rise. The optimal frequency ratio fluctuates notably between 0.9 and 1.1, while the damping ratio displays even greater variability.
A comparison of the optimal damping efficacy across different mass ratios indicates that, like the TRCD, the damping performance increases initially and then plateaus as the mass ratio is further augmented. Furthermore, when comparing the optimal damping performance of the ECTRCD across different radius ratios, the results show values of 17.7%, 17.1%, 7.8% and 5.3% for radius ratios of 1/6, 1/3, 3 and 6, respectively. This demonstrates a clear trend as the radius ratio increases, the damping efficacy of the ECTRCD decreases. The increase in radius ratio leads to a higher moment of inertia of the rotating disk, consistent with findings from previous studies, such as those in [6], regarding optimised TRCD designs.
The ECTRCD outperforms the TRCD in damping efficacy, offering a more refined design space through the adjustment of the radius ratio τ. This highlights the role of eddy current damping in enhancing the overall performance of the ECTRCD. Specifically, reducing the radius ratio while keeping mass and frequency ratios constant increases the guide track radius and amplifies the rotational amplitude of the rolling column oscillator around the track centre. This elevated rotational velocity of the rolling cylinder oscillator generates a stronger eddy current damping force, further improving the system’s overall damping efficiency.
4.4. Comparisons of the Performance of Two Different Dampers
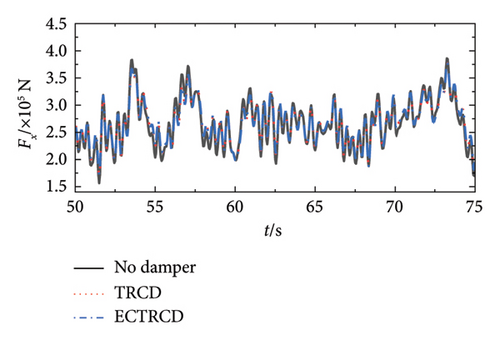
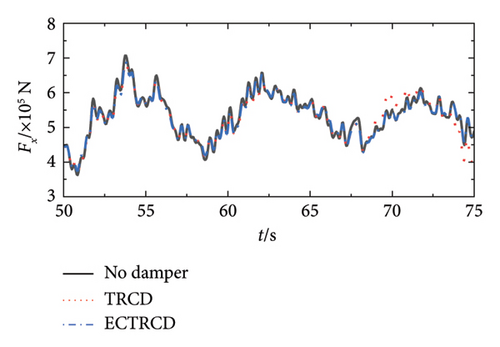
The optimised damper parameters, including those for the TRCD and ECTRCD across various radius ratios, were selected for further analysis. In accordance with the [50], a comprehensive simulation under normal power generation conditions was conducted. The lateral shear force and base moment of the wind turbine tower were extracted for comparison. During lateral load calculations, adjustments were made to the installation orientation of the damper to ensure optimal performance. As the simulation in Simpack covers the full operational process of the wind turbine, from startup to stable operation, the initial 50 s of data was excluded to eliminate transient effects. To provide a more precise assessment of the dampers’ impact on wind turbine load response, the wind speed for the primary simulation condition was set at 11 m/s, near the rated speed of the turbine. Additional comparisons were performed under low (3 m/s) and high (21 m/s) wind speed conditions, corresponding to the cut-in and cut-out speeds of the turbine, respectively.
4.4.1. Forces at the Tower Base
Figures 19 and 20 depict the lateral shear force and moment at the tower base under various wind conditions with different damper configurations. The data demonstrate that the installation of dampers substantially influences aerodynamic loads in both the fore–aft and side-to-side directions across different wind speeds. In the fore–aft direction, dampers effectively reduce peak forces, highlighting their capacity to mitigate the primary structure’s vibrational response. However, the variations between curves are relatively minor due to two primary factors: first, the substantial forces in the fore–aft direction mean that while dampers mitigate load fluctuations induced by gusts, the static load from the wind field remains significant and less affected over time. Second, the inherent structural and aerodynamic damping already present in the wind turbine contributes to the overall damping, rendering the additional effect of the dampers comparatively limited.
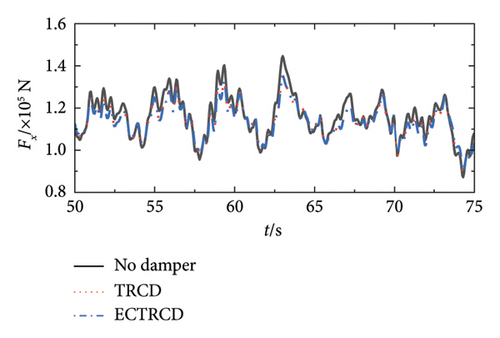
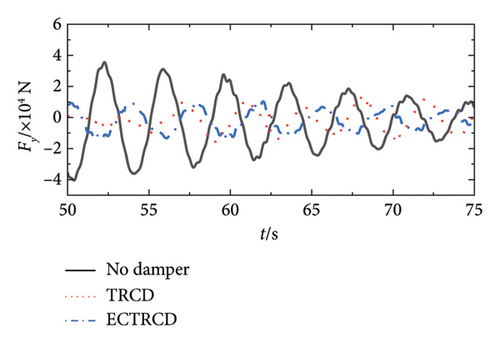
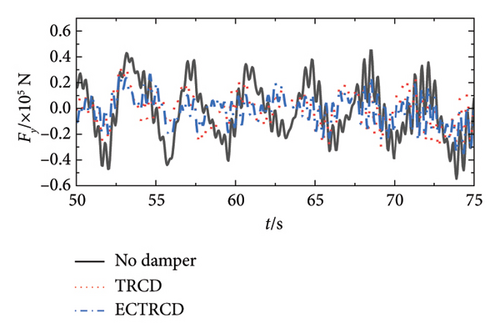
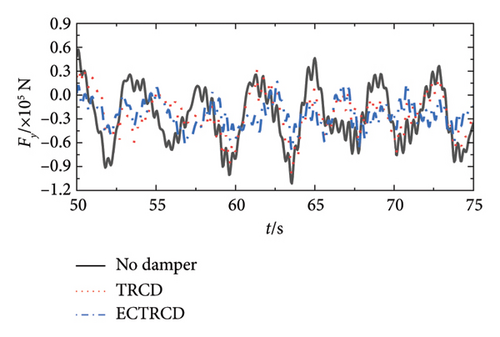
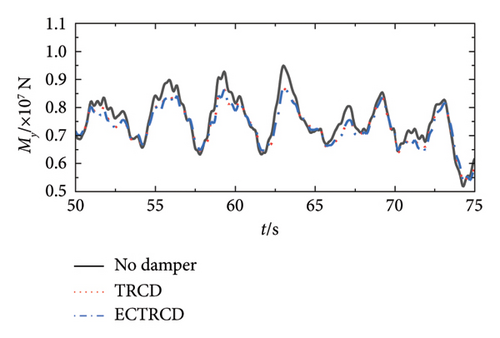
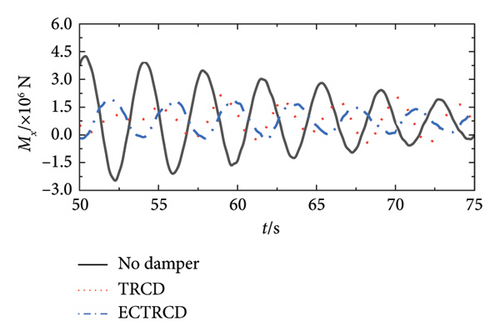
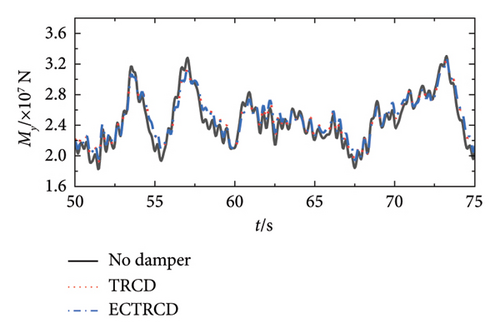
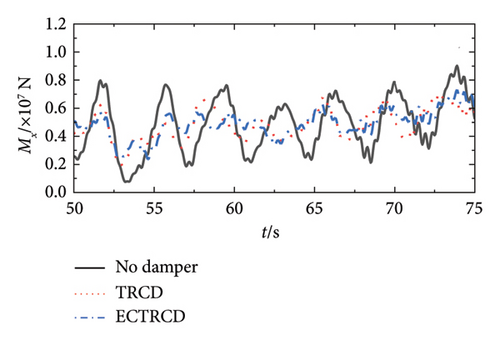
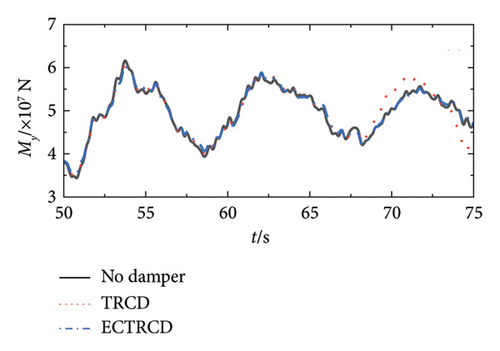
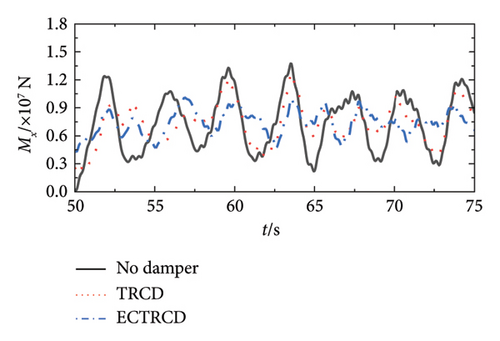
Conversely, the impact of dampers on forces and moments in the side-to-side direction is more pronounced. Figures 19 and 20 reveal that different dampers not only reduce peak loads but also modify the lateral vibration characteristics of the wind turbine, including changes in load vibration frequency. This more pronounced effect arises because the wind turbine’s lateral stiffness and damping are relatively low, allowing for greater influence from the dampers. Additionally, since the turbine’s lateral orientation is perpendicular to the wind direction, the aerodynamic damping is minimal, making the turbine’s vibration characteristics highly sensitive to adjustments in the damper’s parameters.
4.4.2. Equivalent Fatigue Loads
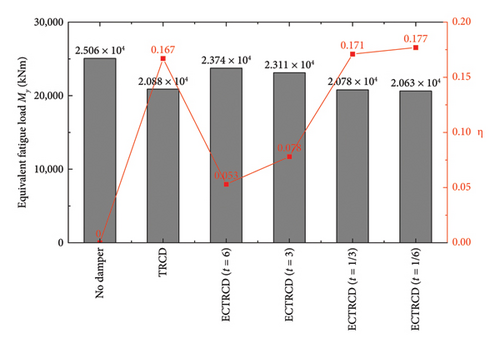
The rainflow counting method, as outlined in [51], is utilised to compute the EFL. Leveraging the previously optimised damper parameters, the EFL of the wind turbine tower’s base bending moment is analysed under the optimal vibration reduction settings for each damper, with results illustrated in the histogram shown in Figure 21. The data reveal that the ECTRCD, when considering the radius ratio of 1/6, demonstrates a nearly 6% improvement in vibration reduction performance compared to the TRCD. Moreover, the efficacy of vibration reduction with the ECTRCD enhances as the radius ratio decreases. Notably, a sharp decline in performance occurs when the radius ratio is larger than 1, with the damper’s effectiveness decreasing by 32.1% as the radius ratio shifts from 3 to 6.
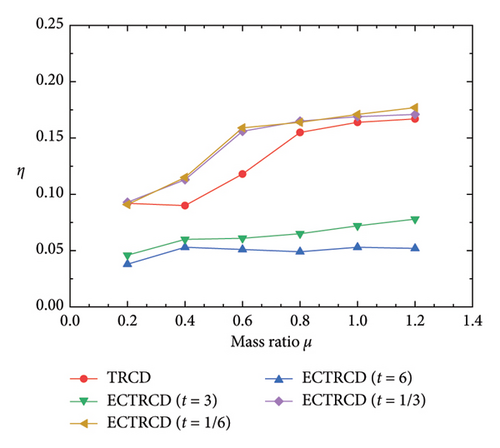
The optimal vibration reduction performance η for each damper configuration, evaluated across different mass ratios, is statistically analysed, and the resulting curve is presented in Figure 22. This analysis shows that the vibration reduction performance of the dampers initially increases with the mass ratio before stabilising, consistent with the findings from the parameter optimisation analysis. For the ECTRCD, however, when the radius ratio exceeds 1, changes in mass have a negligible effect. This indicates a potential design limitation in the ECTRCD under these conditions, where the increased mass does not adequately address the reduced guide track radius and the elevated moment of inertia of the roller, resulting in a relatively flat performance curve.
4.4.3. Dynamic Response of the Top Tower
The displacement response at the top of the wind turbine tower under various wind conditions and damper configurations is presented in Figure 23. The data clearly show that the addition of dampers affects the displacement to varying extents when compared to the undamped turbine. In the fore–aft direction, dampers are particularly effective at reducing the peak displacement without notably altering the vibration frequency, underscoring their role in mitigating the dynamic response of the primary structure. The displacement initially rises and then declines with increasing wind speed, peaking near the rated wind speed, which is consistent with engineering predictions. Similar to the aerodynamic loads, the structural and aerodynamic damping intrinsic to the turbine and the wind field diminish the additional damping provided by the dampers, leading to a reduced impact on the dynamic response at higher wind speeds.
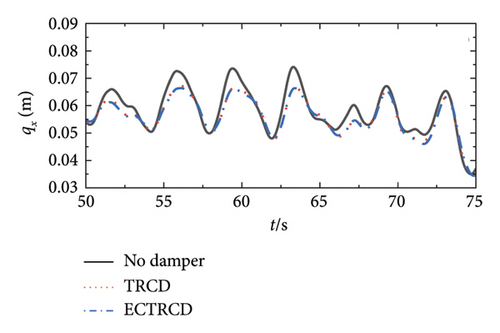
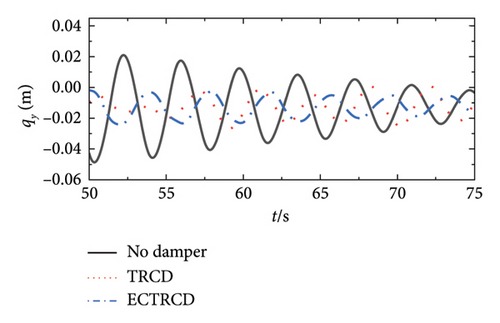
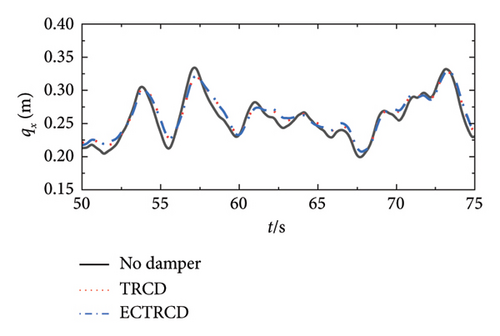
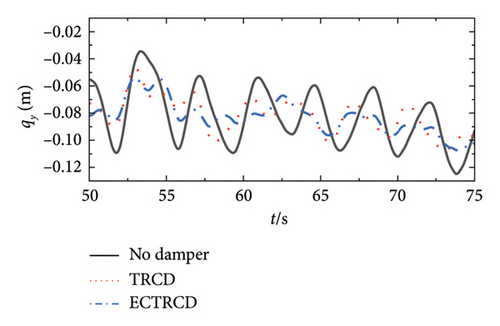
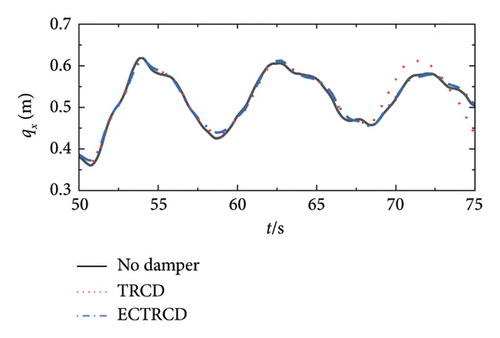
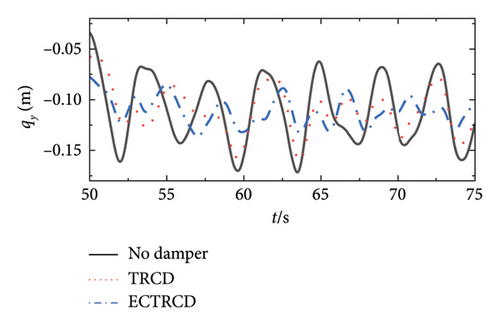
Conversely, the dampers exert a more pronounced influence on the lateral displacement. As illustrated on the right side of Figure 23, the presence of various dampers not only lowers the peak displacement but also modifies the vibration characteristics, including the frequency of lateral displacement. Unlike in the fore–aft direction, lateral vibrations of the turbine steadily increase with wind speed, which proves it is effective for the vibration mitigation of wind turbine tower in the side-to-side direction.
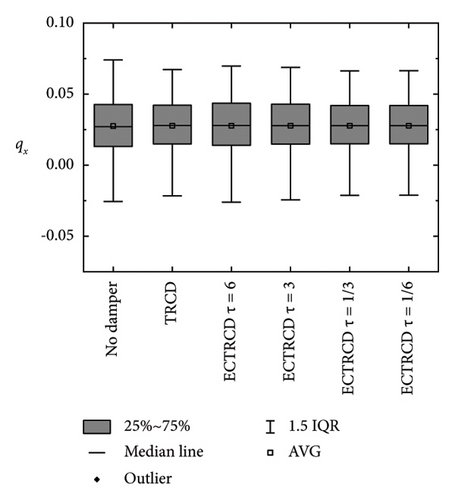
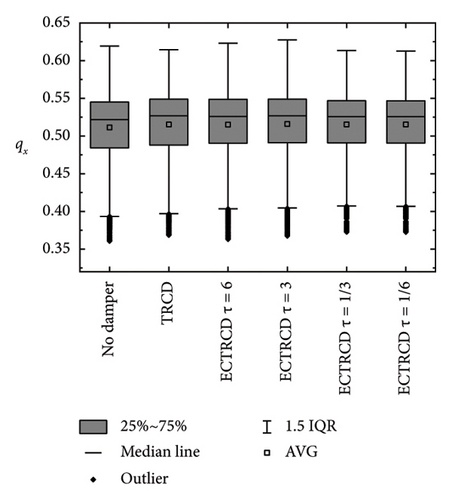
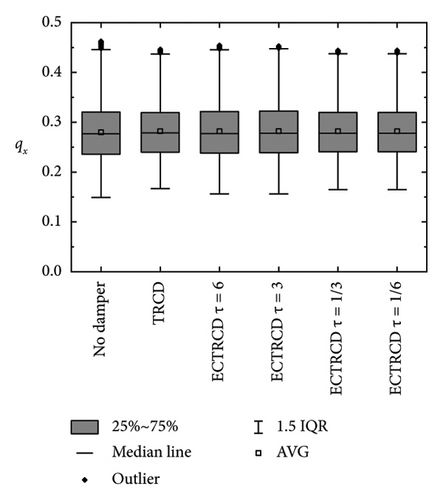
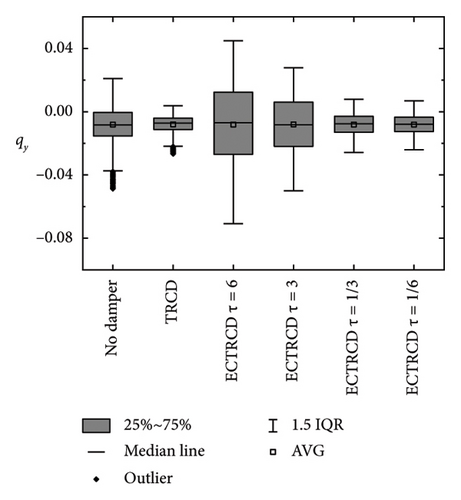
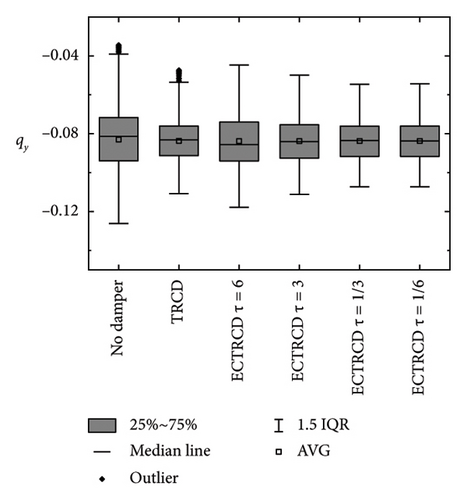
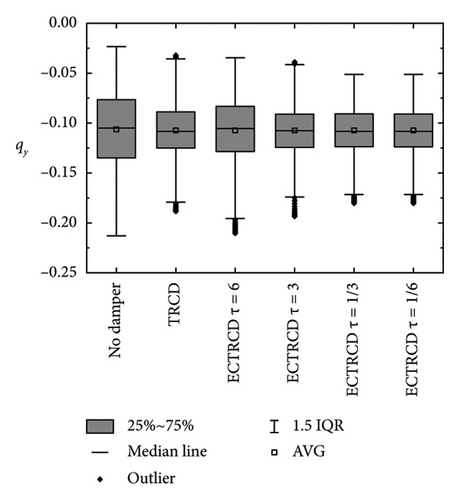
Box plots illustrating the displacement at the tower top in the fore–aft and side-to-side directions are presented in Figures 24 and 25, respectively. In the fore–aft direction, the interquartile range (IQR) is notably narrower following the implementation of the damper, demonstrating its effectiveness, particularly under high wind speed conditions. The performance of the TRCD and the ECTRCD with a radius ratio of 1/6 is observed to be comparable in this direction. In contrast, in the side-to-side direction, the ECTRCD with a radius ratio of 1/6 exhibits superior performance, as indicated by a significantly narrower IQR compared to the TRCD. These findings suggest that the ECTRCD outperforms the TRCD in controlling vibrations in the side-to-side direction, particularly under high wind speeds.
5. Concluding Remarks and Future Works
- 1.
The damping performance of the ECTRCD is influenced by the radius ratio, mass ratio, frequency ratio and damping ratio. The optimal frequency ratio is observed between 0.9 and 1, with the damping ratio around 0.05. As this radius ratio τ increases, the damping performance deteriorates due to the increased moment of inertia of the rolling cylinder and the reduced radius of the guide track arc. When the radius ratio changes from 6 to 1/6, the optimal damping performance improves from 5.3% to 17.7%, an enhancement by a factor of 3.34.
- 2.
The reduction ratio of the EFL is 16.7% using the TRCD with the optimised parameters (a mass ratio of 1.2%, a frequency ratio of 0.934 and a damping ratio of 0.056). This value can be improved to be 17.7% by the ECTRCD with the optimal parameters (a radius ratio of 1/6, a mass ratio of 1.2%, a frequency ratio of 0.943 and a damping ratio of 0.059). Compared with the TRCD, the EFL is further reduced by 1%.
- 3.
The ECTRCD, with optimised parameters, significantly affects the aerodynamic load and displacement of the wind turbine in the side-to-side direction, altering both the vibration amplitude and frequency, thus enhancing the vibration characteristics of the wind turbine. Conversely, the impact of the damper on the load or displacement in the fore–aft direction is less pronounced, being substantially influenced by the aerodynamic damping of the wind field and the structural damping of the wind turbine.
This study focuses exclusively on linear damping. However, in practical applications, nonlinear friction damping in the TRCD and nonlinear eddy current damping in the ECTRCD are inherently present. Future investigations should account for these nonlinear damping forces to enhance the model’s realism and applicability.
Conflicts of Interest
The authors declare no conflicts of interest.
Author Contributions
Zhenqing Liu: supervision, project administration, methodology and conceptualisation. Chao Wang: investigation, software, formal analysis and visualisation. Dongqin Zhang: writing – original draft preparation, writing – review and editing, and visualisation. All authors agree to be accountable for the content and conclusions of the article.
Funding
In this paper, the authors did not receive funding from any institution or company.
Open Research
Data Availability Statement
The data that support the findings of this study are available from the corresponding author upon reasonable request.


