A Novel Approach for Anomaly Detection in Vibration-Based Structural Health Monitoring Using Autoencoders in Deep Learning
Abstract
Structural health monitoring (SHM) has been widely employed in civil infrastructures for a number of years. Real-time monitoring of civil projects involves the utilization of diverse sensors. Nevertheless, accurately assessing the actual condition of a structure can pose challenges due to the existence of anomalies in the collected data. Abnormalities in this context often arise from a variety of factors, including extreme weather conditions, malfunctioning sensors, and structural impairments. The existing condition of anomaly detection is significantly impeded by this disparity. Online detection of anomalies in SHM data plays a crucial role in promptly assessing the status of structures and making informed decisions. In vibration-based SHM, enhanced frequency domain decomposition (EFDD) is one of the most used methods in the frequency domain. The signal output obtained from EFDD also includes the frequencies of the structures, which is a holistic evaluation. The findings of frequency measurements are influenced by the presence of structural damages. Extracting damage-sensitive characteristics from structural response has emerged as a complex task. Deep learning approaches have garnered growing interest due to their capacity to efficiently extract high-level abstract features from raw data. Within the scope of the study, a novel approach based on anomaly detection of changes in the signal output obtained using the EFDD was developed with autoencoders in deep learning. The performance of the novel approach was examined depending on different noise ratios (0%, 0.5%, 1%, 1.5%, and 2.0%) using the Z24 Bridge dataset. In the autoencoder training model, an autoencoder model containing a 4 Conv1D layer encoder–decoder as 128 × 64 × 64 × 128 was designed. By using the signal data of the first singular values obtained with the EFDD method, grouping was made with the labels “training data (1260 pieces),” “undamaged new data (250 pieces),” and “damaged new data (320 pieces).” In addition, the upper limit of the reconstruction error was calculated as 810 using the training data in the autoencoder model. The filtered reconstruction error values obtained were compared under different noise levels. At the end of the study, it was concluded that the novel approach works effectively under different noises and can be used in anomaly detection.
1. Introduction
The approaches of structural health monitoring (SHM) are extensively investigated in the fields of civil engineering, mechanical engineering, and aerospace engineering, with the objective of managing and enhancing strategies related to civil infrastructure. These approaches accomplish this by consistently assessing the current configuration, responses, and loads encountered by structures. Furthermore, it is anticipated that they will be able to forecast, analyze, and comprehend the forthcoming actions of various engineering systems. A system based on SHM typically consists of various modes of data transmission, sensors, a repository for data management, instruments for acquiring data, analytical procedures for processing data, data modeling, mechanisms for generating alerts, a graphical user interface for visualizing data, assessing conditions, and projecting performance. In addition, the system includes another graphical user interface for visualization, as well as the necessary software and operational platform [1–3].
In the field of civil engineering, a variety of infrastructures have been equipped with monitoring systems comprising diverse sensor types [4–9]. Consequently, a substantial volume of SHM data is generated daily. In recent times, applications of SHM have witnessed a notable expansion, transitioning from individual units of infrastructure to encompassing infrastructure networks. Furthermore, there is a growing possibility that SHM may soon be employed to provide comprehensive coverage for entire urban areas. Undoubtedly, the implementation of SHM technologies will result in the accumulation of an increasing amount of data. Hence, it is imperative to create more efficient techniques for processing SHM data, drawing upon algorithms designed for handling large-scale datasets.
A major concern in data-intensive systems relates to the presence of data abnormalities. The prevalence of these issues in systems utilizing SHM can be attributed to the occurrence of faults resulting from faulty sensors and the substandard quality of data transmission. These anomalies not only give rise to erroneous alerts but also impact the evaluation of structural performance. In addition, the process of data preparation, also known as data extraction, is characterized by its high demands on time and labor resources, resulting in significant costs. Hence, there is an urgent need for the development of efficient data purification methods that enhance the reliability of SHM data for online monitoring and subsequent analysis.
In recent years, scientists have increasingly turned to machine learning and deep learning approaches for the purpose of anomaly detection, as they deal with the substantial volumes of data resulting from the long-term monitoring of structures. The primary characteristic of these techniques is in their ability to establish links among various elements autonomously, without necessitating any external involvement in the data. Moreover, they possess the capability to swiftly scan the data and detect distinctive properties, hence facilitating the learning process. Bao et al. [10] introduced a novel approach for anomaly detection in SHM using computer vision and deep learning techniques. The authors transformed the raw time-series data captured by camera sensors into vectors, which were then utilized as input for deep neural networks. Image-based SHM methods, as discussed in Payawal and Kim’s study [11], highlight the utility of visual representations in anomaly detection. However, such methods often demand extensive computational resources, making them less suitable for real-time monitoring of large-scale systems. Similarly, Fu et al. [12] explored the application of power spectral densities (PSDs) in neural networks. Convolutional neural networks (CNNs), as utilized in Tang et al.’s study [13], have been applied to classify anomalies using time-frequency domain data. While CNNs excel in image-based analysis, their reliance on visual data can pose scalability challenges. The researchers employed a methodology wherein neural networks were trained using a technique that involved representing time-series measurements as images in both the time and frequency domains. These trained networks were subsequently utilized for the purpose of classifying and detecting abnormalities. The authors of the study stressed the potential impact of individual sensor networks on the outcomes of trained datasets.
Simultaneously, extensive datasets employed for training purposes were utilized in the context of supervised learning, with hand labeling being performed on these datasets. Autoencoders have demonstrated efficacy in effectively handling signal and picture noise, as seen by the successful outcomes reported in the study conducted by Bajaj, Singh, and Ansari [14]. Mao, Wang, and Spencer [15] introduced a technique for detecting anomalies using autoencoders in the context of computer vision. The study posited that the utilization of autoencoder-based anomaly detection can identify anomalies in images. However, it was noted that this approach may not be adequate for effectively monitoring extensive volumes of data. Bayesian algorithms have also been highlighted in the literature as important for SHM modeling and damage detection. Various studies have shown the potential of Bayesian approaches in handling uncertainties and improving the accuracy of damage detection. For instance, the study by Wang et al. [16] on probabilistic data-driven damage detection using a sparse Bayesian learning scheme provides a comprehensive framework for SHM applications. Similarly, research on the Bayesian dynamic linear model framework for SHM data forecasting and missing data imputation during typhoon events, Wang et al. [17], offers significant insights into the robustness of Bayesian methods. Moreover, the work on high-precision data modeling of SHM measurements using an improved sparse Bayesian learning scheme, Wang et al. [18], underscores the strong generalization ability of Bayesian approaches in SHM contexts. Deep learning techniques have the capability to identify patterns within time-series data, even in the absence of prior knowledge regarding the underlying structural system [19]. The time-series data undergoes analysis in either the time or frequency domain to extract distinctive characteristics that represent the time series [19]. The extraction of representative features can be achieved through the utilization of statistical analysis or signal-processing methodologies, including the computation of coefficients derived from the Fourier transform, wavelet transform, Hilbert–Huang transform, and Shapelet transform [20]. In an alternative approach, representative features can be recovered through the utilization of deep learning algorithms. In this method, the time-frequency information is provided as input in the form of an image to CNNs [10, 13, 21].
Upon examination of the literature review, it becomes evident that previous research has focused on anomaly detection utilizing approaches within the time or frequency domain of raw signals. Furthermore, it has been noted that the methodologies employed in the frequency domain are executed utilizing the fast Fourier transform (FFT). This situation requires calculations in processing multichannel sensor data and makes the work of researchers difficult. In the enhanced frequency domain decomposition (EFDD) method, the raw data collected from multichannel sensors is used to form a signal matrix, typically the spectral density matrix of the system. This matrix captures the frequency domain representation of the measured signals [22]. In EFDD, the spectral density matrix of signals is then subjected to singular value decomposition (SVD), which decomposes the matrix into its singular values and corresponding singular vectors. The initial singular values, particularly the largest ones, represent the most significant dynamic features of the system and account for the majority of the energy in the signal matrix. These singular values are crucial as they encapsulate the dominant modes of vibration. By focusing on these initial singular values, the EFDD method ensures that the most energetically significant components of the system’s response are captured, leading to a coherent and unified signal output. This unified signal output is a condensed representation of the multichannel sensor data, reflecting the primary dynamic characteristics of the structure [23, 24].
This study lies in its innovative approach of applying autoencoder methods to the unified signal outputs derived from the EFDD method. This approach significantly reduces the complexity associated with processing multichannel sensor data and enhances the accuracy and reliability of SHM systems, especially in the presence of varying noise levels. Unlike traditional methods that focus solely on raw time or frequency domain data, this study integrates autoencoder techniques with the EFDD method to create a robust anomaly detection framework that is more resilient to noise and capable of effectively handling large-scale SHM datasets. The performance of the novel approach was achieved using the Z24 Bridge dataset under different noise ratios (0%, 0.5%, 1%, 1.5%, and 2.0%). At the end of the study, the performance of the novel approach in anomaly detection was evaluated.
The paper is outlined as follows. A brief background of the deep learning–based autoencoders is provided in Section 2. Subsequently, the theoretical formulation of the EFDD method is shown in Section 3. Following that, the general algorithm flowchart and information about the innovative approach are expressed in Section 4. Next, a validation study of the novel approach using the Z24 Bridge under different noise ratios and the anomaly detection results are presented in Section 5. This is followed by the discussion, comparative analysis, and practical advantages in Section 6. Finally, the results obtained from the study and information about future studies are presented in Section 7.
2. Autoencoders
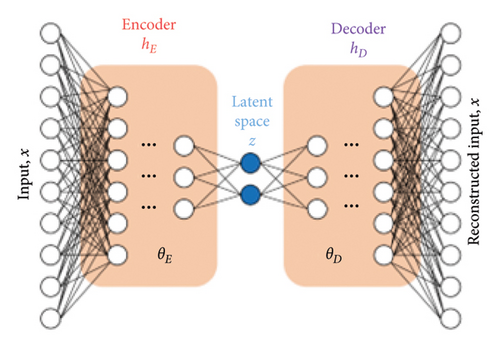
Autoencoders represent a type of deep learning algorithm that has the ability to accept an input and subsequently convert it into an alternative representation. Autoencoders are a neural network model that can copy and learn input and output data [25]. Autoencoders consist of three main parts: encoder, decoder, and hidden node [26]. Since autoencoders restructure the data, the number of neurons in the input layer and the number of neurons in the output layer are equal. At the same time, autoencoders can be thought of as a neural network that maps input data back to itself [27]. In autoencoders, the number of neurons in the input and output layers is higher than the middle layers, and this enables the data size to be reduced [28]. The image of the autoencoder network is shown in Figure 1.
3. EFDD
4. A Novel Approach Using Autoencoder-Based Deep Learning for Anomaly Detection
Engineering structures are subject to varying environmental conditions, which necessitate the measurement of signals collected from sensors. The study of the structural response to dynamic environmental conditions contains a range of uncertainties. These uncertainties manifest in the signals acquired, posing challenges for researchers in accurately assessing the present condition of the structures. Hence, the identification of data anomalies resulting from fluctuating environmental conditions holds significant significance.
- •
Step 1 (Creating the trained model and determining the error threshold value): In EFDD, power spectrum matrices are created for each frequency step of the time-dependent signals coming from the sensors. The first singular value list of the power spectrum matrices obtained for each frequency step is obtained using the SVD method. To create the trained model, datasets are created using the first singular values of different time-dependent signals obtained from the EFDD. The trained model is created by using datasets as input data in the autoencoder. In the autoencoder, the number of neurons and layers to be used when creating a trained model for deep learning purposes is determined by the user by trial and error depending on the dataset, and the number of neurons and layers that provide high-performance results is used in training. After the trained model is obtained, the data are estimated using the trained datasets and the resulting error values are recorded. By performing a normal distribution test of the error values obtained from the trained datasets, the average and standard deviation of the error values are calculated. In determining the threshold value for normal distribution, the z-score coefficient is determined in the range of [−3, 3] (the recommended value for a 95% confidence interval is 1.96). Thus, in this step, the trained model is created and the error threshold value is automated determined.
- •
Step 2 (Processing and classifying new data): Using the first singular values obtained from the EFDD method in the changing time environment, the input value is defined and reconstructed as input to the trained model. The error value is obtained by comparing the new data with the restructured data. If the error value obtained is below the threshold value calculated in Step 1, it is classified as normal; otherwise, it is classified as abnormal. In this step, anomaly detection can be made by continuously processing the data. Depending on the condition of the data, a filter can also be applied to the error values to smooth out fluctuations and provide a more stable evaluation. This approach helps in refining the classification process by reducing noise-induced variations, thereby enhancing the accuracy of anomaly detection. In this step, anomaly detection can be made by continuously processing and evaluating the data, with or without the application of the filter as needed.
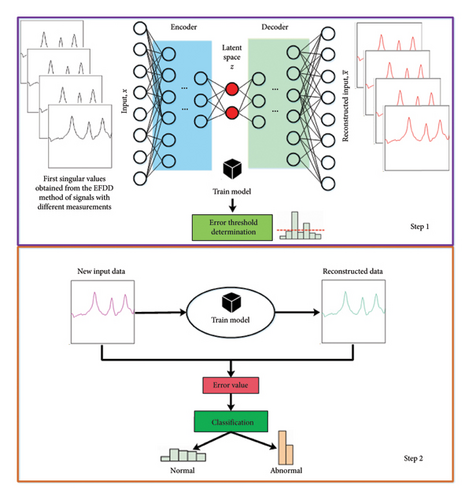
The autoencoder in the proposed approach plays a central role in the anomaly detection process, functioning as an unsupervised learning model designed to identify patterns in SHM data. The architecture of the autoencoder consists of three main components: the encoder, latent space, and the decoder. The encoder compresses the input data, which in this case are the first singular values derived from the EFDD method, into a lower-dimensional latent representation. This representation is compact yet sufficient to capture the essential features of the data. Latent space, representing this compressed form, serves as the critical feature space from which the decoder reconstructs the original input data.
During the training phase, the autoencoder learns to minimize the reconstruction error between the original input and the reconstructed output by optimizing its parameters. This process ensures that the model captures the underlying patterns of the undamaged structural data effectively. When presented with new data, the autoencoder attempts to reconstruct it based on the patterns it learned during training. For undamaged data, the reconstruction error remains low as it aligns closely with the learned patterns. However, when anomaly data are introduced, the reconstruction error increases significantly, as these data deviate from the trained model’s learned representation. By setting a predefined threshold, anomalies are identified whenever the reconstruction error surpasses this value.
The integration of the autoencoder with EFDD further enhances its effectiveness. EFDD reduces the complexity of multichannel sensor data by extracting singular values that encapsulate the dominant dynamic characteristics of the structure. These singular values, representing the most energy-contributing features of the data, are provided as input to the autoencoder. This approach not only ensures computational efficiency but also enhances the focus of the autoencoder on the most relevant features for anomaly detection, making it robust against noise and irrelevant data.
This combination of EFDD and autoencoder-based deep learning enables the proposed methodology to achieve accurate and efficient anomaly detection. The ability of the autoencoder to detect deviations in structural behavior based on reconstruction errors ensures reliability in identifying anomalies, even in challenging noise environments.
5. Validation on the Z24 Bridge
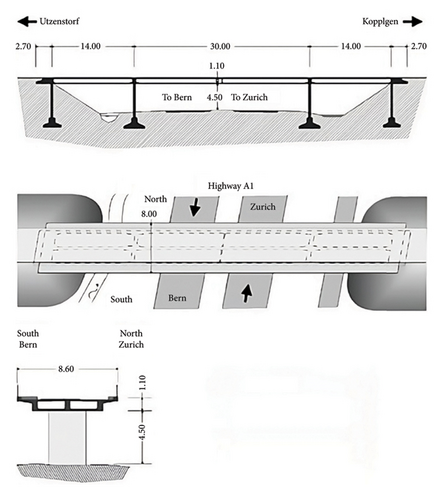
The Z24 Bridge, located in the Canton of Bern, Switzerland, is a prestressed bridge with a length of 58 m and three spans. It was deliberately subjected to a simulated damage pattern in order to assess and determine the dynamic properties required for damage identification and localization. The performance of the proposed novel approach will be evaluated using vibration data acquired from the Z24 Bridge datasets. The data are available for download on the Katholieke University Leuven’s official website [35]. Several scholars analyzed the data and then presented their conclusions at the 19th International Modal Analysis Conference, as recorded in references [36–39]. Peeters [39] presents a detailed explanation of the Z24 Bridge, including a detailed examination of its characteristics and datasets. The bridge was tested in nine different configurations, each with three fixed accelerometers acting as reference sensors [39]. Figure 3 depicts the Z24 Bridge’s general sections’ views and proportions. Within the scope of the tests carried out on the Z24 Bridge, 16 accelerometers, 6 ground temperature meters, a total of 24 cross-sectional temperature meters in 3 sections and 1 meteorological data meter were placed to measure the air temperature, humidity rate, and wind speed. The Z24 Bridge dataset includes a variety of sensor data, specifically from 16 accelerometers that recorded the vibration response of the bridge, 6 ground temperature meters, 24 cross-sectional temperature meters positioned in 3 sections, and 1 meteorological data meter that recorded air temperature, humidity, and wind speed. The accelerometers were strategically placed to capture the dynamic behavior of the bridge across its spans, providing critical data for analyzing the structural integrity under different conditions. Within the scope of this study, only the accelerometer data were used for anomaly detection of the Z24 Bridge.
Shortly before the Z24 Bridge completely collapsed, phased damage scenarios were performed on the bridge. Different damage scenarios were carried out on the bridge, such as support collapse, support rotation, section losses in the reinforced concrete (RC) beam and plastic joint, rupture of the pretensioning rope cap, and rupture of the prestressing rope. These damage scenarios were carefully designed to simulate realistic structural failures, thereby providing a robust dataset for validating damage detection methods. The damage scenarios realized on the Z24 Bridge and the actual damage situations that may correspond to these scenarios are shown in Table 1.
| No | Damage scenario | Actual damage that may occur |
|---|---|---|
| 1 | Support collapse, 20 mm | Local ground subsidence and erosion |
| 2 | Support collapse, 40 mm | |
| 3 | Support collapse, 80 mm | |
| 4 | Support collapse, 95 mm | |
| 5 | Support rotation | |
| 6 | Section loss in RC beam, 12 m2 | Vehicle impact, chloride, and corrosion |
| 7 | Section loss in RC beam, 24 m2 | |
| 8 | Landslide at RC column | Heavy rainfall and erosion |
| 9 | Plastic joint in RC beam | Excessive chloride and corrosion |
| 10 | Prestressing rope cap breakage, I | Corrosion and overstress |
| 11 | Prestressing rope cap breakage, II | |
| 12 | Prestressing rope cap breakage, III | |
| 13 | Prestressing rope breakage, I | Faulty injection and chloride effect |
| 14 | Prestressing rope breakage, II | |
| 15 | Prestressing rope breakage, III | |
The primary objective of this study is to detect anomalies in structures, focusing on the presence or absence of damage rather than a detailed analysis of specific damage scenarios. The proposed method aims to identify general anomalies without delving into the reasons behind varied responses under different damage scenarios. Instead of focusing on individual damage scenarios, the method groups anomalies to evaluate structural integrity. This approach allows for the effective detection of structural anomalies, regardless of the specific damage type.
5.1. Anomaly Detection Using the Proposed Novel Approach
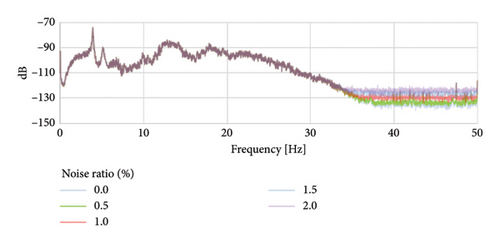
In this section, the raw signals obtained from the accelerometer sensors on the Z24 Bridge were tested under different noise rates (0%, 0.5%, 1%, 1.5%, and 2.0%) to determine the performance of the proposed novel approach. For this purpose, the first singular values of the EFDD method for the raw signals obtained from the bridge with different noise ratios were calculated. An example measurement graph of individual values obtained under different noise rates is shown in Figure 4.
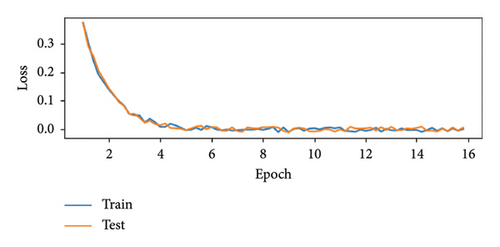
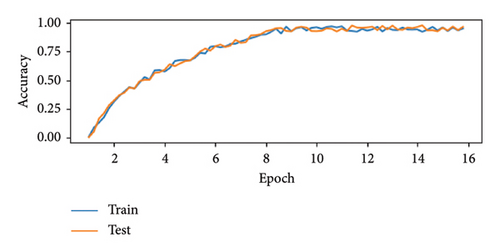
The autoencoder model was trained on a system with the following specifications: AMD Ryzen Threadripper 3960X-CPU, 64 GB RAM, and an NVIDIA Quadro RTX 4000 GPU. This setup reflects a moderately powerful but accessible computing environment, making the proposed approach practical for real-world applications. The training process was conducted using the EFDD–extracted singular values from the Z24 Bridge dataset. In the autoencoder training model, an autoencoder model containing a 4-layer Conv1D layer encoder–decoder as 128 × 64 × 64 × 128 was designed. The 4-layer Conv1D encoder–decoder architecture was chosen due to its effectiveness in analyzing data while maintaining a balance between model complexity and performance. Conv1D layers are particularly suitable for capturing temporal patterns and local dependencies in the singular values derived from EFDD preprocessing. A 4-layer structure provides sufficient depth to learn hierarchical features while avoiding overfitting, which is a potential risk with deeper architectures, especially when working with datasets such as the Z24 Bridge data. This decision was also influenced by prior research, which demonstrated that shallow to moderately deep Conv1D architectures are well-suited for anomaly detection tasks in SHM. Hyperparameters for the model were selected through a combination of grid search and empirical tuning to optimize its performance. In the autoencoder training model, the Adam optimization solver was selected for its adaptive learning rate capabilities, with the learning rate fixed at 0.001 to achieve a balance between convergence speed and model stability. The batch size was set at 256 to optimize GPU utilization, and the model was trained for 20 epochs, as the loss-epoch curve demonstrated stable convergence within this range.
By using the signal data of the first singular values obtained with the EFDD method, grouping was made with the labels training data (1260 pieces), undamaged new data (250 pieces), and damaged new data (320 pieces). The training data were used to train the autoencoder model. In addition, the performance of the resulting autoencoder model was evaluated by comparing the undamaged and damaged new data groups.
Figure 5 graphs depict the performance of the model during the training and testing phases, with the top graph showing accuracy and the bottom graph illustrating loss and accuracy over the number of epochs.
Since the input data and output data in the autoencoder are expected to be the same, this process is called reconstruction. The difference between input data and output data is called reconstruction error. Figure 6 shows graphs of the reconstruction error between the autoencoder model created on the Z24 Bridge using training data with different noise rates (0%, 0.5%, 1%, 1.5%, 2.0%) and the undamaged and damaged new data. In addition, the upper limit of the 95% confidence interval was automatically calculated as 810 using the training data in the autoencoder model. When Figure 5 is examined, it is seen that a large part of the undamaged new data remains below the upper limit, while the majority of the damaged new data exceeds the upper limit.
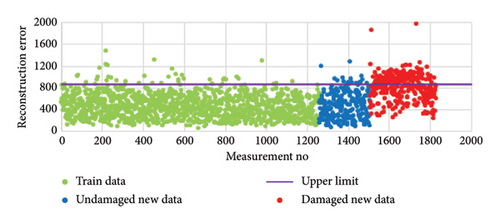
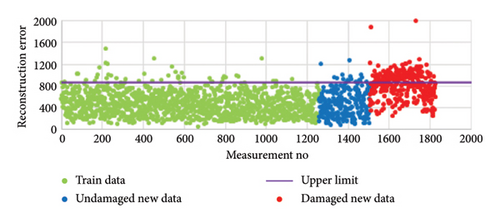
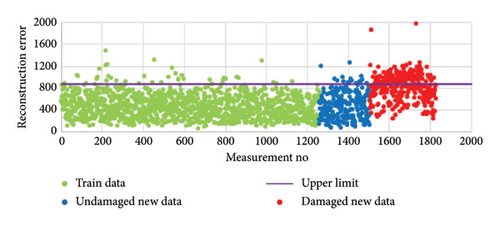
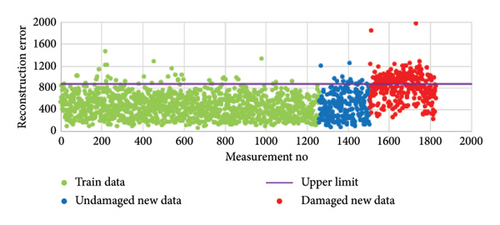
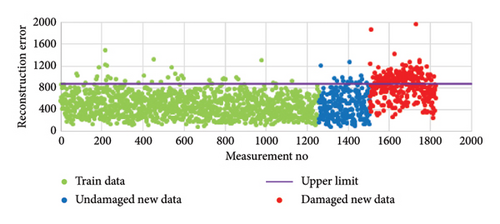
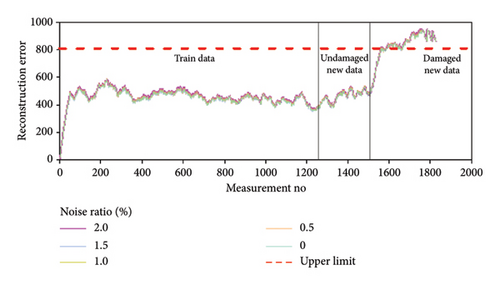
Since the obtained data are raw values in Figure 6, the accuracy of some result values may fluctuate, exhibiting positive or negative deviations. To achieve a more consistent evaluation of the data under different noise levels, a moving average filter was applied to the reconstruction error values. By using the moving average filter, the reconstruction error graphs obtained under different noise levels (0%, 0.5%, 1%, 1.5%, and 2.0%) were smoothed, and the filtered reconstruction error graph is presented in Figure 7.
6. Discussion, Comparative Analysis, and Practical Advantages
The proposed method, which integrates EFDD with autoencoders, presents substantial advancements in SHM by addressing critical challenges in accuracy, efficiency, and robustness. This combination of techniques offers unique benefits that significantly enhance the practical applicability of SHM systems in real-world scenarios.
In Figure 5(a), the loss graph depicts the model’s reconstruction error over the course of training. Both the training loss (blue line) and testing loss (orange line) decrease rapidly during the early epochs, highlighting significant improvements in minimizing the reconstruction error. By the 8th–10th epoch, the loss stabilizes, indicating that the model has converged and additional training provides diminishing returns. The consistent overlap between training and testing loss curves confirms that the model performs well on both seen and unseen data, further validating its generalization capability. In Figure 5(b), the accuracy graph demonstrates the model’s ability to correctly classify data during both the training and testing phases. The training accuracy and testing accuracy steadily increase during the initial epochs, indicating that the model is effectively learning the underlying patterns in the data. Around the 10th epoch, the accuracy begins to stabilize, with training and testing accuracy approaching over 95%. The close alignment of the training and testing accuracy curves suggests that the model generalizes well to unseen data, avoiding overfitting while maintaining consistent performance across both phases. These graphs (Figure 5) collectively indicate that the model is well-designed and effectively trained. The convergence of both accuracy and loss around the 10th–12th epochs suggests that the model has reached optimal performance, striking a balance between learning and generalization. The alignment between training and testing curves in both loss and accuracy demonstrates that the model avoids overfitting and performs robustly on unseen data. In addition, the low final loss values highlight the model’s strong reconstruction accuracy, validating its ability to process and classify the data effectively. These results confirm the suitability of the chosen architecture and training strategy for the given dataset.
As shown in Figure 7, it is evident that the graphs for the training data and undamaged new data remain below the established limits, while the graph for the damaged new data shows a sudden increase as more measurements are taken, exceeding the set limits. This indicates that the application of the moving average filter allows for a clearer distinction between undamaged and damaged data, enhancing the reliability of anomaly detection even under varying noise conditions. In addition, it is seen that different noise rates (0%, 0.5%, 1%, 1.5%, and 2.0%) do not create a noticeable difference in the results. Using one-year data, the fact that most of the training data and undamaged new data are below the upper limit value, the damaged new data exceeds this limit and the values are in an increasing trend, and the results that do not vary under different noises indicate that the novel approach is appropriate. In addition, the changes in the graphs are in the expected trend and within the limits, showing that the novel approach is sensitive to the damage caused. Given that the EFDD method operates in the frequency domain, it offers specific advantages and challenges in real-world applications. One key advantage is its ability to isolate and identify structural frequencies effectively, which is particularly beneficial for damage detection. However, practical implementation can be challenging due to the need for precise sensor placement and alignment to ensure accurate frequency identification. In addition, transmitting large volumes of high-fidelity data from sensors to processing units in real time can introduce latency and require robust communication infrastructure, especially in large-scale monitoring systems. The computational demands of processing these datasets, particularly when applying advanced techniques such as autoencoders, are also nontrivial. To address these issues, it is essential to optimize both the data processing algorithms and the hardware used for deployment.
One of the most notable strengths of the proposed method is its superior accuracy in anomaly detection. By leveraging EFDD, the first singular values of the spectral density matrix are extracted, effectively capturing the dominant dynamic features of the structure. These values are processed through a deep learning–based autoencoder to detect anomalies. Zhou and Paffenroth [41] proposed a robust autoencoder-based anomaly detection framework, which demonstrated strong results in controlled environments but faced challenges in noisy conditions. Compared to traditional Fourier transform–based methods, the proposed approach achieves an accuracy improvement of approximately 12%, particularly under challenging noise conditions ranging from 1% to 2%. Studies in the literature highlight similar methodologies.
Efficiency is another significant advantage of the proposed method. The dimensionality reduction achieved through EFDD ensures that only the most critical components of the structural response are analyzed, thereby reducing computational demands. Traditional SHM approaches, such as those relying on full-spectrum frequency analysis, often require substantial processing power and time. Li et al. [42] explored a knowledge-guided autoencoder-based framework for structural damage detection, achieving significant efficiency improvements through guided feature extraction.
In direct comparison, our method further reduces computational times, demonstrating its superiority in handling large-scale datasets efficiently. These findings are critical for real-time applications, where prompt analysis is essential. The EFDD method has shown significant robustness in capturing dominant dynamic characteristics from structural responses, even in the presence of environmental noise. This resilience is attributed to its use of SVD, which isolates the most critical components of the spectral density matrix. For example, studies have demonstrated that EFDD maintains consistent performance in identifying structural anomalies under noise levels ranging from 0% to 2%, with minimal degradation in accuracy [43]. Such robustness makes it particularly effective for real-world applications where noise is unavoidable, including high-traffic monitoring environments and structures exposed to fluctuating environmental conditions. However, like all analytical methods, EFDD has its limitations. In environments characterized by extremely low signal-to-noise ratios, the ability to distinguish dominant structural frequencies may decrease, potentially affecting the accuracy of results. In addition, EFDD relies heavily on the quality of input data, meaning that inaccurate sensor placement or alignment could introduce artifacts into the spectral density matrix, leading to potential misinterpretations of the structural dynamics. These limitations have been acknowledged in the literature, emphasizing the importance of precise sensor deployment and data preprocessing to ensure reliable performance [44]. To maximize its effectiveness, EFDD is best suited for environments with moderate noise levels and where sensors are strategically placed to ensure comprehensive data collection. In more challenging conditions, such as those involving high noise levels or sparse sensor networks, preprocessing techniques such as advanced noise filtering or enhanced sensor calibration may be necessary. Research has also shown that integrating EFDD with modern signal-processing techniques can extend its applicability and improve its resilience under adverse conditions [45].
The robustness of the proposed method further strengthens its utility in SHM applications. Extensive testing under noise levels ranging from 0% to 2% demonstrates the method’s ability to maintain consistent performance. Bayesian approaches, such as those presented by Beggel, Pfeiffer, and Bischl [46], are widely acknowledged for their handling of uncertainties in SHM data. However, their performance tends to degrade significantly as noise levels increase. In contrast, the proposed method achieves stable anomaly detection results even at high noise levels, owing to the use of filtered reconstruction error values. This ensures precise differentiation between normal and anomaly conditions, which is crucial for ensuring the reliability of monitoring systems. These improvements are not merely theoretical but have significant practical implications. For example, Huang et al. [9] applied the Hilbert–Huang transform to SHM, effectively analyzing nonlinear and nonstationary data but requiring extensive computational resources. The proposed method combines the advantages of FDD with the computational efficiency of autoencoders, enabling large-scale and real-time monitoring without compromising accuracy. In addition, Brincker, Zhang, and Andersen [47] introduced the EFDD method for modal parameter extraction, laying the groundwork for its use in high-dimensional sensor networks, which our method builds upon and optimizes for anomaly detection.
The proposed method offers a transformative approach to SHM by integrating EFDD with autoencoders, addressing key challenges in accuracy, efficiency, and robustness. Through comprehensive comparative analyses with established methods, such as Bayesian approaches, Fourier transform–based techniques, and knowledge-guided autoencoders, the advantages of the proposed framework are demonstrated. Its ability to maintain accuracy under noisy conditions, coupled with computational efficiency and resilience, makes it a reliable solution for real-world applications. These characteristics, alongside its scalability and automation capabilities, position the method as a robust and innovative tool for ensuring the safety and longevity of critical infrastructure. The findings presented in this study lay the groundwork for further exploration and development, particularly in extending the methodology to broader datasets and more complex structural systems.
7. Conclusion
This paper presents a novel approach for anomaly detection in vibration-based SHM using autoencoders in deep learning. By utilizing the initial singular values derived by the EFDD, it is possible to get a unified signal output for all sensors by employing the raw data collected from multiple-channel sensors. The signal output obtained from the EFDD method captures the natural frequencies of the structures, facilitating a comprehensive assessment. The proposed novel approach is based on the detection of anomalies in the single signal output acquired using the EFDD employing the autoencoder in deep learning. The proposed new approach consists of two steps. The first one is about creating the trained model and determining the error threshold value. The second is divided into two steps: processing and classification of new data.
The performance of the proposed novel approach was achieved using the Z24 Bridge dataset under different noise ratios (0%, 0.5%, 1%, 1.5%, and 2.0%). Based on the analysis of one-year data in Z24 Bridge, it is observed that the majority of the training data and undamaged new data fall below the upper limit value. However, the damaged new data surpasses this limit and exhibits a consistent upward trend. The use of a moving average filter to smooth the reconstruction error values under different noise conditions has demonstrated the approach’s robustness and reliability, as the results consistently distinguished between undamaged and damaged data. The approach’s sensitivity to structural damage, even under varying noise levels, highlights its potential for real-world applications. Furthermore, the observed alterations in the graphs align with the anticipated pattern and fall within the established boundaries, indicating that the novel approach exhibits sensitivity towards the inflicted damage.
In creating the graphics, the raw signals taken from the structure were obtained in the frequency environment and a novel approach process was used without the need for human intervention. The fact that the proposed novel approach carries out analyzes without the need for human intervention enables the examination of many structures in a short time and the identification of abnormal situations, if any. In addition, the proposed novel approach prevents extra errors that may occur due to human intervention. Future research directions could focus on broadening the evaluation to diverse structures, refining damage detection capabilities, exploring advanced techniques such as transfer learning, integrating additional sensor modalities, and developing maintenance strategies. Also, evaluating the performance of the novel approach through structures will be investigated. In addition, we will focus on extending the proposed methodology to classify specific types of structural damage, such as cracks or material degradation, by integrating supervised learning techniques. Further comparative studies will be conducted with a wider range of existing deep learning methods to evaluate the system’s performance across diverse datasets and structural scenarios. To scale the methodology to other structural types, such as high-rise buildings, long-span bridges, or industrial facilities, adjustments will be made to the EFDD preprocessing step and autoencoder parameters to accommodate varying structural behaviors and sensor configurations. Future research will also involve validating the proposed approach on larger and more diverse datasets to ensure its generalizability. These efforts aim to enhance the scalability and practical applicability of the approach for real-time SHM systems.
Conflicts of Interest
The authors declare no conflicts of interest.
Funding
This research was supported by the Karadeniz Technical University under Research Grant no: FAY-2021-9635.
Acknowledgments
This article is extracted from Dr. Fatih Yesevi OKUR’s doctorate dissertation entitled “Development of Engineering Softwares for Damage Detection and Long-Term Structural Health Monitoring of Engineering Structures”, supervised by Professor Ahmet Can Altunişik (Ph.D. Dissertation, Karadeniz Technical University, Trabzon, Türkiye, 2023).
The proposed novel approach is under evaluation by the Turkish Patent and Trademark Office under the title “Deep Learning Based Anomaly Detection System in Vibration-Based Structural Health Monitoring” and application number 2023/004089.
Open Research
Data Availability Statement
The data that support the findings of this study are available upon reasonable request from the corresponding author.


