Optical Flow-Based Structural Anomaly Detection in Seismic Events From Video Data Combined With Computational Cost Reduction Through Deep Learning
Abstract
This study presents a novel approach for anomaly event detection in large-scale civil structures by integrating transfer learning (TL) techniques with extended node strength network analysis based on video data. By leveraging TL with BEiT + UPerNet pretrained models, the method identifies structural Region-of-Uninterest (RoU), such as windows and doors. Following this identification, the extended node strength network uses rich visual information from the video data, concentrating on structural components to detect disturbances in the nonlinearity vector field within these components. The proposed framework provides a comprehensive solution for anomaly detection, achieving high accuracy and reliability in identifying deviations from normal behavior. The approach was validated through two large-scale structural shaking table tests, which included both pronounced shear cracks and tiny cracks. The detection and quantitative analysis results demonstrated the effectiveness and robustness of the method in detecting varying degrees of anomalies in civil structural components. Additionally, the integration of TL techniques improved computational efficiency by approximately 10%, with a positive correlation observed between this efficiency gain and the proportion of structural RoUs in the video. This study advances anomaly detection in large-scale structures, offering a promising approach to enhancing safety and maintenance practices in critical infrastructure.
1. Introduction
Engineering structures often sustain damage throughout their service life, deteriorating over time due to various environmental and mechanical factors. Both immediate and prolonged damage contribute to the aging of structures and a subsequent reduction in their service life, highlighting the importance of the structural health monitoring (SHM) process. SHM is widely used for managing and maintaining civil infrastructure systems, involving the assessment of structural loads, responses, and real-time performance, as well as predicting the future behavior of different types of structures [1].
With the broad application of SHM systems in recent years, a large amount of data has been generated, leading to significant advancements in data anomaly detection. The emerging field of structural anomaly detection is gaining prominence due to its crucial role in ensuring the safety and reliability of various infrastructures, including buildings, bridges, and industrial machinery. It is essential to differentiate between techniques that assume stationarity in a structure’s dynamic behavior, which are effective for identifying slow-developing anomalies such as material aging and gradual foundation settlement [2]. In contrast, for structures experiencing rapid damage, such as from explosions, impacts, or earthquakes, alternative analysis techniques, like time-frequency analysis, are necessary. Bao et al. [3] used a deep neural network (DNN)–based methodology for high-accuracy autodetection of anomalies in SHM systems, though it only considered time-series data (acceleration). Meanwhile, Tang et al. [1] developed a dual-information convolutional neural network (CNN) that achieved higher accuracy in multiclass anomaly detection compared to the DNN approach. Structural anomalies, characterized by unexpected conditions or changes, must be addressed to prevent performance declines or catastrophic failures. Wang et al. [4] utilized multilevel data fusion and anomaly detection techniques to detect and locate damage, successfully identifying even a 1% reduction in local stiffness. However, these studies predominantly relied on time-series data, such as acceleration and displacement responses, which introduced challenges related to sensor dependency, optimal placement, and large-scale data processing.
In recent years, the traditional reliance on manual inspection and scheduled maintenance has evolved with the integration of advanced imaging technologies and machine learning (ML) [5]. Transfer learning (TL), an effective ML method, involves applying knowledge from one domain (source domain) to a new but related domain (target domain). This technique is particularly useful for acquiring large volumes of labeled data for specific tasks that are challenging or resource-intensive [6, 7]. Previous studies have focused on anomaly detection and damage condition assessment using TL, but these primarily addressed 2D time-history data and crack detection from static images [8–11]. Pan et al. [8] proposed a TL-based technique for detecting anomalies in SHM data, including acceleration, strain, displacement, humidity, and temperature measurements. TL reduces the need for extensive target bridge data by leveraging knowledge from related domains. Bao et al. [9] employed a deep TL network, SHMnet, pretrained for structural condition detection, using acceleration data as input. By utilizing models pretrained on extensive datasets, TL offers substantial computational and time efficiency, making it a compelling choice for structural anomaly detection. These advancements are crucial in SHM, where rapid and accurate anomaly detection is essential. Thus, TL has become a vital tool in streamlining the anomaly detection process, enhancing the computational efficiency and overall effectiveness of SHM systems.
Video data provide a rich source of spatial and temporal information, making them particularly well-suited for monitoring structural conditions. Techniques based on video data offer several advantages, including cost-effective and noncontact data acquisition, superior spatial resolution, and the capability to measure dynamics at multiple points [12]. By utilizing video-image-based sensing methods, structural motion signals can be extracted without physical sensors, allowing for a dense network of contactless sensors across the entire structure [13]. For example, Pan et al. [14] developed a deep learning–based YOLOv3-tiny-KLT algorithm that accurately measures structural motion while mitigating the effects of illumination changes and background noise. Oliveira et al. [15] used the open video platform YouTube to filter and analyze SHM data in response to seismic waves, providing insights into wave propagation and its effects on the built environment. Integrating computer vision (CV)–based structural displacement monitoring with traditional contact acceleration sensors can enhance accuracy and sampling rates for dynamic deformation estimation, providing high-frequency vibration information and improving displacement sampling rates for SHM applications [16]. Merainani et al. [13] utilized video image flows to extract motion signals, enabling dense sensor coverage and aiding in modal identification and uncertainty quantification. Additionally, satellite monitoring techniques offer the advantage of covering numerous structures quickly and at relatively low costs, providing historical information on structural behavior. However, recent studies have highlighted limitations when using satellite data for structures sensitive to temperature variations [17]. These structures can undergo deformations that challenge satellite readings, leading to information loss. As remote SHM techniques are less effective than on-site methods for detecting anomalies, it is crucial to develop techniques and protocols that integrate information from various methods.
The authors previously conducted research on anomaly event detection, focusing on nonlinear occurrences, and validated the efficiency of their proposed methods through a small-scale frame model shaking table test [18]. This method detects nonlinearity in structural vibrations using video data, with feature extraction performed via optical flow techniques. However, a significant challenge persists across the field: the high computational costs associated with the analysis process. Addressing this issue is crucial for advancing SHM technologies and methodologies.
Anomalous events within a structure often manifest as singularity motion. Analyzing these singularity motion responses, particularly by depicting boundaries informed by optical flow-derived motion responses, is an effective strategy for detecting anomalies and damage. In structural damage detection, engineers typically focus on identifying damage or anomalies in key structural components such as beams and girders, referred to as the “Region-of-Interest (RoI)” within video data. Conversely, building envelopes, including elements like doors and windows, are generally not the primary focus of these assessments and are thus categorized as the “Region-of-Uninterest (RoU)” [19]. Identifying the RoU before damage detection significantly enhances the efficiency of the process by reducing the number of pixel points that need to be analyzed. Furthermore, most existing research on damage identification primarily addresses experimental-scale models or specific regions (such as bolted joints), with fewer applications focused on full-scale structures [20–22]. This study utilized video data from the National Research Institute for Earthquake Science and Disaster Resilience (NIED) to facilitate the detection of structural anomalies during seismic events [23]. The institute’s website has published over 100 videos of shaking table tests on full-scale structures, including reinforced concrete (RC) buildings and bridge piers, wooden houses, steel buildings, and soil-pile foundations, captured from multiple perspectives [24].
This study introduces a novel method for detecting anomalies due to structural nonlinearity in video data, validated through a 3-D full-scale shaking table test conducted by NIED. The method involves extracting nonlinear disturbances from anomaly events in the velocity vector field estimated by optical flow, constructing an extended node strength network, and applying a morphological opening operation for feature extraction and enhancement. While this basic anomaly detection method was demonstrated in our previous study [18], this study presents two key advancements for applying the method to general video data. First, the developed algorithm, which was previously applied only to small-scale experimental structures, is now tested on large-scale engineering structures to assess its effectiveness in real-world scenarios. Second, to address the challenge of excessive computational time, we integrate a TL algorithm to initially identify and filter out the RoU, thereby enhancing identification efficiency.
The specific scientific contributions can be summarized in three key points: First, the developed extended node strength network algorithm was validated for identifying anomaly events (damage) in actual large-scale structures, including both pronounced and tiny cracks. Second, the concept of RoU in structural analysis was introduced, significantly enhancing overall computational efficiency by identifying the RoU in advance during the damage detection process. This approach not only streamlined the process but also broadened the applicability of RoU detection across various structural analysis scenarios. Finally, a comparison of computational efficiency before and after applying TL demonstrated the effectiveness of the proposed fusion method. The remainder of this paper is organized as follows: Section 2 presents the framework and formulations of the proposed algorithm. Section 3 describes the 3D large-scale shaking table tests, including concrete and wooden building tests, followed by the identification results of TL for structural RoU. It also compares visualization results before and after anomaly events (pronounced shear cracks and tiny cracks) to demonstrate the feasibility of the proposed method. Additionally, a morphological opening operation is introduced to enhance features and denoise visualization results. Computational efficiency, with and without TL, is also compared. Finally, conclusions are presented in Section 4.
2. Methodology
In this section, we introduce methods for identifying the structural RoU and detecting anomaly events due to structural nonlinearity using optical flow-based method from video data. The first subsection reviews the state-of-the-art studies using optical flow to structural response estimation in recent years. The second subsection summarizes the anomaly detection method developed by the authors [18], which employs an extended node strength network for more efficient detection of structural anomalies, including velocity vector estimation, feature extraction, and feature enhancement. Issues related to computational cost and the necessity for deep learning techniques are also discussed. The subsequent subsection explains the identification of the RoU for reducing computational costs. TL, utilizing BERT pretraining of image transformers (BEiT) and a Unified Perceptual Parsing Network (UPerNet), is employed for RoU identification due to its effectiveness with small datasets. The framework of the proposed method and its theoretical overview, including mathematical formulations, are presented in the following subsections.
2.1. Literature Review of State-of-the-Art Studies Using Optical Flow
Optical flow, an advanced video analysis technique, estimates real-world object motion between observers and scenes by analyzing the dense field corresponding to the interframe displacement of each pixel [25]. Motion estimation from video data is an active area of CV research. Early attempts at motion field estimation employed intensity-based optical flow techniques, such as the Lucas–Kanade (LK) [26] and Horn–Schunck (HS) [27] methods. Recently, structural displacement extraction using traditional optical flow algorithms has become common. For instance, Javh et al. [28] used a gradient-based optical flow approach for high-accuracy displacement estimation (smaller than a thousandth of a pixel), validated through experiments with a steel beam and a cymbal. Bhowmick et al. [29] applied the optical flow method to track pixel-level edge points of a structure and obtained the full-field mode shape of a cantilever beam using dynamic mode decomposition. Currently, state-of-the-art optical flow techniques are based on CNNs, with most top-performing methods incorporating deep learning architectures [30]. Modern approaches, such as FlowNet 2.0, use deeper architectures and advanced training techniques to enhance performance and accuracy in optical flow estimation [31]. Another significant advancement is the Recurrent All-Pairs Field Transform (RAFT) model, which employs recurrent units to iteratively refine optical flow estimates, achieving state-of-the-art results on various benchmarks [32]. Additionally, LiteFlowNet has been developed to create lightweight and efficient CNNs that maintain high performance while reducing computational complexity [33]. Lagemann et al. [34] demonstrated the effectiveness of recurrent deep learning models in particle image velocimetry applications and highlighted the adaptability of CNNs in different optical flow contexts. While the integration of deep learning with optical flow has advanced the field, it also introduces complexities, including the need for extensive model training and increased data requirements. Therefore, the decision to combine deep learning with optical flow should be based on the specific application and the required identification accuracy.
2.2. Framework of the Proposed Method
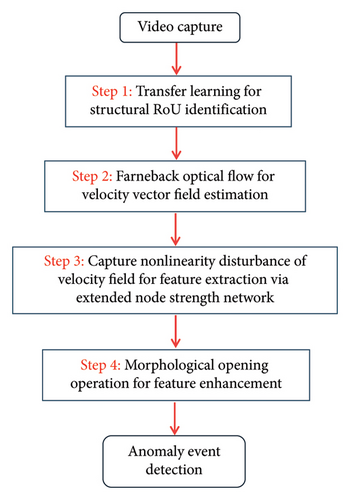
The proposed method for detecting structural anomaly events during earthquakes, relying solely on video data, integrates TL with an extended node strength network. Figure 1 illustrates the framework of this method and the flowchart detailing the subsequent steps. First, TL identifies the structural RoU, isolating frames that contain only the relevant structural component information for further analysis. Second, velocity field estimation is performed on these frames using the Farneback optical flow algorithm. Third, features of the anomalous events are extracted and visualized in different colors. The extended node strength network is constructed based on the captured motion information from all pixel points. Finally, the feature detection results are denoised and enhanced using a morphological opening operation.
2.3. TL for RoU Identification
This section details the segmentation of the structural RoU, such as doors and windows, using ML, as depicted in Step 1 of Figure 1. Recently, transformer-based models [35, 36] have gained attention for image recognition as alternatives to CNN [37]. Transformers excel at capturing long-distance dependencies, which partly accounts for their superior performance compared to CNN. However, transformers generally require large amounts of training data. TL addresses this issue by allowing models trained on extensive datasets to perform effectively on specific tasks with smaller datasets. Consequently, BEiT [36], a transformer-based model, was employed, leveraging TL to segment the RoU components. BEiT utilizes the BERT approach [38], a widely used transformer-based model in natural language processing, for image recognition. BEiT treats images as sequences of words and learns to extract features through a masked part-prediction task.
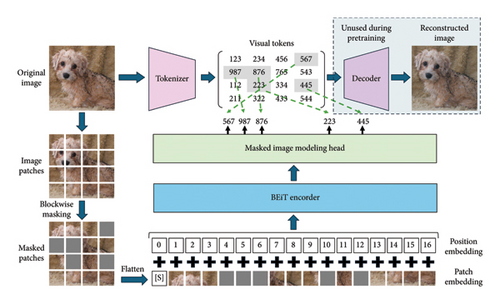
Additionally, the model predicts the information of the masked images based on the information from the remaining unmasked parts. This approach helps the model capture not only local details but also the broader contextual information of the entire image.
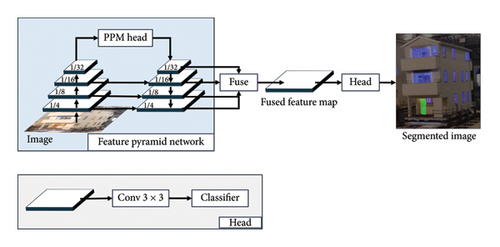
Next, we performed pretraining for semantic segmentation. BEiT, pretrained with MIM using ImageNet, was utilized as the backbone encoder for UPerNet [41]. The advantages of employing UPerNet as the baseline model are twofold. First, it is a popular choice for models with transformer-based backbones, such as BEiT and Swin Transformer, making it a well-established baseline for real-world data studies like ours. Second, after training, the UPerNet model achieved an intersection-over-union (IoU) of 0.82 for windows and 0.84 for doors, demonstrating high accuracy for these structural components. The UPerNet model architecture is illustrated in Figure 3. UPerNet incorporates a pyramid-pooling module that extracts feature maps from each encoder stage, integrating information across different scales for more precise segmentation. Additionally, although BEiT is not the latest model, it provides an effective balance between performance and computational efficiency for our specific application. Its implementation allowed us to utilize pretrained models and incorporate TL, significantly reducing training time while maintaining high accuracy in the results. For semantic segmentation pretraining, we used the ADE20K dataset [42]. This pretraining aimed at enabling the BEiT + UPerNet model to acquire the versatility necessary for effective segmentation tasks.
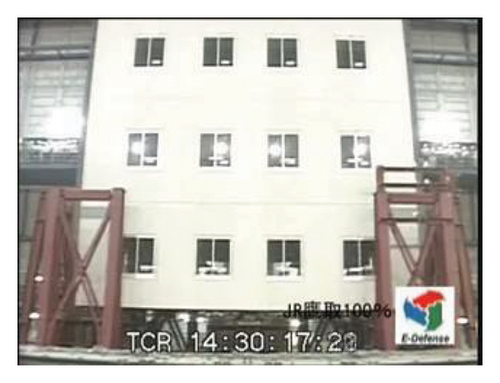
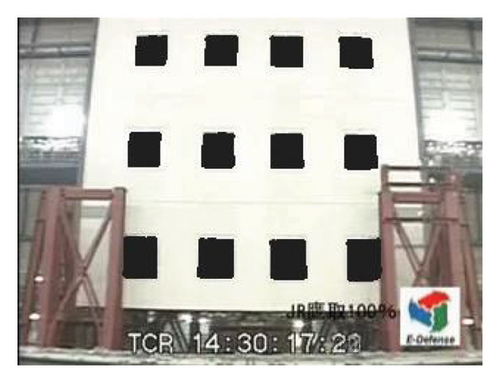
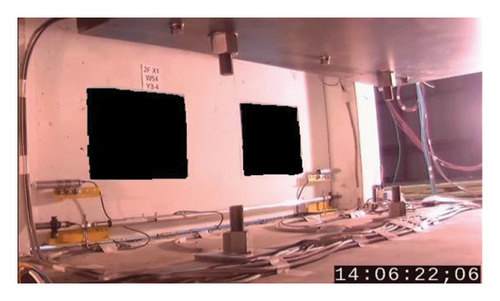
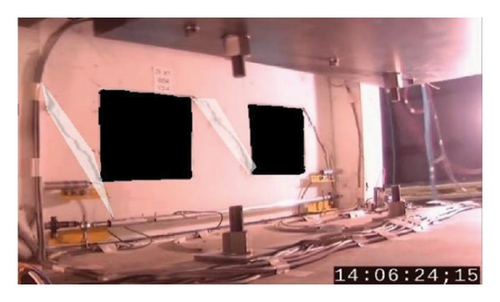
An example of RoU recognition for removing the window parts of a building using NIED video data [23] is shown in Figure 4. These images depict the frames before and after RoU recognition. In the detected area, pixel values are set to zero, allowing for the removal of these pixels in the subsequent anomaly event detection process. By successfully identifying the structural RoU, video data that exclusively contain structural component information are utilized, thus improving the computational efficiency of the feature extraction process.
2.4. Overview of Anomaly Event Detection Method
The anomaly event detection method for video data as detailed in [18] is summarized in this section. The method comprises three main steps: (1) estimating the velocity field using optical flow, (2) extracting features with the node strength network, and (3) enhancing features through a morphological opening operation, as illustrated in Steps two to four of Figure 1. This approach allows for the visualization of the timing and location of anomalous events, which result from local disturbances in the vector field caused by nonlinear structural vibrations.
2.4.1. Velocity Field Estimation by Optical Flow
A widely used CV technology, optical flow, was initially employed for estimating the velocity vector field. Unlike traditional optical flow algorithms such as the HS and LK methods, the Farneback optical flow method utilizes polynomial expansion, enabling it to model more complex motion patterns than linear models. As a result, the Farneback algorithm is better suited for estimating the movements of objects with intricate trajectories [43].
2.4.2. Feature Extraction by Extended Node Strength Network
A node strength network was developed to detect prominent crowd motions [44, 45]. This network quantitatively describes pedestrian movements and can be used for image-edge detection. The study assumes that the velocity vector field is locally disrupted by sudden changes in vector magnitude and direction due to structural nonlinearities. As a result, the node strength network is applicable, and the original algorithm was presented in [44].
2.4.3. Feature Enhancement by Morphological Opening Operation
Morphological operations are fundamental techniques in image processing that alter shapes within an image through mathematical morphology [46]. These operations utilize a structuring element—a small geometric probe—that interacts with image pixels to analyze and modify shapes and textures. The primary morphological operations, dilation and erosion, either expand or shrink objects in a binary image. Dilation helps connect disjointed parts and fill gaps, while erosion removes small details and separates closely positioned objects.
3. Anomaly Event Detection for Three-Dimension Scaled Shaking Table Test
In this section, the proposed method is validated using two cases from a full-scale shaking table test conducted by the NIED in Hyogo, Japan. The test included a 1/3 scale model of a six-story RC building and a three-story full-scale wooden house. The RC building case aimed to detect significant shear cracks in the walls, demonstrating the effectiveness of the identification method and the improved computational efficiency achieved through the integration of TL. Conversely, the wooden house case focused on detecting tiny wall cracks that are difficult to observe with the naked eye, thereby validating the proposed method’s applicability to smaller, less visible anomalies.
3.1. Validation on a RC Frame Building
3.1.1. Experiment Introduction
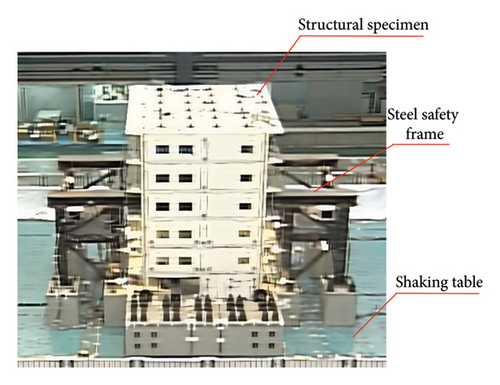
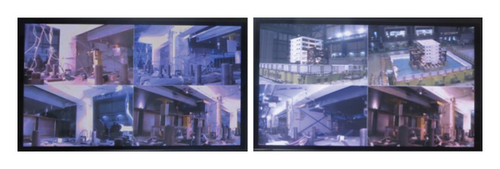
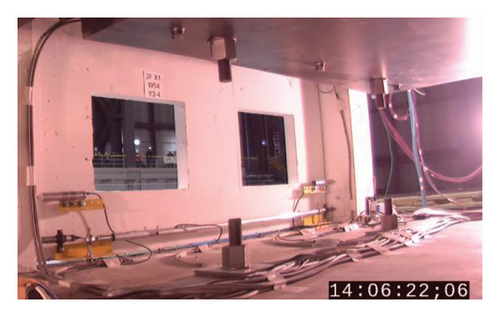
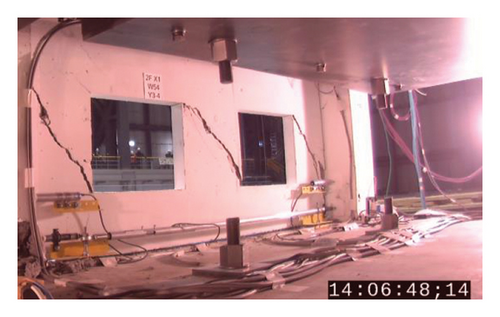
The test specimen was a 1/3 scale model of a six-story RC building, constructed according to the current Building Standard Law of Japan [48]. Figure 5 provides an overview of this specimen, including both the structural model and the surrounding steel safety frame. The shaking table test included 26 scenarios using input waves from random signals: the Japan Meteorological Agency (JMA) Kobe wave and the Takatori station of the West Japan Railway (JR Takatori) wave. To closely monitor local responses and damage, 32 cameras were strategically placed both inside and outside the building, with some camera locations illustrated in Figure 6. This study utilized a case with pronounced shear cracks for anomaly detection, as depicted in Figure 7. The resolution of the selected view, after preprocessing, was 552 × 316 pixels. Figures 7(a) and 7(b) show example cases before and after the appearance of pronounced shear cracks, respectively.
3.1.2. Structural RoU Identification by TL
TL is a powerful ML technique that allows a model developed for one task to be repurposed as the starting point for another task. To improve computational efficiency and address the impact of nonstructural RoU, such as the fluctuating light source visible outside the left window in Figure 7, TL is applied. This light source’s intermittent visibility during the shaking process causes erroneous area identification, which can compromise detection accuracy. To tackle this issue, TL focuses the segmentation model on nonstructural elements, specifically targeting the identification of the two windows. As detailed in Section 2.2, the model initially learns image feature extraction from a large dataset and is then fine-tuned using a smaller dataset of 170 images to improve the segmentation of doors and windows. This stepwise training approach allows for effective segmentation of nonstructural elements even with limited data. The segmentation results for the windows, shown in Figure 8, illustrate the effectiveness of TL in this context. A pretrained model, with knowledge of general image features, provides a strong foundation. Through fine-tuning with minimal data, the model accurately segments nonstructural elements despite light source variability and structural diversity.
3.1.3. Anomaly Event Detection by Proposed Extended Node Strength Network
The far-back optical flow, as described in Section 2.3.1, is employed to estimate the velocity field. The parameters were set as follows: three pyramid layers, a pyramid scale of 0.5, three iterations, a pixel neighborhood size of 12 pixels, and an average filter size of 25 pixels. After obtaining the displacement results using equation (6), velocity information can be readily derived by taking the differential, provided the video frame rate is known.
Video data spanning 10 s were analyzed to validate the effectiveness of the proposed method. The results for estimating the velocity fields in two image frames—before (t = 4.2 s) and after (t = 4.5 s) the occurrence of shear cracks—are shown in Figure 9. The length of the arrows represents the instantaneous velocity of the pixel points, while the direction of the arrows indicates the velocity direction. It was observed that the occurrence of shear cracks caused a distinct nonlinear change in velocity within the affected area. However, velocity alone is not a reliable indicator of this anomaly. This limitation is due to the fact that changes in velocity cannot uniquely identify anomalous events, as other regions—such as window edges and areas around wires and bolts—also show velocity variations.
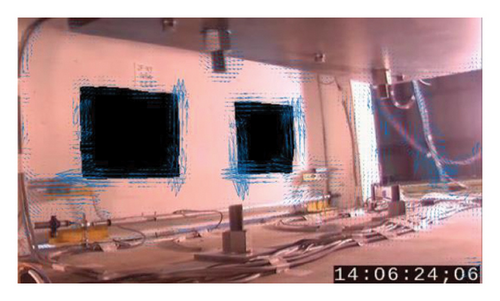
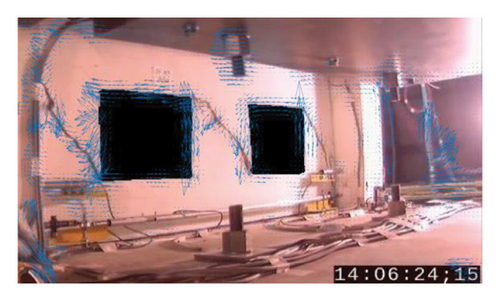
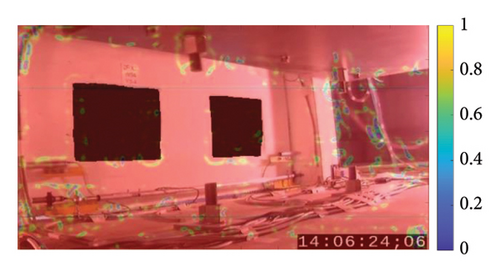
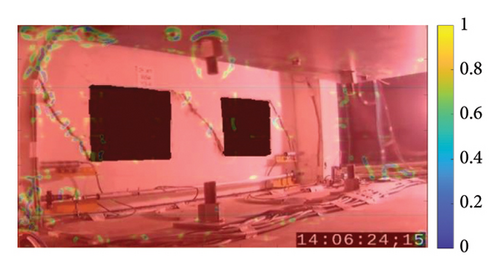
To represent the anomaly event and enhance its features, an extended node strength network and a morphological opening operation were utilized. The extended node strength network was constructed based on the formulations described in Section 2.3.2. The extended node strength is calculated using equation (12), and min-max normalization was applied to the matrix of the extended node strength, represented by matrix S in equation (13). The feature extraction results for the frames shown in Figure 9 are presented in Figure 10. The contours of the normalized node strength matrix depict the motion information of the pixel points. Figure 10(a) shows that, before the occurrence of the crack, there were no densely highlighted regions except for some boundary areas. In contrast, Figure 10(b) demonstrates that, after the development of shear cracks, a densely highlighted region appears within the crack area. However, intense vibrations concurrently lead to nonlinear motion of the wire, causing densely highlighted regions to also appear around the wire, which affects the accuracy of detecting anomalous events. Therefore, feature enhancement is crucial.
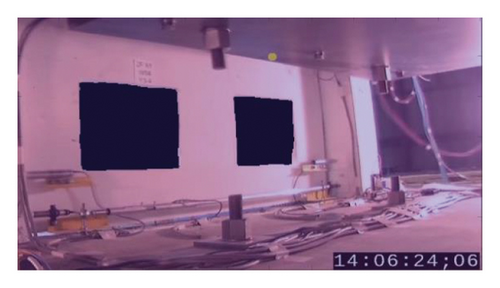
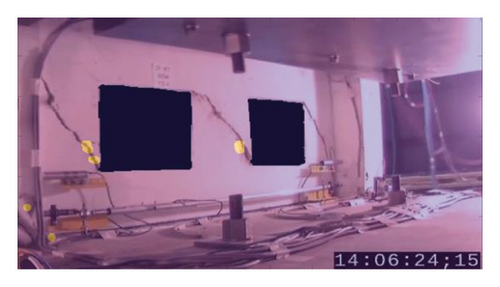
A combined approach using difference processing and morphological opening operations was introduced to extract anomalous events by enhancing mutations in the highlighted area, as detailed in Section 2.3.3. Morphological opening removes small objects or noise from binary or grayscale images while preserving the overall structure of larger objects. A difference process is applied to the contour images from consecutive frames of the node strength network. The resulting differential image is then converted into a binary image based on a predefined threshold, set to 30 pixels for optimal enhancement. Following this, a disk-shaped structuring element with a five-pixel radius is used for the opening operation. The optimized results after the morphological opening operation for all differenced frame images are shown in Figure 11. In this figure, the intensity within the yellow region is 255, while the remaining regions exhibit a value of zero. As shown in Figure 11(a), almost all highlighted areas are eliminated before crack expansion (compared with Figure 10(a)). Figure 11(b) shows that nearly all noise and incorrect detections are removed, leaving only the highlighted regions corresponding to the two shear cracks. This result demonstrates the occurrence of anomalous events and indicates improved detection effectiveness.
To further quantify the identification accuracy, we proposed two evaluation indices p1 and p2. p1 is the ratio of the number of pixels of highlighted areas in the anomaly region to the number of pixels of highlighted areas in the entire frame image. p2 is the ratio of the number of pixels of highlighted areas in the anomaly region to the number of pixels of the anomaly region. The anomaly regions are first selected manually as shown in the white area of Figure 12. In this case, the number of pixels of highlighted areas in the anomaly region, the number of pixels of highlighted areas in the entire frame image, and the number of pixels of the anomaly region are 440, 601, and 4202, respectively. Thus, the values of p1 and p2 can be calculated as 0.73 and 0.10. It can be observed that the value of p2 is relatively small, suggesting difficulty in fully characterizing the entire anomaly events area. However, the larger value of p1 indicates that the anomaly events area can be effectively localized, providing valuable reference information for subsequent damage maintenance efforts.
3.2. Validation on a Wooden House
The previous case highlights the efficacy of the proposed method in detecting anomalous events, particularly pronounced shear cracks. To further validate the method’s applicability for detecting minor anomaly events, this section emphasizes its advantages. It illustrates the effectiveness of the method in identifying tiny cracks during a full-scale wooden house shaking table test.
3.2.1. Experiment Introduction
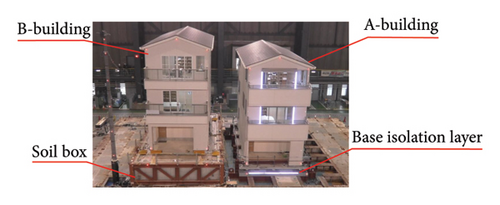
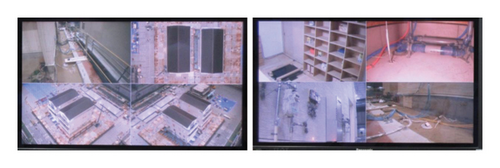
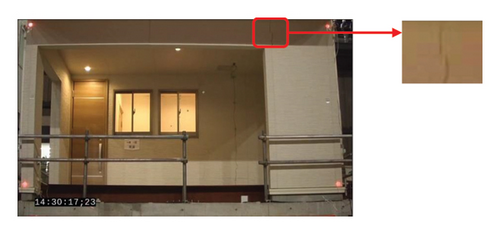
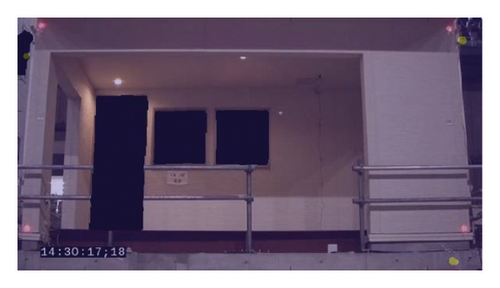
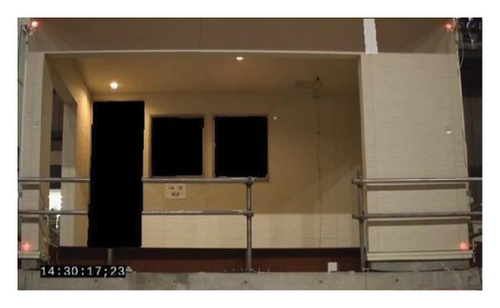
This test involved two buildings: Building A, a post-and-beam structure, and Building B, a shear-wall structure, as shown in Figure 13. Both buildings were designed with identical configurations and layouts, assuming similar earthquake resistance capabilities during the design phase. The key difference is that Building A is equipped with a base-isolation system consisting of 15 sliding bearings, six laminated rubbers, and six oil dampers, whereas Building B is supported on soil [49]. The experiment included 28 scenarios using the same seismic inputs as in the previous case, such as random signals, JMA Kobe waves, and JR Takatori waves. Additionally, 29 cameras were strategically placed to monitor both buildings comprehensively, as illustrated in Figure 14. For this case, video data capturing the opening and closing process of a tiny crack in Building A was selected to assess the effectiveness of the proposed method. After preprocessing, the video had a resolution of 680 × 400 pixels and a duration of 10 s. Example frames at 2.6 and 2.8 s from the video clip, showing the crack’s development, are presented in Figure 15. In Figure 15(a), the crack’s development is not visible, whereas Figure 15(b) shows the crack development within the red rectangular area.

3.2.2. Anomaly Event Detection Result by the Proposed Method
Similar to Section 3.1.2, structural RoUs were identified to enhance computational efficiency and detection accuracy. In this case, the RoUs included doors and windows. The identification results are shown in Figure 16. It can be observed that one door and two windows in Building A are accurately identified, while a window in the upper left corner of the frame in Building B is also successfully detected.
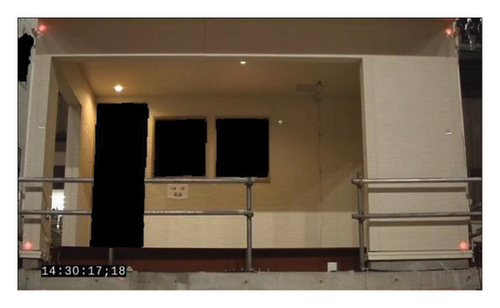
The next step involves estimating the velocity field. To facilitate the detection of tiny cracks, the pixel neighborhood size parameter, which is critical for the robustness of the Farneback optical flow method, was reduced to 5. All other parameters remained unchanged from the previous case in Section 3.1: The number of pyramid layers is set to three, the pyramid scale is 0.5, the number of iterations is three, and the average filter size is 25 pixels. The results for the velocity field during the closing and opening of the tiny cracks are shown in Figure 17. Figure 17(b) reveals that only short arrows are present in the area of the tiny crack, making it difficult to identify the crack solely by evaluating the velocity field.
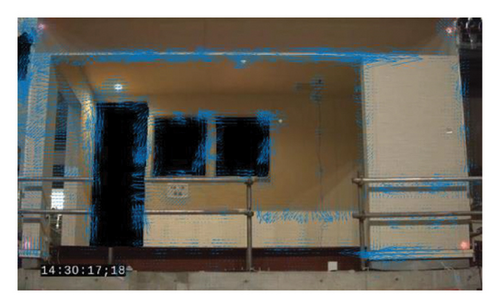
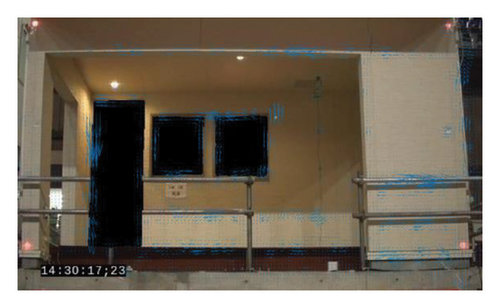
The subsequent steps involved feature extraction and enhancement. As shown in Figure 18, the reduction in neighborhood size parameters resulted in a higher number of discretely highlighted parts (noise) compared to the case in Section 3.1. Despite this, a clearly highlighted area near the tiny crack remains visible in Figure 18(b). After feature enhancement, as illustrated in Figure 19, nearly all noise areas were effectively removed. Figure 19(a), shows the crack in a closed state, while Figure 19(b) highlights distinct changes in the area where the crack develops at t = 2.8 s, demonstrating the opening of the tiny crack. However, a bright spot near the window area in the upper left corner indicates misidentification due to insufficient window identification accuracy in the TL process. Additionally, a highlighted point in the foundational section suggests a need for further investigation. Overall, the anomaly event detection results demonstrated high and acceptable accuracy.

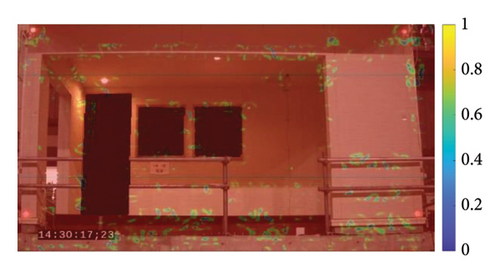
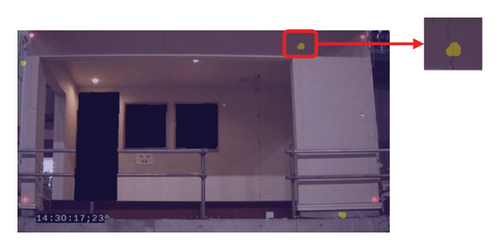
Similar to Section 3.1.3, the detection results are quantitatively analyzed. In this case, the anomaly regions are selected manually as shown in the white area of Figure 20. The number of pixels of highlighted areas in the anomaly region, the number of pixels of highlighted areas in the entire frame image, and the number of pixels of the anomaly region are 108, 288, and 870. However, unlike the previous case, the 76 highlighted pixels in this case are located in the adjacent structure (the upper left window) and can therefore be excluded from the analysis. Thus, the values of p1 and p2 can be calculated as 0.51 and 0.12. In this case, the detection accuracy decreases due to the small size of the crack. However, it still offers a useful reference for identifying potential anomaly areas, providing a valuable candidate region for further precise anomaly event detection and localization.
3.3. A Discussion for Computational Efficiency
In this study, a key advantage of combining TL was the improvement in computational efficiency. Early identification and removal of RoUs reduced the number of input pixels needed for subsequent node strength network construction. Experimental procedures were conducted on a Windows 10 Pro 64-bit operating system, with data analysis performed using MATLAB R2022a and Python 3.10.13. The segmentation model ran on a PC equipped with an RTX 3090 GPU. Table 1 compares computational efficiency before and after employing TL for structural RoU identification. Once the BEiT + UperNet model with TL was trained, it could predict door and window components within 0.253 s per image frame. In contrast, computing the node strength network for one image required 159 and 249 s for the two cases, respectively. Consequently, the time required for processing target video data, including RoU prediction using the deep learning model, was significantly reduced. Additionally, we expanded our dataset for comparison by incorporating data from the 4-story steel structure shaking table test, as shown in Figure 4. Table 1 illustrates a positive correlation between improvements in computational efficiency and the proportion of structural RoUs. The selected test cases demonstrate an average efficiency improvement of approximately 10%. In practical applications, analyzing cases with a larger proportion of structural RoUs results in greater efficiency gains.
| Case | Computing time (per frame) | Improvement ratio (%) | RoU proportion (%) | |
|---|---|---|---|---|
| Before (s) | After (s) | |||
| Four-story steel building | 64 | 59 | 7.81 | 8.59 |
| Six-story RC frame building | 159 | 144 | 9.43 | 9.66 |
| Three-story wooden house | 249 | 224 | 10.04 | 10.21 |
4. Conclusions
- •
TL enables efficient learning processes. With only 170 training images, segmentation of structural envelope components like doors and windows was achieved with an IoU greater than 0.8. This success can be attributed to feature extraction methods learned from large-scale image datasets, facilitated by MIM pretraining with BEiT and segmentation pretraining with the BEiT + UPerNet framework.
- •
The Farneback optical flow method facilitates the estimation of full-field displacement responses from video data, allowing for the effective application of feature extraction methods to identify nonlinear disturbances. Furthermore, the developed feature extraction and enhancement method has been effectively applied to video data from two large-scale shaking table tests conducted by E-defense. The detection and quantitative analysis results show that the proposed method identifies the locations of anomalous events with acceptable accuracy, including pronounced shear cracks and tiny cracks.
- •
TL is effective in identifying RoUs, which reduces computational costs. The integration of TL has led to approximately a 10% increase in computational efficiency. Moreover, as computational efficiency improves with the proportion of structural RoUs in the video data, analyses involving a higher proportion of these regions are expected to yield more significant enhancements.
Although the proposed method can detect anomalous events, several limitations and issues remain that need to be addressed in future research. First, since the analysis relies on video data, factors such as luminance, resolution, and frame rate directly affect detection accuracy. Second, detecting tiny cracks requires adjusting parameters that influence robustness, which may also increase noise. Balancing these factors warrants further investigation. Third, while this study focuses on identifying structural RoUs, enhancing the identification of detailed structural components, such as beams and columns, and separately analyzing these parts could significantly improve both detection accuracy and efficiency for anomaly events.
Conflicts of Interest
The authors declare no conflicts of interest.
Funding
This study was supported by the JST SPRING Program (grant number JPMJSP2124) and the JST FOREST Program (grant number JPMJFR205T).
Acknowledgments
The authors gratefully acknowledge the support of the JST SPRING Program (grant number JPMJSP2124) and the JST FOREST Program (grant number JPMJFR205T). The authors also thank to use of the video data on “Archives of E-Defense Shaking table Experimentation Database and Information (ASEBI),” National Research Institute for Earth Science and Disaster Resilience (NIED), Japan.
Open Research
Data Availability Statement
The data that support the findings of this study are available from the corresponding author upon reasonable request.


