Bolt Looseness Quantitative Visual Detection With Cross-Modal Fusion
Abstract
Intelligent bolt looseness detection systems offer significant potential for accurately promptly detecting bolt looseness. Bolt looseness detection in high-speed train undercarriages is challenging due to the low-texture surfaces of structural parts and variations of illumination and viewpoint in typical maintenance scenes. These factors hinder the quantification detection of bolt looseness using traditional 2D visual inspection methods. In this paper, we present a cross-modal fusion-based method for the quantification detection of bolt looseness in high-speed train undercarriages. We propose a cross-modal fusion approach using a cross-modal transformer, which integrates 2D images and 3D point clouds to improve adaptability to varying illumination conditions in maintenance scenes. To address geometric projection distortions caused by varying-view perspective transformations, we use the height difference between the bolt cap and the fastening plane in point clouds as the criterion for bolt loosening. The experimental results indicate that the proposed method outperforms the base-line on our dataset of 5823 annotated RGB-D images from a locomotive depot, achieving an average measurement error of 0.39 mm.
1. Introduction
Bolted connections are widely used in mechanical engineering applications, such as high-speed trains, due to their easy construction [1]. However, bolts are susceptible to loosening from impacts, natural aging, and other factors. This loosening compromises the load capacity of the connections and may lead to accidents and casualties. Therefore, bolted joints need to be carefully inspected to ensure the safe operation of trains. Traditional manual methods for detecting looseness, such as torque wrenches and percussion, are costly and labor-intensive when dealing with large numbers of bolts. Given human error and inefficiency during prolonged, repetitive nightly tasks, intelligent bolt looseness detection systems offer significant potential for accurately promptly detecting bolt looseness.
Intelligent bolt looseness detection systems can be classified as contact and noncontact methods to detect bolt looseness [2]. Bolt loosening causes axial displacement, creating a measurable height difference between the bolt cap and the fastened plane. The height difference serves as a quantitative metric inversely proportional to clamping force, effectively correlating axial displacement with preload forces [3]. Various contact sensors, including piezoelectric sensors [4], strain gauges [5], fiber optic sensors [6], and ultrasonic sensors [7, 8], have been employed to assess bolt preload forces by detecting strain changes. However, data from these sophisticated sensors often exhibit significant nonlinearity and uncertainties, necessitating advanced data processing and analysis techniques. This complexity makes the accurate assessment of loose bolts challenging and inconvenient. Additionally, contact sensors are both expensive and difficult to maintain due to the large number and density of bolts. Noncontact methods include laser-based methods [9] and vision-based methods [10]. Laser-based methods [9] measure the distance between the bolt head and fastening plane using laser displacement sensors, offering high precision and resilience to lighting. However, they require precise angle control and are expensive, limiting large-scale use.
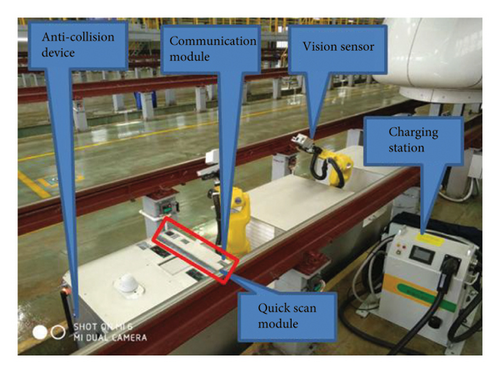
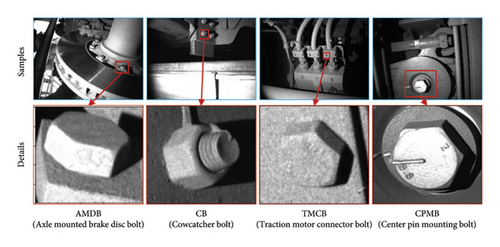
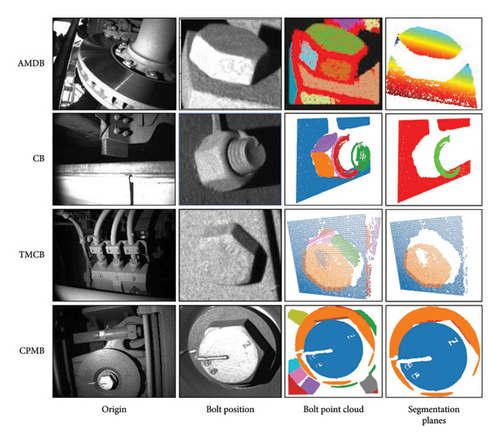
Computer vision-based noncontact methods are gaining increasing attention due to their low cost and flexible deployment. The visual bolt looseness detection system we established is shown in Figure 1. This system integrates various devices, including the vision sensor, the wireless transmission module, and other electro-mechanical components, to capture and analyze bolt images for the automatic bolt looseness detection. Traditional approaches detect bolt loosening noninvasively by extracting geometric features (e.g., exposed thread length) and classifying them using support vector machines (SVMs). The Hough transform facilitates the extraction of features while compensating for variations in viewing angles and distances [11]. Meanwhile, the Viola–Jones algorithm improves the robustness of bolt localization in complex structural layouts [12]. The quantitative detection method provides precise numerical information on bolt loosening, which is essential for the accurate evaluation and maintenance of high-speed railway operations. As shown in Figure 2, this study will focus on four types of bolts: axle mounted brake disc bolt (AMDB) [13], cowcatcher bolt (CB) [14], traction motor connector bolt (TMCB) [15], and center pin mounting bolt (CPMB). AMDB ensures braking and stable performance at high speeds. CB prevents foreign objects from striking critical parts of the train, safe-guarding overall safety. TMCB is crucial for maintaining the smooth operation and power transmission of the traction motors. CPMB ensures precise connection and load transfer, playing a vital role in maintaining the high-speed trains’ stability, comfort, and safety during high-speed operation. Current research primarily evaluates the rotation angles [1] or lengths of loose bolts [3] to quantify loosening. The rotation angles of loose bolts are determined by measuring the rotation of bolt edge lines, detected using computer vision methods such as the Hough transform line detection algorithm [10], you only look once (YOLO) [16], and an optical flow tracking algorithm [17]. However, quantitative loosening detection using loosening angles requires prior knowledge of the initial tightening states of bolts, which is difficult to obtain as the initial state of bolt joints varies. Measuring the length of the exposed bolt offers a more practical approach for quantitative loosening detection [3]. Previous studies have accessed this parameter using 2D vision techniques, such as monocular vision [18] and binocular vision [19]. In practical scenarios, the low-texture surfaces of structural parts in many machines, especially high-speed trains, and variations in illumination conditions present challenges in distinguishing objects of interest from their background. Furthermore, the variability in images of exposed bolted joints captured from different viewing perspectives often leads to errors due to geometric distortion.
The fusion of 2D images and 3D point cloud data is widely employed across various fields, such as computer vision [20] and robotics [21], to enhance the robustness and performance of visual methods. This fusion technology integrates the appearance information from 2D images with the geometric information from 3D point clouds and is categorized into three levels: data level [22], feature level [20], and decision level [23]. At the data level, spatial alignment technology is utilized to align information between 2D images and 3D point clouds. Feature level fusion involves extracting appearance features from 2D images and geometric features from 3D point clouds using specialized visual processing networks and generating joint feature representations with fusion modules such as MV3D [24] and PointFusion [25]. Decision level fusion processes the two data modalities separately, employing fusion rules and probabilistic statistical methods, such as Bayesian estimation [26], to combine decision information. Feature level fusion offers distinct advantages in multisensor information fusion. It reduces the synchronization and calibration challenges of data level fusion, lowers computational cost and complexity, and mitigates the information loss associated with decision level fusion. Additionally, it effectively integrates the multidimensional attributes of objects from different sensors for efficient information utilization. FFB6D [27] exemplifies the potential of feature level fusion by extracting features from 2D images and 3D point clouds separately, aligning multimodal data, and concatenating bidirectional features throughout the process. However, in complex scenarios such as high-speed train bolt looseness detection, the loss of point cloud or image information complicates multimodal data alignment, and directly stacking features from different modalities hampers the capture of their deep relationship.
- 1.
A novel bolt looseness quantitative detection approach utilizing 2D-3D cross-modal information, which utilizes the length of the exposed bolt in the point cloud as the loosening criterion, solving the issue of geometric projection distortion correction.
- 2.
A bolt keypoint detection method for fusing 2D-3D information based on the cross-modal attention is proposed to enhance the algorithm’s adaptability to illumination variations.
- 3.
A dataset comprising 5823 annotated RGB-D images was collected in a locomotive depot, encompassing 94 inspection items, including center pin mounting bolts and brake disc bolts. The feasibility of the algorithm in real industrial scenarios has been verified.
2. Methods
2.1. Overview
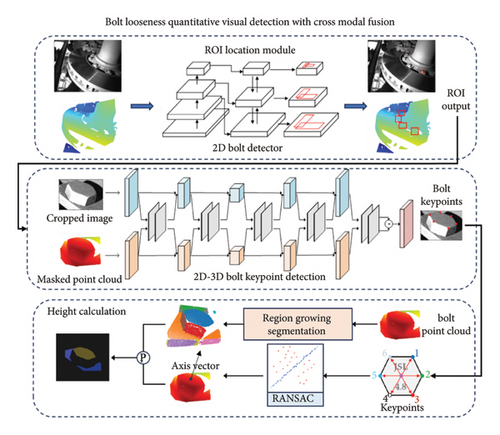
As illustrated in Figure 3, the proposed model, based on the cross-modal attention, integrates 2D-3D information to enhance adaptability to illumination variations and geometric distortions. The algorithm consists of three modules: a bolt localization module, a keypoint detection module, and a height calculation module. Initially, the bolt localization module identifies the location of the bolt in the original 2D image using the object detection model [27] and extracts the corresponding region point cloud from the 3D point cloud through coordinate space mapping, reducing the search area for subsequent process and ensuring efficient and accurate results. The keypoint detection module simultaneously utilizes 2D-3D cross-modal information to precisely locate the six corners of the bolt and then fits the plane normal vector formed by these corners, representing the bolt axis. The height calculation module segments the 3D point cloud data into multiple representative planar point cloud clusters, among which the two planes extracted parallel to the bolt axis represent the planes where the bolt cap and the fastener are located. By calculating the height difference between these planes, the method effectively identifies the bolt’s loosening state, avoiding geometric projection distortion issues caused by perspective changes.
2.2. 2D-3D Bolt Key Point Detection
To enhance the algorithm’s robustness in complex lighting environments, the keypoint detection module integrates the 2D image and 3D point cloud data to accurately locate bolt corners and fit the bolt axis. 2D RGB images provide high-resolution features that complement 3D point clouds’ geometric precision, despite their respective limitations in viewpoint sensitivity and texture clarity. This study introduces an innovative method using the crossmodal transformer architecture for nonaligned cross-modal data fusion, significantly improving the accuracy and stability of bolt 3D keypoint detection.
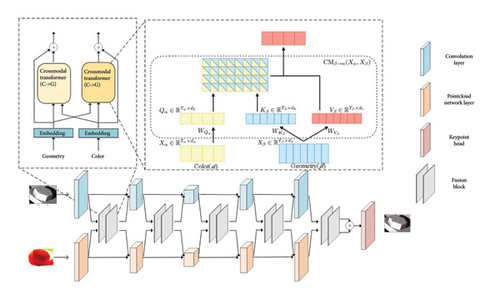
During the early encoding-decoding stage, this method fully integrates 2D/3D information and addresses alignment issues between RGB pixels and 3D point clouds. The overall structure is illustrated in Figure 4. RGB images and point clouds undergo independent feature extraction through separate encoding-decoding structures. At each layer of the encoding-decoding process, a bidirectional fusion module integrates RGB and point cloud information, forming an overall bidirectional fusion structure. This integration allows the networks to leverage both local and global complementary information to achieve better representations. The bidirectional fusion module consists of two cross-modal transformers, utilizing cross-attention mechanisms to explore intrinsic semantic relationships between RGB and point cloud data. This cross-attention mechanism enables the model to learn long-distance dependencies across modalities, allowing effective learning and integration of information from different modalities even without alignment.
2.3. 3D Bolt Height Calculation
To identify the plane where the bolt head and the component to be fastened are located from the plane point cloud clusters obtained through point cloud segmentation, we employ a curvature constraint-based region growing the segmentation algorithm. This algorithm segments the bolt point cloud and is illustrated in Figure 5.
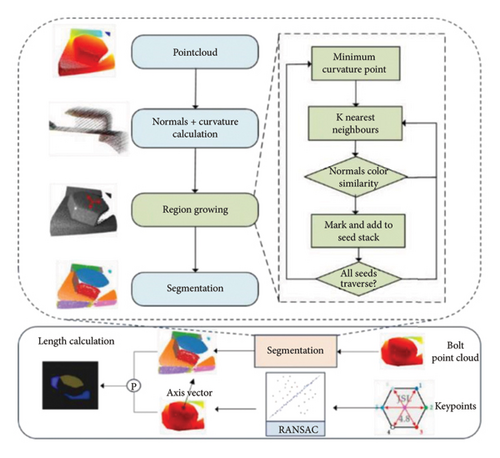
The process involves calculating the normal vector and curvature of each point in the point cloud and clustering points with consistent normal vectors, enhancing the module’s error tolerance capability through geometric attributes rather than relying on absolute coordinates. This segmentation divides the bolt point cloud into multiple planar point cloud clusters. The RANSAC algorithm [29], which iteratively excludes outliers, helping to mitigate the impact of local offset errors at key points, is then utilized to fit the plane normal vector formed by six corner points, representing the direction of the bolt axis. Using this normal vector information, two planes parallel to the bolt axis are identified, each corresponding to the regions where the bolt head and the component to be fastened are located. The pseudocode for regional growth-based point cloud segmentation is shown in Algorithm 1, which proceeds as follows: (1) Use the least square method to estimate the normal vector and principal curvature of each point in the bolt point cloud. The point with the minimum curvature is selected as the initial seed point for the point cloud clustering growth algorithm to reduce the number of segmentation subregions and improve the accuracy of the clustering. (2) To conduct an effective nearest neighbor search, a KD tree is constructed for bolt point cloud. An empty seed point sequence Sc and an empty cluster region set Rc are initialized. The initial seed points were added to the seed point sequence Sc, and the KD tree structure is used to retrieve the adjacent points efficiently. During this process, according to the predefined distance threshold or similarity measurement criteria, continuously merge the qualified nearby points into the corresponding cluster region to gradually expand each cluster region’s boundary until convergence. (3) For each selected seed point in the point cloud, compare the normal direction of these neighborhood points with the angle between the normal of the seed point and the color similarity. If the similarity index of any two points is less than the preset threshold, these points are regarded as the same type, and such points in the neighborhood are merged into the same clustering region Rc. (4) In the point cloud data newly added to the clustering region Rc, the curvature value of each point is detected and compared with the local plane curvature of the surrounding points. If a point’s curvature is less than the set threshold, it is added to the seed point sequence Sc. (5) After completing the abovementioned operations, remove the processed point from A and continue to perform steps (2) and (3) with the newly added point until the entire process is completed. Through point cloud segmentation, we divide the complex point cloud data into several representative plane point cloud clusters. To further separate the top plane of the bolt and the plane to be fastened, use the six corner points of the bolt detected by the 3D key point detection module to fit the plane normal vector formed by these six corner points, representing the direction of the bolt axis. Based on this vector information, further separate two planes parallel to the bolt axis. These two planes correspond to the areas where the bolt cap and the fastener are to be located, as shown in Figure 5. By calculating the height difference between the bolt cap and the plane where the fastener is to be located, the loosening state of the bolt can be effectively judged.
-
Algorithm 1: Regional growth point cloud segmentation.
-
Result: Segmented regions {R}
-
Initialization: Region list R⟵∅, Available points list
-
A⟵{1, …, |P|};
-
whileA ≠ ∅do
-
Current region Rc⟵∅;
-
Current seeds Sc⟵∅;
-
Pmin⟵ point with minimum curvature in A;
-
Sc⟵Sc ∪ {Pmin};
-
Rc⟵Rc ∪ {Pmin};
-
A⟵A/{Pmin};
-
for i =0 to size(Sc)do
-
//Find nearest neighbors of current seed point
-
Bc⟵Ω(Sc[i])
-
for j = 0 to size(Bc)do
-
Current neighbor point Pj⟵Bc[j];
-
ifPj ∈ Aand
-
cos−1(|NSc[i]·N(Sc[j])|) < Θththan
-
Rc⟵Rc ∪ {Pj};
-
A⟵A/{Pj};
-
if c(Pj) < cththan
-
Sc⟵Sc ∪ {Pj};
-
end
-
end
-
end
-
end
-
//Add current region to global segment list
-
R⟵R ∪ {Rc};
-
end
-
Output:{R}
3. Experiments and Results
3.1. Datasets
To verify the feasibility of this algorithm in an actual industrial maintenance scenario, three datasets were created based on data collected from multiple trips covering 94 loose bolt inspection points at a locomotive depot. These datasets were used to train and test the bolt localization module, the keypoint detection module, and the height calculation module, respectively. The data were obtained using a customized PhoXi 3D scanner with an accuracy of 0.05 mm and an operating range of 400–800 mm under diverse illumination and viewpoints. The resolution of image was 640 × 640 pixels. This paper collected a total of 5823 RGBD data sets, covering 94 components to be inspected, 13 types of bolts, with each type represented by 300–600 samples exhibiting varying degrees of looseness. The bolt localization dataset used LabelImg as the image annotation tool, with annotation data stored in the YOLO format. A vernier caliper with a precision of 0.02 mm was used to measure the real height of each bolt as the ground truth for the height calculation task. Similarly, 500 images were used as the height calculation dataset, which were divided into a training set containing 400 images and a testing set containing 100 images.
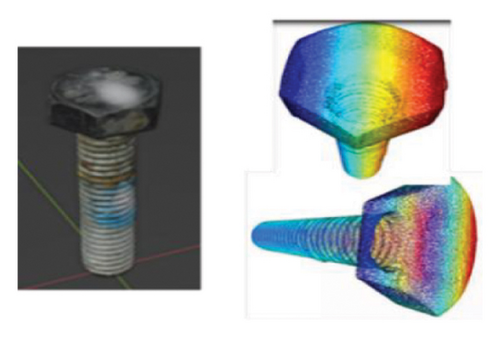
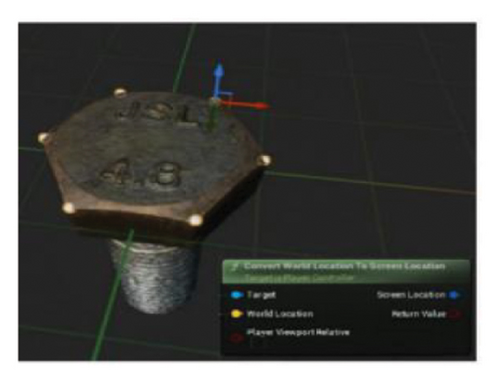
To address the high cost of manual annotation for keypoint detection datasets, a 3D keypoint detection synthetic dataset generation method based on Unreal Engine was proposed, as shown in Figure 6(a). Realistic bolt models were rendered in Blender and imported into Unreal Engine 5.1.0 to construct a scene. Marks were placed on the six corners of the imported bolt models in the virtual engine to obtain their coordinates, which were then converted to camera coordinate system coordinates. By changing the camera position and scene lighting, data from all directions and multiple perspectives were obtained. During data generation, the bolt pose changed randomly to obtain diverse data. The RGB map, depth map, and corresponding annotation files were automatically saved. This synthetic data generation method produced 1600 sets of high-quality RGB-D image datasets, which were used in a 6:1:1 ratio for the training set (1,200), validation set (200), and test set (200). Additionally, 400 sets of data were manually labeled, as shown in Figure 6(b).
3.2. Evaluation Metrics
- 1.
NE calculates a relative distance measure by dividing the Euclidean distance between the predicted and actual keypoint positions by a normalization parameter (e.g., the average distance of keypoints to a reference point in the image) to assess the discrepancy between the predicted keypoint locations and the ground truth annotations. Lower NE values indicate better performance, as they imply a stronger ability of the model to accurately localize keypoints. The formula for calculating NE is as follows:
() -
where K is the number of key points, M is the number of test samples in the test data set, and δk is the weight coefficient.
-
In this study, K = 6 and δk = 1.
- 2.
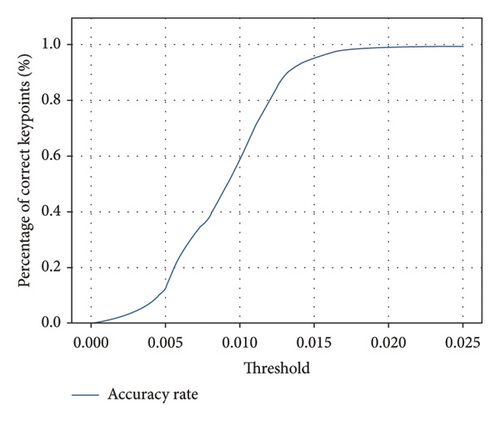
PCK [30] measures the proportion of correctly predicted keypoints based on a distance threshold, which is typically normalized as a relative value. Common thresholds range from 0.1 to 0.5 [31]. In our study on bolt loosening angle detection, we use bolt length as the reference scale and adopt a stricter threshold upper limit of 0.025 to ensure precise keypoint localization. The formula for calculating PCK is as follows:
() -
where K is the number of key points and M is the number of test samples in the test data set. In this study, K = 6.
3.3. Implementation Details
The bolt localization module was trained using transfer learning on six NVIDIA TESLA V100 GPUs. YOLOv5s [32] was selected for its high accuracy and efficiency. For the keypoint detection module, we utilized an ImageNet pre-trained ResNet34 [33] as the encoder for RGB images, followed by a PSPNet [34] as the decoder. For point cloud feature extraction, we employed the RandLA-Net [35] encoder-decoder architecture for representation learning. The input point cloud was initially fed into a shared MLP layer to extract per-point features, followed by four encoding and decoding layers to learn features for each point.
Data augmentation methods are also used to expand the dataset [36]. Data augmentation techniques not only effectively increase the size of the training samples but also reduce the risk of model overfitting. In this paper, color jittering and image transformation are used for data augmentation. Color jittering mainly achieves the enrichment of the visual effect of the image by adjusting the attributes of the image such as brightness, contrast, and saturation. Image conversion focuses on finding edges, sharpening, and enhancing details, further improving the overall quality of the image. This processing method not only optimizes the training effect of the model but also improves the generalization ability of the model.
The abovementioned critical thresholds used in Algorithm 1 were determined through experimental validation: (1) The angular threshold of 2.8 was iteratively optimized using a dataset of 5823 RGB-D bolt images, achieving a balance between over-segmentation (caused by small angles) and under-segmentation (resulting from large angles), while accounting for noise inherent in the PhoXi 3D scanner (with an accuracy of 0.05 mm). (2) The curvature threshold of 0.08 was established through statistical analysis of 2000 samples, including both synthetic and manually annotated data, effectively differentiating planar regions (curvature < 0.08) from high-curvature edges, such as bolt threads (curvature > 0.12). (3) The normal distance threshold of 0.06 was calibrated using computer-aided design (CAD) models to align with the noise characteristics of the depth sensor, and its validity was further confirmed using vernier calipers (with a precision of 0.02 mm).
3.4. Main Results
We compare four different methods to validate the accuracy of our approach in calculating the length of the exposed bolt for loosening detection. First, we applied a regression network based on ResNet18 [33] to calculate the bolt length. The second method comprises two modules: the first uses faster-RCNN [38] (similar to the bolt localization module in our method) to locate the exposed bolt, and the second imports the located bolt into a ResNet18-based regression network to measure its length. Unlike our method, the third method bypasses the bolt localization module and directly employs the cascaded pyramid network (CPN) [37], and the length calculation module detects the six key points and determines the bolt length. Table 1 shows the average errors between the predicted bolt lengths (using the three methods and our method) and the ground truth. The average length errors for the four methods were 12.30 mm, 8.93 mm, 11.88 mm, and 0.61 mm, respectively, whereas our method achieved an error of 0.39 mm. Compared with the latest algorithm, the proposed bolt loosening algorithm improves the detection accuracy by 36.1%. This demonstrates that the traditional regression network cannot accurately measure the length of the exposed bolt for loosening detection. Even with faster-RCNN applied to locate the bolt, the regression network did not yield satisfactory results. Furthermore, the detection of bolt is crucial for calculating the bolt length. Ignoring the bolt localization module significantly increased the average length error. In summary, our proposed method, which integrates the bolt localization module, the keypoint detection module, and the length calculation module, outperformed the other four measurement methods. Furthermore, our method can detect each bolt image in about 95 ms, meeting the real-time inspection demand.
3.5. Bolt Keypoint Detection Result
To verify the effectiveness of the proposed 2D/3D information fusion approach, we investigate the NE results of the bolt keypoint detection module under different settings. As shown in Table 2, the NE significantly increased in both cases, indicating that the proposed information fusion method effectively improves algorithm performance. Furthermore, to validate the effectiveness of synthetic data in enhancing algorithm performance, we trained and evaluated the normalized error metric on both a purely manually labeled dataset and datasets with varying proportions of synthetic data. The results are shown in Table 2. When the manual labeled data set is combined with the synthetic data set for training, the NE value obtained by the test is 0.00879, indicating that the proposed method shows a high level of accuracy in the bolt corner detection task. In contrast, when trained alone using only the manually labeled dataset, the NE value is 0.00961. As the proportion of synthetic data increased, the normalized error gradually decreased. After incorporating all synthetic data into training, the NE decreased by 8.53%. We also compared our approach with feature concatenation (ours-concat) and single-modality 3D data (ours-w/o2D). Results showed that using only concatenated features increased NE by 50.9%, while relying solely on 3D data increased NE by 79.9%, verifying the effectiveness and error tolerance capability of cross-modal fusion. These findings highlight the complementary relationship between visual appearance and spatial geometric data, demonstrating how their integration significantly enhances the precision and reliability of bolt keypoint detection systems. Meanwhile, the PCK evaluation results are shown in Figure 7. It can be seen that within the threshold range of (0, 0.015), the PCK value exhibits a significant upward trend; however, the growth rate starts to decline once the threshold exceeds 0.015. As can be observed, the PCK value reaches 90.7% at a threshold of 0.015 and ultimately achieves a remarkably high PCK value of 99.3%. Compared to data augmentation methods, our 2D/3D cross-modal information fusion method can significantly improve the detection performance of bolt keypoints.
| Method | Synthesized data (%) | NE (10−3 m) | NE reduction (%) |
|---|---|---|---|
| Ours | 0 | 9.61 | 0 |
| Ours | 25 | 9.47 | 1.46 |
| Ours | 50 | 9.02 | 6.14 |
| Ours | 75 | 8.83 | 8.12 |
| Ours | 100 | 8.79 | 8.53 |
| Ours-concat | 100 | 13.26 | −50.9 |
| Ours-w/o2D | 100 | 15.81 | −79.9 |
- Note: The best results are highlighted in bold.
3.6. Bolt Height Calculation Result
To evaluate the measurement accuracy of the proposed method in a realistic application scenario, we conducted a height measurement accuracy assessment experiment on a dataset collected on-site at the rolling stock depot. We calculated the error between the algorithm’s measurement results and the ground truth reference to assess the algorithm’s accuracy.
Figure 8 illustrates the process of detecting loose axle-mounted brake disc bolts, loose derailment device bolts, and loose traction motor connector bolts. The images from left to right show the original image, bolt localization results, point cloud segmentation results, and extraction results for the bolt head and the plane where the fastener is located. Table 3 presents the evaluation results of three performance metrics—maximum absolute error, maximum relative error, and average error—for different bolt points in the test dataset. The average error of the proposed algorithm is 0.39 mm, while the average error of the latest bolt loosening algorithm based on quantitative measurement is 0.61 mm. Thus, the proposed algorithm improves detection accuracy by 36.1% compared to the latest algorithm.
| Bolt type | Maximum absolute error (mm) | Maximum relative error (%) | Average error (mm) |
|---|---|---|---|
| AMDB | 0.36 | 2.47 | 0.16 |
| CB | 0.39 | 3.28 | 0.22 |
| TMCB | 0.32 | 5.93 | 0.12 |
| CPMB | 0.34 | 0.78 | 0.17 |
| Overall | 0.52 | 5.93 | 0.39 |
- Abbreviations: AMDB, axle mounted brake disc bolt; CB, cowcatcher bolt; CPMB, center pin mounting bolt; TMCB, traction motor connector bolt.
4. Discussion
Experimental results indicate that the proposed method outperforms the leading benchmarks but exhibits limitations in certain scenarios, largely due to sensor inaccuracies, bolt localization errors, and keypoint detection challenges. Sensor noise and calibration drift lead to inconsistent measurements; however, multiframe fusion [39] and refined calibration procedures can mitigate these issues. Misalignment in 3D point cloud region extraction introduces bolt localization errors, which can be addressed through a multiview voting mechanism [40]. Meanwhile, keypoint detection problems, especially on low-texture or occluded surfaces, are alleviated by augmenting training data with synthetic samples [41, 42], thereby enhancing model generalization. Despite solid performance in simulations and real-world experiments, the method is constrained by incomplete data diversity, focusing mainly on hexagonal head bolts, and reliance on high-precision 3D scanners. Industrial conditions further introduce environmental interference, such as mechanical vibrations, underscoring the need for inertial sensor integration. Although the method achieves an average error of 0.39 mm under controlled conditions, more robust solutions are required for large-scale, dynamic deployments [43]. Future work will prioritize lightweight algorithm design through knowledge distillation, explore cost-effective depth cameras (e.g., Intel RealSense L515), and expand the dataset to encompass diverse industrial scenarios, including oil contamination, rust, highly reflective surfaces, and various bolt types. These enhancements aim to improve scalability, reliability, and adaptability in real-world settings.
5. Conclusion
In this paper, we propose a quantitative detection approach for bolt looseness utilizing 2D-3D cross-modal vision information. This method calculates the length of an exposed bolt through three concatenated modules: a bolt localization module, a keypoint detection module, and a height calculation module. Through cross-modal fusion and geometric attributes, the method achieves error isolation and compensation between modules, enabling robust bolt looseness detection. First, the bolt localization module locates the exposed bolt. Second, the keypoint detection module identifies six keypoints on the exposed bolt. Finally, the coordinates of these six keypoints, along with camera parameters, are input into a length calculation module to determine the bolt’s length. The robustness of our method is validated using data collected from various maintenance scenarios. However, the proposed method is still insufficient for detecting slight bolt loosening. Future improvements will incorporate multiview fusion and dynamic adjustments through active vision to further enhance fault tolerance in extreme offset scenarios.
We believe that overall measurement accuracy for the bolt’s length will be enhanced, enabling the visual recognition of slight bolt loosening in the future.
Conflicts of Interest
The authors declare no conflicts of interest.
Funding
The research was supported by the National Natural Science Foundation of China under grant 62088101 and grant U2013602, in part by the Shanghai Municipal Science and Technology Major Project under grant 2021SHZDZX0100, and in part by the Shanghai Municipal Commission of Science and Technology Project under grant 22ZR1467100 and grant 22QA1408500.
Open Research
Data Availability Statement
The data that support the findings of this study are available from the corresponding author upon reasonable request.


