The Effects of Nonproportional Damping on the Identification of Offshore Wind Turbine Foundation Properties
Abstract
There is a consistent discrepancy between the predicted and measured dynamic responses of in situ offshore wind turbine (OWT) structures. Underestimation of the foundation soil stiffness is thought to contribute significantly to this difference. Identification of the in situ foundation properties of OWT from monitoring data would reduce this uncertainty, providing critical feedback on foundation design methods and aiding lifetime reassessment. In this study, a system identification framework for estimating the in situ foundation stiffness of a parked OWT is presented using a model updating approach applied to simulated data. The results are shown to accurately replicate the behaviour of the true foundation. The study also demonstrates that the nonproportional nature of the aerodynamic damping causes the structure to exhibit mode shapes whose real parts do not correspond to those of the undamped system. A normalisation technique is applied that obtains a close approximation of the undamped mode shapes from the complex damped mode shapes. It is demonstrated that large errors are introduced in the identified foundation behaviour if this normalisation is not employed. Such errors can result in misleading interpretations of the foundation or superstructure properties of the OWT.
1. Introduction
Across the offshore wind industry, there is a consistent discrepancy between the predicted and measured dynamic responses of in situ turbine structures. For example, estimates of the first natural frequency from monitoring data are often observed to be around 5% higher than expected from the design and in some cases, up to 20% higher [1]. A large proportion of this discrepancy is believed to stem from the foundation, which is most commonly a monopile, as a result of underestimation of the soil-structure interaction stiffness [2]. Uncertainty arises from the large variability in offshore soil investigation measurements [3] and the challenges of numerical modelling of soil-structure interaction [4]. Identification of the in situ foundation properties of offshore wind turbines (OWTs) from monitoring data would reduce this uncertainty, providing critical feedback on foundation design methods and aiding lifetime reassessment.
Modal analysis is a widely employed technique for assessing changes in the behaviour of wind turbines [5, 6]. This can be extended to identify the characteristics of structural components using model updating, where the difference between the identified modal parameters from sensor data and the corresponding model predictions are minimised in order to optimise a vector of unknown model properties [7]. Versteijlen used this method to identify the foundation characteristics of a monopile, excited by a hydraulic shaker, prior to the installation of the wind turbine [8]. Structural identification has not widely been employed in offshore wind foundation assessment due to poor predictive modelling and a lack of benchmark validation.
In this study, a system identification framework for estimating the in situ foundation stiffness of an OWT under ambient excitation is presented using a model updating approach. In this case, the unknown model properties belong to the foundation and the “experimental” modal data are the estimated frequencies and mode shapes obtained from simulated tower accelerometer data using an operational model analysis approach.
Structures that are nonproportionally damped will exhibit complex-valued mode shapes [9], while proportional damping results in real-valued mode shapes. The real-valued form is required for certain mode shape analyses and generally favoured for convenience. Furthermore, mode shapes obtained from a proportionally damped system are equivalent to the undamped mode shapes. This is particularly convenient in cases where modelling the damping accurately is difficult, such as the aerodynamic damping of OWT. With structures that are “nearly” proportionally damped, it is possible to assume proportional damping without introducing large errors in analyses. However, the work in this study demonstrates that OWT appear not to be one of these structures. A normalisation technique, originally developed by Fillod [10] in 1980 and applied experimentally to a glass sheet by Sinha [11] in 2005, is used in this study to obtain a close approximation of the normal undamped mode shapes from the identified complex damped mode shapes. These are then compared to the model-estimated undamped mode shapes, removing the need for modelling complicated OWT damping.
The wind turbine model, modal identification, mode shape normalisation and model-updating methods are explained in Section 2 and the techniques are applied in Sections 3 and 4. The use of the mode shape normalisation technique is motivated and demonstrated through numerical modelling of the OWT, and the source of the nonproportional damping is explored. The OWT frequencies and tower mode shapes are then identified from the simulated data for a variety of cases with differing characteristics. The characteristics explored are the wind speed, the noise level in the simulated data and the foundation stiffness magnitude. The foundation parameters are then estimated using model updating in Section 4, followed by a discussion of the potential sources of error, the specific form of the foundation best suited for optimisation and the impact of the mode shape normalisation on the results.
2. Methodology
In this work, the OWT foundation stiffness and compliance properties are estimated from simulated data through a model updating process that compares the identified modal parameters from the data to the numerical modal parameters of the updated model. This is referred to as modal model updating. Particular attention is given to the effect of nonproportional damping on mode shapes, the process of finding damped and undamped mode shapes and techniques for their normalisation.
2.1. Model
The OWT has been modelled using FAST v7 [12]. FAST is a dynamic time-domain tool that simulates horizontal axis wind turbines under hydro and aerodynamic loading. This model is used in this study for the generation of the simulated data, for the calculation of numerical modal properties and as the model in the model updating procedure.
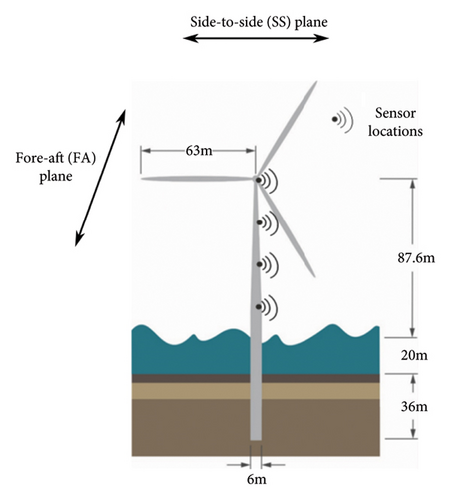
Version 7 of FAST is specifically used in this study due to the relatively versatile foundation modelling capability available at the time of conducting this research. The modelled structure is the 5 MW reference turbine [14], developed by the National Renewable Energy Laboratory (NREL), herein referred to as the NREL 5 MW. It is a conventional three-bladed upwind, variable-speed, blade-pitch-to-feather-controlled turbine with dimensions shown in Figure 1(a).
2.1.1. Foundation Modelling
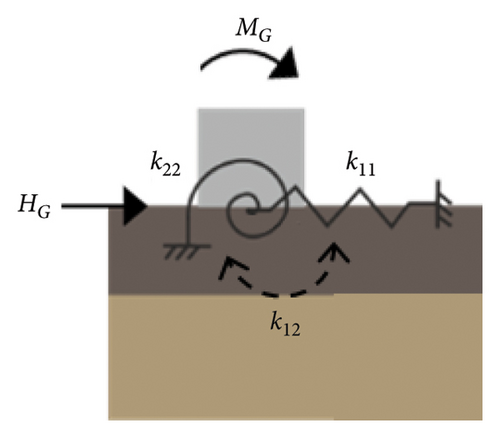
This coupled springs model is able to replicate the ground-level static behaviour of the embedded monopile under loading of any eccentricity, h. To ensure it is physically meaningful, the KF matrix must have a positive determinant, hence positive eigenvalues.
So, for a given set of coupled springs, k11, k12 and k22, a set of corresponding relationships governing kH and kM in terms of h can be calculated. These two sets are statically equivalent. Plotting these relationships (equations (5) and (6)) provides a convenient way to compare the behaviour of different foundation matrices [16], such as comparing the matrices estimated through model updating against the “true” numerical model foundation matrix. Figure 2 gives an indicative representation of these relationships with varying h.
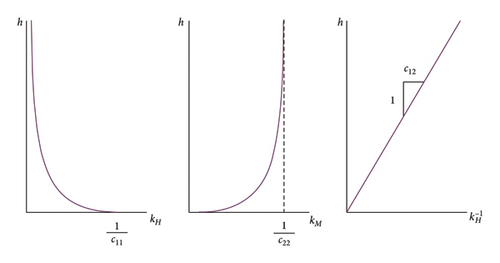
Each equivalent overall stiffness is only dependent on two coupled compliance terms, whereas they are dependent on all three coupled stiffness terms (equations (5) and (6)). It will be shown later in this paper that the compliance matrix terms are found to provide a better basis for comparison of the foundation behaviour than the stiffness matrix terms. This is potentially as a result of their simpler relation with kH and kM (equations (8) and (9)) and correspondence to salient points on the h − kH and h − kM curves, although this is not investigated further. Therefore, the aim of the model updating method is to estimate these three coupled spring compliances, c11, c12 and c22.
The OWT foundation in this study is modelled with this coupled springs macroelement, and the soil properties are assumed to be axisymmetric about the vertical axis. As a consequence, the stiffness matrix defined in equation (4) is applicable individually in the fore-aft (FA) and side-to-side (SS) planes of motion. The FA and SS directions are depicted in Figure 1. There is no coupling of the foundation stiffness matrix between the DOF belonging to the FA and SS planes. KF captures the soil-structure interaction below the mudline, so in FAST, the structure is cut at the mudline and the monopile structural properties are only applied above the mudline.
2.1.2. Modelling Assumptions
- •
The blades have been modelled as rigid.
- •
The data have been simulated for parked conditions, i.e., with a stationary rotor, across a range of wind speeds with the blades pitched to 0°.
- •
The inertia of the rotor nacelle assembly (RNA) about the shaft axis has been increased by 1 × 10⁸ kgm2 ( ~ 250%) to increase the separation between the frequencies of the first two vibration modes.
The abovementioned simplifications have been introduced so that the effect of interest illustrated in this work, that of nonproportional damping (as discussed in Section 2.3), is isolated from other effects. The effects that are removed are the modal coupling between the blades and the tower, the presence of nonstationary and coloured excitations during turbine operation [18] and the existence of close modes [19]. Each of these effects introduces a complexity to the identification procedure that can be addressed with complementary approaches, see, e.g., [20]. While it is important to be aware of these effects, the alterations made to minimise their effects, though unrealistic, do not compromise the qualitative findings in this work related to nonproportional damping and model updating.
2.1.3. FAST Modal Reduction
FAST reduces the order of the wind turbine model with a modal reduction of its flexible substructures. The tower is modelled as one substructure element with four DOF, associated with the first four tower mode shapes. These substructure DOF are a required input of the FAST model. They cannot be calculated by FAST and so are typically calculated by the user using a simple finite element (FE) model of the wind turbine with Euler–Bernoulli elements for the tower, a rigid lumped mass representing the RNA and a coupled springs’ macroelement for the foundation. Axial and torsional DOF are not modelled. The mode shapes of this simple FE model, referred to herein as tower substructure mode shapes, are found through an eigenanalysis and then truncated to retain the first four mode shapes; the 1st and 2nd in the FA direction, and the 1st and 2nd in the SS direction. The corresponding DOF in the FAST model, qTFA1, qTFA2, qTSS1 and qTSS2, respectively, shown in Figure 3, are the variables that scale these substructure mode shapes over time. The substructure mode shapes are each approximated by a 6th order polynomial function of the position along the tower from the ground level towards the nacelle, with the 0th and 1st order terms set to zero. The sum of the polynomial coefficients must add to 1 to ensure the shape has a normalised deflection of 1 at the tower-top.
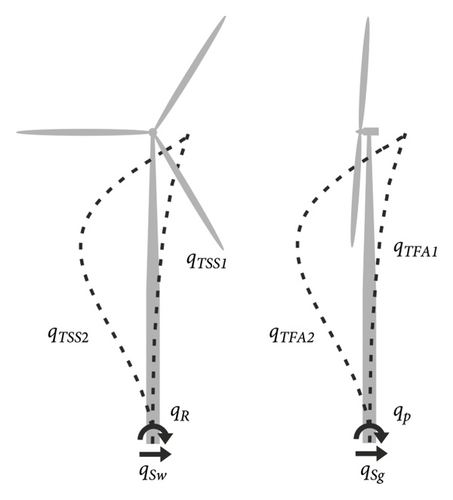
In addition to the four flexible substructure DOF, the FAST model has four DOF that correspond to the translation and rotation of the structure’s base with respect to the two horizontal axes. These are the surge, sway, pitch and roll DOF, as shown in Figure 3, denoted by qSg, qSw, qP and qR, respectively. FAST integrates the nonlinear equations of motion, as shown in equation (1), to determine the realisations of the DOF, q (consisting of the translations, rotations and substructure mode shape scalars), over time.
FAST has the capability to model further DOF for the RNA, for example, blade flexibility and yaw, but the model has been simplified for this study by assuming rigidity of these other DOF, resulting in a model with eight DOF, and, therefore, the structure has a total of eight modes. The first four modes of the structure (with the lowest four frequencies) are of interest and their general shape is shown in Figure 4. Though the blade flexibility is neglected, the typical shape and mass distribution of the blades is modelled in the version of FAST used in this study.
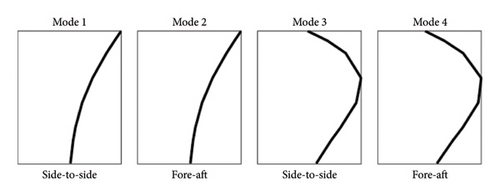
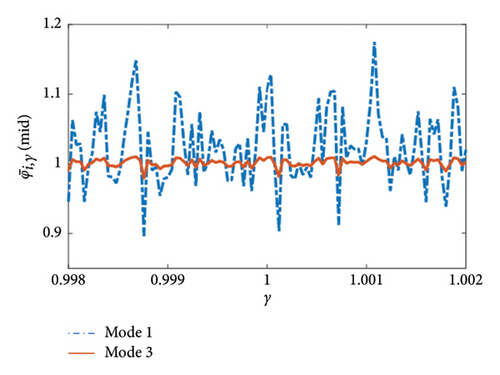
Figure 5 shows against γ for modes 1 and 3, for a narrow range of γ values around 1. It can be seen that there is a large variation in the values calculated using BModes, which is not expected for such small variations in the values of γ. Such numerical errors provide sufficient variability in the subsequent predicted dynamic behaviour to cause issues with the optimisation convergence during the model updating procedure described in Section 2.6. An equivalent in-house Euler–Bernoulli FE program described in [17], which does not suffer from the same inaccuracy with varied foundation stiffness, has, therefore, been used to generate these mode shapes in place of BModes.
2.2. Calculation of Modal Parameters
The values differ slightly but the discrepancy is negligible in all the examples studied in this work. The modes in this paper are sorted in ascending order of the values of the frequencies so that mode 1 refers to the mode with the lowest frequency, f1.
2.3. Nonproportional Damping
As stated in the introduction, to avoid having to model complicated forms of OWT damping, the model updating approach applied in this paper requires undamped identified mode shapes. These can be approximated through mode shape normalisation, as explained in this Section.
Exact proportional damping is rare in reality and typically systems are considered either “nearly” proportionally or nonproportionally damped. The distinction is made based on whether the damping matrix, D, is considered diagonally dominant [24]. If the off-diagonal terms are comparable to the diagonal terms in magnitude, then it is not diagonally dominant and, therefore, the system is considered nonproportionally damped.
It should also be noted that in the literature, the term “real normalisation” frequently refers to the process of deriving real-valued mode shapes from complex-valued mode shapes, so both normalisation techniques outlined above would be described using this umbrella term. However, in this paper, real normalisation refers to the process given by equation (27) and complex normalisation refers to the process given by equation (28).
In summary, when a system can be approximated as proportionally damped, both and provide good approximations of , but if the contributions of nonproportional damping cannot be ignored, only might serve as a good approximation. As a result, the similarity between and can be used as an indication of the presence of nonproportional damping in a system, as presented in Section 3.1.
The FAST wind turbine model predicts significant nonproportional damping as a result of aerodynamic rotor loading that causes the damped mode shapes, ϕd, to differ significantly from the undamped mode shapes, ϕu. The rotor aerofoils generate lift forces perpendicular to the direction of the blade resultant velocity. These velocity-dependent forces, which vary with changing wind speed, are a source of damping to the structure. This damping appears in the off-diagonal elements of the damping matrix due to the perpendicular nature of the force-velocity interaction, violating the condition of diagonal dominance. Therefore, the resulting damping matrix has significant contributions from nonproportional damping. The off-diagonal terms of the damping matrix can consequently couple the dynamic behaviour of the FA and SS directions of the tower motion.
Section 3.1 uses the OWT model to demonstrate the resulting relationship between the wind speed and the dynamic behaviour and the successful application of the complex normalisation technique to transform the complex-valued damped mode shapes to close approximations of the real-valued undamped mode shapes.
2.4. Model Linearisation and Modal Parameters
The modal parameters are then found using the equations described in Section 2.2. Whether the calculated parameters are damped or undamped will be specified with each investigation in Sections 3 and 4.
FAST also calculates the output matrix, E, which is used to transform the FAST DOF mode shapes into the sensor-based mode shapes (equations (21) and (22)).
2.5. Identification of Modal Parameters
While the A matrix assembled from the numerical matrices of the model (equation (18)) is in a physical basis, the basis of the identified matrix corresponds to some unknown transformation of the physical basis of the model. Therefore, it is not possible to extract information about the structural matrices directly from without further resolution of the unknown transformation. Instead, structural information is obtained through the model updating process, which compares the numerical model and identified modal parameters. To enable their comparison, both sets of mode shapes must be in the sensor basis.
2.6. Model Updating
fi(χ) and are the numerical model modal parameters realised for a specific χ following the procedures set out in Sections 2.2 and 2.4. are undamped mode shapes calculated using equation (15), transformed to the sensor basis with equation (22) and finally normalised with equation (26).
and are the identified modal parameters estimated using the procedures set out in Sections 2.2 and 2.5. are damped mode shapes calculated from using equation (19), then transformed to the sensor basis using equation (34) and finally complex normalised using equation (28).
The MATLAB fminsearch optimisation algorithm, which uses the Nelder–Mead simplex algorithm [27], is adopted to minimize the objective function of equation (35). This is an unconstrained nonlinear optimisation algorithm that finds the minimum of a multivariable function, starting from a user-specified initial estimate. The algorithm uses a derivative-free direct search method. Throughout the paper, the relative tolerances on the optimisation current point and function value, “tolX” and “tolFun,” are 1 × 10⁻⁶.
The model used in this study is unbiased, as the same model is used for simulating the data and the model updating procedure, so the effect of modelling errors is removed. In practice, field monitoring data would be generated by other processes that are not exactly captured by the model used for the updating. For identification using field data, the model must be a reasonable and unbiased approximation of the physical process that generated the data. For a discussion on the effects of a potential bias in the model, the reader is pointed to Song’s works [28].
3. Exploring Modal Behaviour
| Inertia, I, term | Reference NREL 5 MW (kgm2) | Modified (kgm2) |
|---|---|---|
| IFA−FA | 3.9e7 | 1.4e8 |
| ISS−SS | 2.3e7 | 2.3e7 |
| Izz | 2.5e7 | 2.5e7 |
| IFA−z | −1.3e6 | −1.0e7 |
To identify the foundation stiffness using modal data, it is necessary that the modal parameters are sensitive to the foundation stiffness. Table 2 shows this to be true for this application, by comparing the frequencies of the OWT model with a flexible foundation (equal to KF0) against those with a fixed base foundation. There is at least an 11% difference between the corresponding frequencies.
| Mode, i | Fixed foundation fi (Hz) | Flexible foundation fi (Hz) |
|---|---|---|
| 1 | 0.264 | 0.234 |
| 2 | 0.277 | 0.242 |
| 3 | 1.049 | 0.919 |
| 4 | 1.855 | 1.343 |
In Section 3.1, the source of the nonproportional damping is investigated through forward modelling of the OWT model, with the original reference NREL 5 MW RNA inertia given in Table 1, at a variety of wind speeds.
In Section 3.2, the model, with the modified RNA inertia, is used to generate simulated data. The system identification method N4SID is then applied to these data to identify the modal parameters.
3.1. Investigation of Nonproportional Damping and Complex Normalisation
Nonproportional damping, as explained in Section 2.3, is explored in this paper by investigating the relationship between the speed of the wind excitation and the model mode shapes, using FAST. Section 2.3 explained that the real normalisation method will not successfully approximate the undamped mode shapes. However, it is used here to demonstrate the effect of the damping and the errors that could be introduced if the real normalisation were applied, a3s a consequence of assuming proportional damping.
The model was linearised at wind speeds ranging from 0 to 20 m/s, providing the system M, K, D and E matrices. The damped mode shapes, ψd, are then calculated by solving the eigenvalue problem given by equation (19), then transformed to the sensor basis using equation (21) and real normalised using equation (27) to give . The undamped mode shapes, ϕu, are calculated by solving the eigenvalue problem given by equation (15), transformed to the sensor basis using equation (22) and finally normalised using equation (26) to give .
Figure 6 shows a plan view of the resulting undamped, , and damped, , sensor-based mode shapes at a variety of wind speeds. The figure demonstrates that the inclusion of damping results in mode shapes whose components are not purely in either of the FA or SS directions but have elements of comparable magnitude in both principle directions.
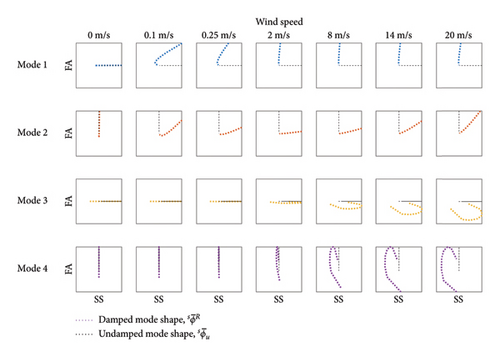
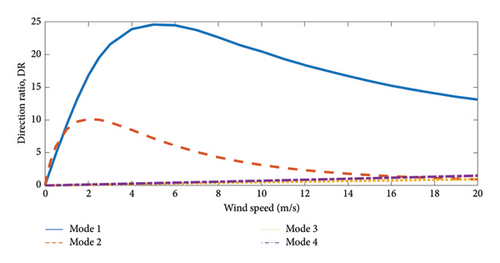
Figure 7 shows the relationship between DR and the wind speed for each vibration mode. It can be seen in both Figures 6 and 7 that at zero wind speed, present as entirely SS or FA, in agreement with , but even at very low wind speeds, for example, 0.25m/s, modes 1 and 2 appear to vibrate in the planes perpendicular to the respective planes of vibration for the undamped structure. Similar effects on the higher modes appear at higher wind speeds.
This result shows that if one were to assume nearly proportional damping, expecting the arising mode shapes to be independent of damping and hence use the real normalisation procedure, one could be misled as to the true nature of the mode, disregard the data as erroneous or seek to tune the model to correct the perceived “discrepancy.”
In order to match the predicted and measured behaviour during model updating, the model would need to be capable of accurately predicting . This would require an accurate representation of the aerodynamics and wind conditions during the monitoring period, in order to replicate the structure’s damping matrix very closely, with an emphasis on the non-diagonal elements that result in the nonproportional behaviour. Hence, it would be highly challenging for models without close representation of the blades to be able to predict SS and FA modes that accurately matched those observed. This is a common problem for offshore wind support structure designers since the detailed rotor properties are often commercially confidential.
Modelling damping can be very difficult [30] and in practice typical aerodynamic rotor models are unlikely to capture the aerodynamic damping with sufficient fidelity across all operational conditions. Furthermore, accurate modal identification of damping is also challenging [31]. Therefore, it would be highly beneficial to identify the undamped mode shapes of a structure directly and compare them to an undamped model.
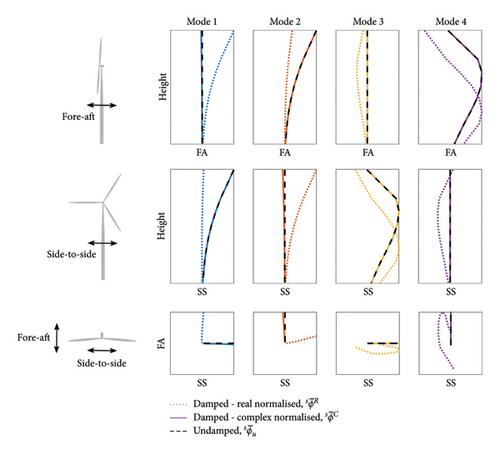
Normalising the mode shapes with the complex normalisation technique to give (using equation (28)) and comparing with the previously calculated allows the comparison of the two normalisation techniques. Figure 8 compares these mode shapes with the corresponding undamped mode shapes at a wind speed of 8m/s. The close match seen between and demonstrates that the complex normalisation procedure provides mode shapes that are close approximations of the undamped mode shapes.
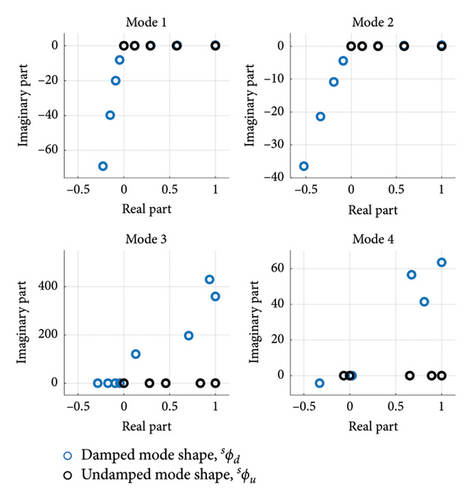
Applicability conditions for the complex normalisation technique have not been investigated in this study, for example, regarding the form and extent of the nonproportional damping and subsequent mode shape complexity. However, for reference, the extent of the mode shape complexity for this successful application of the technique is demonstrated in Figure 9. Figure 9 shows the damped and undamped mode shapes, sϕd and sϕu , in the complex plane. The mode shapes are presented prior to the real/complex normalisation step since the complex-valued damped mode shapes are of interest. However, they are scaled such that the largest real component is equal to 1. The figure shows that the damped mode shapes exhibit significant complexity.
It is acknowledged that the nonproportional damping predicted in this paper will be subject to modelling inaccuracies, but this finding demonstrates how susceptible a wind turbine’s dynamic properties are to aerodynamic damping. Thus, estimation of the undamped mode shapes, using a technique such as the complex normalisation method, may provide valuable information when using these mode shapes for subsequent applications, such as model updating.
3.2. Identification of Modal Parameters
The wind turbine model was used to generate simulated data for the seven parameter cases shown in Table 3.
| Case | Wind speed (m/s) | Noise level (%) | Foundation |
|---|---|---|---|
| 1 | 12 | 0.1 | KF0, CF0 |
| 2 | 12 | 1 | KF0, CF0 |
| 3 | 12 | 5 | KF0, CF0 |
| 4 | 3 | 1 | KF0, CF0 |
| 5 | 25 | 1 | KF0, CF0 |
| 6 | 12 | 1 | 0.5KF0, 2CF0 |
| 7 | 12 | 1 | 2KF0, 0.5CF0 |
The synthetic wind data were generated with a stochastic turbulent wind simulator, TurbSim [32], using the International Electrotechnical Commission Kaimal Model [33] with wind turbulence characteristic “B” and mean wind speed as given in Table 3. All cases were simulated with stationary water.
The system identification method N4SID was applied to the simulated output data, yk, for the seven parameter cases. The input data, uk, are not used and are considered as unmeasured since it is not practical to measure these in reality. Therefore, N4SID calculates estimates of and of the discrete system, given in equation (32), for a specified system order. The order of a system is twice the number of DOF, which for the numerical model that generated these output data is 8. However, an order much higher than 16 is needed to identify the system, with the extra modes corresponding to modelling of the noise terms, due to uk not being provided to N4SID.
The equivalent continuous system is calculated using equation (33), followed by subsequent solution of the eigenvalue problem (equation (19)) to give the identified modal parameters and . are then transformed to the sensor basis (equation (34)) and either real (equation (27)) or complex (equation (28)) normalised to give or , respectively. Finally, and are calculated from with equations (23) and (24).
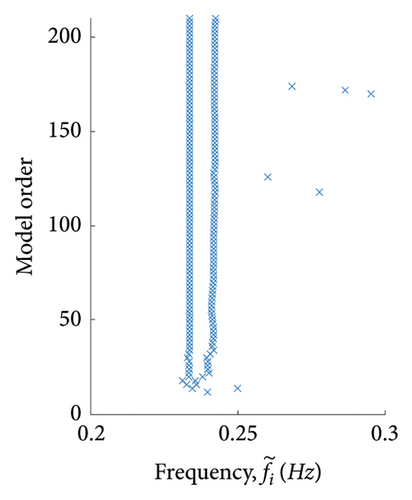
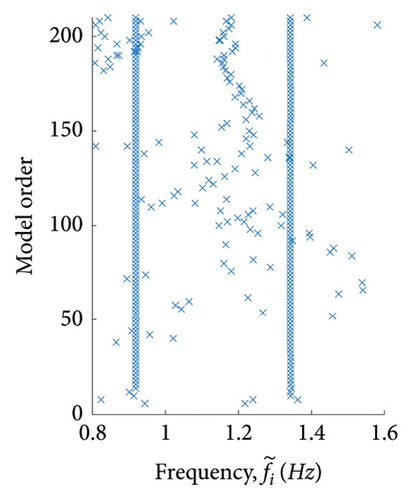
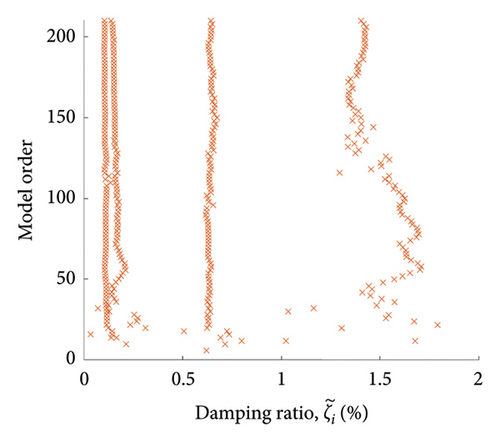
The order of the system was gradually increased in increments of 2 to achieve stabilisation. An example stabilisation diagram is shown in Figure 10 for parameter Case 2 (outlined in Table 3). In this paper, stabilisation is deemed to be achieved at an order when the identified frequencies and damping ratios appear to be practically invariant as the model order is increased. A model order of 200 was used across all cases.
Tables 4–6 compare the identified modal parameters with the model modal parameters for the seven cases. The identified complex normalised mode shapes, , are compared to the model undamped mode shapes, , using the MAC (equation (36)).
| Mode, i | fi(Hz) | ||||||
|---|---|---|---|---|---|---|---|
| η = 0.1% | η = 1% | η = 5% | η = 0.1% | η = 1% | η = 5% | ||
| 1 | 0.234 | 0.234 (−0.009%) | 0.234 (−0.006%) | 0.234 (−0.005%) | 1.000 | 1.000 | 1.000 |
| 2 | 0.242 | 0.242 (−0.086%) | 0.242 (−0.065%) | 0.242 (−0.008%) | 1.000 | 1.000 | 1.000 |
| 3 | 0.919 | 0.919 (−0.016%) | 0.919 (−0.015%) | 0.919 (−0.014%) | 1.000 | 1.000 | 1.000 |
| 4 | 1.343 | 1.341 (−0.14%) | 1.342 (−0.099%) | 1.342 (−0.096%) | 1.000 | 1.000 | 1.000 |
- Note: (% error) shown in brackets.
| Mode, i | fi (Hz) | ||||||
|---|---|---|---|---|---|---|---|
| 3m/s | 12m/s | 25m/s | 3m/s | 12m/s | 25m/s | ||
| 1 | 0.234 | 0.234 (−0.018%) | 0.234 (−0.006%) | 0.234 (0.014%) | 0.995 | 1.000 | 0.988 |
| 2 | 0.242 | 0.242 (−0.087%) | 0.242 (−0.065%) | 0.242 (−0.15%) | 1.000 | 1.000 | 0.999 |
| 3 | 0.919 | 0.919 (0.011%) | 0.919 (−0.015%) | 0.920 (0.043%) | 1.000 | 1.000 | 1.000 |
| 4 | 1.343 | 1.340 (−0.024%) | 1.342 (−0.099%) | 1.343 (−0.063%) | 1.000 | 1.000 | 1.000 |
- Note: (% error) shown in brackets.
| Mode, i | fi(Hz) | ||||||||
|---|---|---|---|---|---|---|---|---|---|
| 0.5KF0 | KF0 | 2KF0 | 0.5KF0 | KF0 | 2KF0 | 0.5KF0 | KF0 | 2KF0 | |
| 1 | 0.211 | 0.234 | 0.248 | 0.211 (0.032%) | 0.234 (−0.006%) | 0.248 (0.059%) | 0.972 | 1.000 | 0.954 |
| 2 | 0.217 | 0.242 | 0.258 | 0.216 (−0.26%) | 0.242 (−0.065%) | 0.258 (0.002%) | 1.000 | 1.000 | 1.000 |
| 3 | 0.841 | 0.919 | 0.977 | 0.842 (0.049%) | 0.919 (−0.015%) | 0.977 (0.039%) | 1.000 | 1.000 | 1.000 |
| 4 | 1.144 | 1.343 | 1.543 | 1.139 (−0.44%) | 1.342 (−0.099%) | 1.544 (0.13%) | 1.000 | 1.000 | 1.000 |
- Note: (% error) shown in brackets.
Table 4 compares the effect of the noise level (Cases 1–3). There is a slight positive correlation between the noise level and the overall match between the identified and model parameters, but in general, there is very little difference, which suggests that, up to a reasonable limit, the quality of the sensor does not have a significant influence.
Table 5 compares the effect of the wind speed, showing the results for Cases 2, 4 and 5. The parameter space was chosen to span from the OWT cut-in to cut-out wind speeds, 3m/s and 25m/s, respectively, to cover a wide range of typical conditions. There are only small differences between the parameters identified at each wind speed, which indicates that a preference towards using data measured at a particular wind speed is not necessary.
Table 6 compares the effect of the foundation stiffness, using Cases 2, 6 and 7. Once again, the identification errors are small and vary slightly but with no significant trend over the examined range of stiffnesses.
The impact of the modal identification errors on the foundation identification will be investigated in Section 4.2.
Looking across all the results, although is generally the most accurately identified frequency, is the least accurately identified mode shape. The SS mode frequencies ( and ) are consistently identified with greater accuracy than the FA ( and ). The damping ratios are poorly identified, which is not uncommon for output only identification methods [31], so damping is not adopted for optimisation during the model updating method.
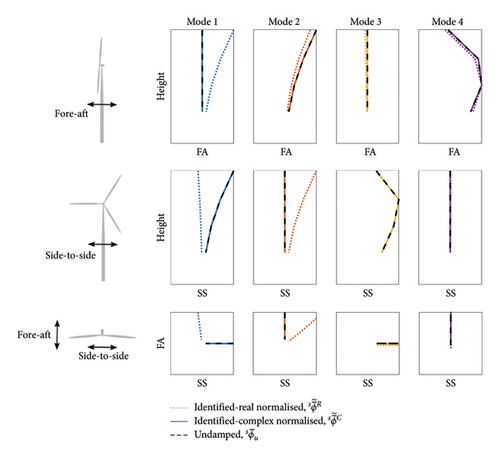
Figure 11 compares both identified and against the model to show the difference between the identified mode shapes processed with the real and complex normalisation techniques for Case 1. The corresponding MAC values are given in Table 7.
| Mode, i | ||
|---|---|---|
| 1 | 1.0000 | 0.0164 |
| 2 | 0.9999 | 0.3802 |
| 3 | 1.0000 | 0.9954 |
| 4 | 1.0000 | 0.9890 |
Figure 11 highlights the importance of the complex normalisation procedure if an accurate estimate of the undamped model mode shapes, , is desired. In general, there is very good agreement between and , as reflected in the MAC values given in Table 7. Furthermore, it can be seen in Figure 11 that the discrepancy between and is significant. Consideration of alone may lead to the erroneous assumption that the first vibration mode is a FA mode, and perhaps consequently that the second vibration mode is a SS mode. The potential impact on the foundation identification of those erroneous, yet phenomenologically reasonable (based on ) conclusions, is investigated in Section 4.1 for this specific case (Case 1).
4. Application to Model Updating
This section focuses on the application to model updating, using the modal parameters identified in Section 3.2.
Section 4.1 details the foundation identification procedure for a specific case at a wind speed of 12m/s. The form of the foundation properties best suited for optimisation and comparison is explored and the impact of normalising the mode shapes using the “real” and “complex” techniques is compared.
Section 4.2 explores the potential sources of errors in the foundation identification results and compares the effect of wind speed, foundation stiffness and the data signal-to-noise ratio on the foundation identification.
4.1. Foundation Identification: Case 1
This section details the foundation identification model updating procedure for Case 1. Case 1 consists of simulated data that have been contaminated with 0.1% white noise (equation (41)) for a wind turbine with the baseline foundation stiffness, KF0, at a wind speed of 12m/s, as shown in Table 3.
4.1.1. Identifying Compliance Versus Stiffness Terms
The identified modal parameters ( and ) for Case 1, which were presented in Section 3.2 (Table 4 and Figure 11), are used to identify the foundation properties with the objective function given in equation (35). Both the stiffness properties and the compliance properties are trialled as the optimisation parameters to compare their suitability.
Table 8 shows the identified and matrices, with an initial estimate of 2KF0 (or equivalently stated 0.5CF0). ϵK and ϵC are the corresponding percentage errors, with respect to the true values, KF0 and CF0.
| Case | ϵK(%) | ϵC(%) | ||
|---|---|---|---|---|
| 1 |
First, focussing on , the model updating process shows good performance in reducing the error in the terms of the compliance matrix, ϵC, from the initial estimate at 50% of the true values. To give some context to these residual errors, ϵC, when calculating the foundation macroelement parameters equivalent to a given set of soil profile parameters, it is not uncommon to see differences on the order of 100% between different methods [17]. Two common methods for this calculation are the p − y method [34, 35] and the PISA method [36]. Focussing on in Table 8, the errors, ϵK, are much larger and would not suggest that the foundation properties have been identified well on first inspection.
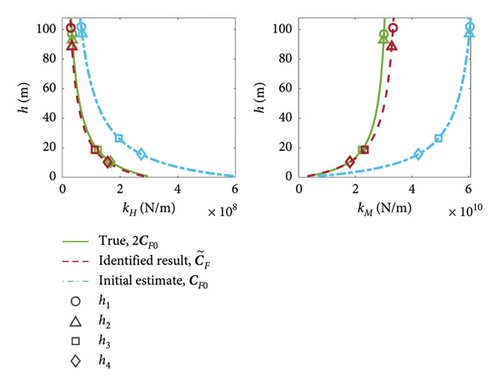
As discussed in Section 2.6, plotting the h − kH and h − kM relationships given in equations (5) and (6)) provides an effective way to compare the behaviour of the model and the identified foundations. Figure 12 shows these relationships for the identified foundation for Case 1, comparing the true values calculated with KF0 (solid green line) against the identified values calculated with (dashed red line) and (dotted black line), and the initial estimate values (dash-dot blue line) calculated with 2KF0(0.5CF0).
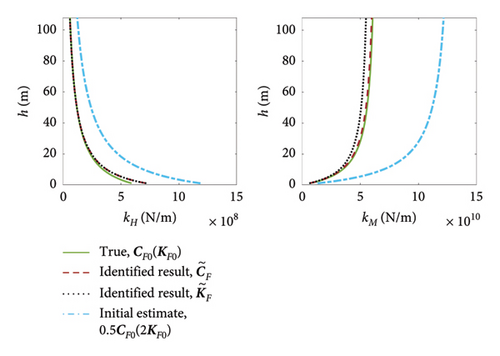
The close match between the green, red and black lines in the figure shows that the foundation behaviour is identified well, regardless of the significant apparent errors in the individual values of shown in Table 8. This demonstrates that, while using either KF or CF as the optimisation parameters leads to a good identification of the effective stiffness response (shown with Figure 12), analysing the errors, ϵK, in the individual terms of the coupled stiffness matrix KF alone would likely lead to the conclusion of a poor identification. This suggests that the individual terms of KF do not form a good basis for comparison of the foundation behaviour, as matrices with very different values can represent foundations with very similar behaviour.
Furthermore, Table 9 shows and , which are calculated by inverting the identified matrices and , respectively, of Table 8, and the associated errors, and found when comparing these to the true values, CF0 and KF0. Despite the large errors in the terms of , inverting the matrix to results in a good approximation of the true foundation compliances (as shown with ). In addition, inverting results in stiffnesses, , that have even larger errors than those of (Table 8). This provides further evidence that in the case of identifying the stiffnesses, the problem is not a poorly performing optimisation but a poor basis for comparison.
| Case | ||||
|---|---|---|---|---|
| 1 |
The compliances that are optimised directly, , have smaller errors than those inverted from the identified stiffnesses, . It is, therefore, reasonable to conclude that the compliances are better conditioned for optimisation, as well as clearly giving a better basis for comparison with the true foundation properties. A possible explanation is because the form of the compliance matrix gives a more direct representation of the foundation behaviour, as the CF terms correspond to physical aspects of the h − kH and h − kM relationships, as shown in Figure 2 in Section 2.1.1. In addition, equations (5) and (6) demonstrated that the stiffnesses, kH and kM, are dependent on all three coupled stiffness terms, whereas equations (8) and (9) showed that they are each only dependent on two of the coupled compliance terms.
are dependent on the CF terms as well as the error terms, ϵC, and it can be seen that a particular combination of CF and ϵC could cause the denominator to be equal to zero. This would result in a singularity and cause to be equal to infinity. This is represented graphically in Figure 13, which shows the relationships between the error terms, and ϵC, given compliance terms equal to CF0.
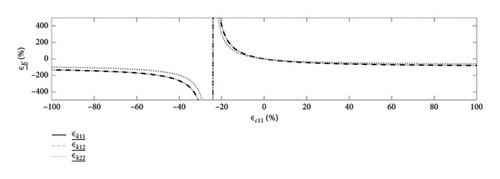
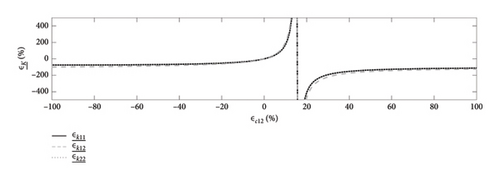
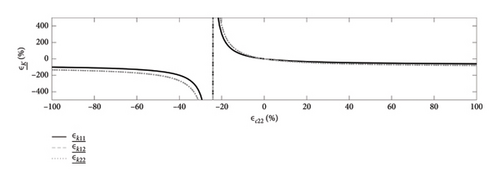
In Figures 13(a), 13(b) and 13(c), the terms ϵc11, ϵc12 and ϵc22 are varied, respectively, between −100% and 100% (with the remaining two ϵc terms in each case equal to zero). The resulting terms are plotted on the y-axis. The figure shows that some combinations of the ϵC terms cause the terms to tend toward infinity. For the particular case investigated in this section, Case 1, the specific combination of CF0 and ϵC terms happens to result in this asymptotic behaviour, causing the large errors in presented in Table 9.
Finally, Table 10 compares the calculated modal parameters of the true model, with foundation KF0, against those calculated when the model foundation stiffness is . The two sets of frequencies differ by a maximum of 0.3% and the MAC between the two sets of mode shapes is 1 for each mode, rounded to five significant figures, indicating almost exact correlation. These results demonstrate further evidence that the dynamic behaviour has been well identified, despite the large apparent errors in .
| Mode, i | fi (KF0) (Hz) | (KF0), | |
|---|---|---|---|
| 1 | 0.234 | 0.233 (−0.27%) | 1.0000 |
| 2 | 0.242 | 0.242 (−0.21%) | 1.0000 |
| 3 | 0.919 | 0.918 (−0.13%) | 1.0000 |
| 4 | 1.343 | 1.346 (0.19%) | 1.0000 |
- Note: (% error) shown in brackets.
In summary, this work leads to the conclusion that the compliance terms of a coupled springs foundation matrix provide a better measure for comparison, rather than the stiffness terms, to enable analysis of the true foundation behaviour. Hence, the foundation identification results presented hereafter will compare CF and the h − kH and h − kM relationships.
4.1.2. Model Updating Using Real Versus Complex Normalised Mode Shapes
As shown in Figure 11, consideration of the real normalised mode shapes, , alone would suggest that the 1st vibration mode is a FA mode, and perhaps consequently that the second vibration mode is a SS mode. However, the undamped mode shapes, , demonstrate that the vibration modes are in fact ordered SS and FA respectively. The influence on the accuracy of the identified foundation parameters, through adoption of these two sets of mode shapes in the model updating objective function, is explored in this section.
The model updating method compares the mode shapes and frequencies of the SS modes and the FA modes separately; the mode direction for each identified mode is assumed to be specified by the user. So, when considering alone, the 1st identified mode appears to vibrate in the FA direction and is therefore paired with the 2nd model mode, which also vibrates in the FA direction, resulting in an objective function that compares to f2 (and to f1 applying the same logic to the 2nd identified mode). However, consideration of results in an objective function that compares the compatible modes, as the predicted vibration directions of the complex normalised damped mode shapes match those of the undamped model mode shapes.
Table 11 compares the identified foundation compliance matrices, , when model updating of Case 1 adopts either or when formulating the objective function. ϵC gives the percentage errors compared to CF0 and J gives the final objective function value. Figure 14 shows the corresponding identified foundation behaviour by plotting the equivalent h − kH and h − kM relationships.
| Case | Normalisation technique | ϵC(%) | J | |
|---|---|---|---|---|
| 1 | Complex | 3.5 × 10⁻⁶ | ||
| 1 | Real | 2.02 |

Adopting the real normalised mode shapes, , to formulate the model updating objective function for estimating the foundation compliance matrix, , results in significant overestimation of the magnitude of the true values (Table 11). This corresponds to a very low stiffness, as seen in the plots of h versus kH and kM in Figure 14 with the black dotted lines. Figure 14 shows that using in the model updating procedure leads to a poor foundation estimate that would not represent the true foundation behaviour. The final value of J for the real normalisation case, found in Table 11, shows that the objective function has not been well satisfied, indicating that the form of the objective function is poor. As explained above, consideration of results in the objective function comparing incompatible mode frequencies, i.e., to f2 and to f1. The optimisation process appears to try to accommodate this switch in order of occurrence between the first FA and SS modes with substantially larger soil compliances. However, the user may reasonably assume that the high objective function value be a result of modal identification errors or modelling error. Unfortunately, there would be no clear way for the user to know from interpreting the results that the real normalised mode shapes are resulting in a badly chosen objective function that is leading to large errors in the identified foundation parameters.
4.2. Foundation Identification: All Cases
This section explores the foundation identification across all cases presented in Table 3, looking at the effects of the wind speed, noise level, foundation stiffness magnitude and initial estimate on the results. This investigation aims to test the feasibility and reliability of the model updating method across a range of realistic conditions.
4.2.1. Sensitivity to Initial Estimate
The sensitivity of the foundation identification to the initial estimate of CF is investigated for Case 2. Case 2 consists of simulated data that have been contaminated with 1% white noise (equation (41)) for a wind turbine with the baseline foundation stiffness, KF0, at a wind speed of 12 m/s, as shown in Table 3. Four model updating tests of case 2, with different initial estimates corresponding to 0.25CF0, 0.5CF0, 2CF0 and 4CF0, yielded results of where individual parameters differed by a maximum of 0.004%. This indicates a very low sensitivity to the initial estimate within the examined region from 0.25CF0 to 4CF0. Note that a constraint exists on the initial estimate of the parameters; the determinant of the corresponding stiffness matrix, KF, must be positive.
The foundation identification results presented hereafter are optimised with an initial estimate corresponding to half the true foundation compliance matrix (or equivalently stated, double the true stiffness matrix) of the model for that particular case. For Cases 1–5 this corresponds to an initial estimate of 0.5CF0, but for Cases 6–7, which have different true foundation compliances, the initial estimates are CF0 and 0.25CF0, respectively.
4.2.2. Exploring Sources of Foundation Identification Errors
This section explores the matrices and corresponding errors, ϵC, that result from applying the foundation identification model updating approach to the identified modal parameters given in Section 3.2, for parameter Cases 1 to 5, shown in Table 3.
Table 12 shows the results for Cases 2, 4 and 5 which are the different wind speed cases with η = 1% and foundation KF0. These cases highlight that the foundation behaviour can be identified well at a variety of wind speeds. This also results in excellent fidelity of the profiles of equivalent lateral and rotational stiffness, which are not presented for brevity.
| Case | Wind speed (m/s) | ϵC (%) | |
|---|---|---|---|
| 4 | 3 | ||
| 2 | 12 | ||
| 5 | 25 |
Table 13 shows the results for Cases 1–3, which are the different noise level cases at a wind speed of 12 m/s with foundation KF0. In Section 3.2, Table 4 shows marginally larger errors in the modal parameters identified from data with lower noise level. The results in Table 13 reflect this trend with the identification, but the opposite trend is seen with the errors in the other compliance parameters, i.e., larger errors are seen at higher noise levels.
| Case | Noise level, η | ϵC(%) | |
|---|---|---|---|
| 1 | 0.1% | ||
| 2 | 1% | ||
| 3 | 5% |
Generally, larger errors in the identified modal parameters appear to result in larger ϵC, as expected. However, noting that the foundation parameters are coupled, resulting in a nonlinear optimisation problem, certain modal parameters are likely to have higher implicit influence on the identified foundation parameters. Nelson’s adjoint method [37], for example, could be used in such investigations into the relative parameter sensitivities, but this is not applied here.
Comparing the magnitude of the modal parameter errors in Tables 4 and 5(<0.2%) to the foundation parameter errors in Tables 12 and 13 (2–20%) highlights the degree of sensitivity of the foundation predictions to the modal parameter errors. The likely explanation is that during the minimisation of the objective function, the objective function gradient with respect to the foundation parameters is low, so small modal parameter errors result in significantly magnified foundation compliance errors, ϵC.
4.2.3. Sensitivity of Foundation Compliance Errors to Modal Parameter Errors and Underlying Foundation Properties
This process was performed for Cases 6, 2 and 7 and termed soft, medium and stiff, respectively. In Figure 15, the normalised compliance parameter, , and , is plotted against the value of the pseudo-objective function, . The normalised compliance parameters act as a proxy for the expected errors in the estimated compliance parameters, , and . The value of acts as a proxy for the combined error in the identified modal parameters. For context, the identified modal parameters for Cases 1–7, shown in Tables 4, 5, and 6, result in equivalently calculated pseudo-objective function values between 0.0001 and 0.046. Overall, an approximate expected sensitivity of the errors in , and to the combined errors in the identified modal parameters, and , is reflected in the gradients of the lines in Figure 15, with steeper meaning more sensitive.

Analysis of the gradients of the lines in Figure 15 indicates that the stiffer the underlying foundation, the higher the sensitivity to modal parameter errors and, therefore, higher errors are expected in the identified foundation parameters, . This trend is seen to a certain extent in the results for Cases 2, 6 and 7, shown in Table 14, although the partially random nature of the modal identification makes it difficult to draw conclusions from individual cases.
| Case | Foundation | ϵC(%) | |
|---|---|---|---|
| 6 | 0.5KF0, 2CF0 | ||
| 2 | KF0, CF0 | ||
| 7 | 2KF0, 0.5CF0 |
- (a)
Case 6: 2CF0, 0.5KF0
- (b)
Case 2: CF0, KF0
- (c)
Case 7: 0.5CF02KF0
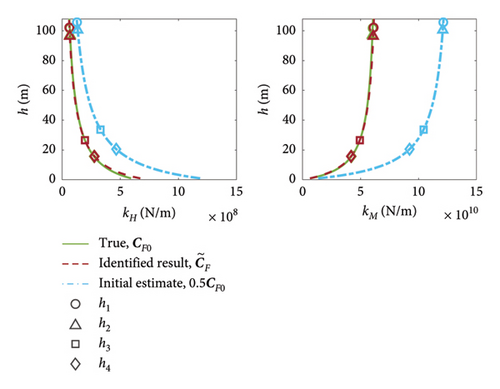
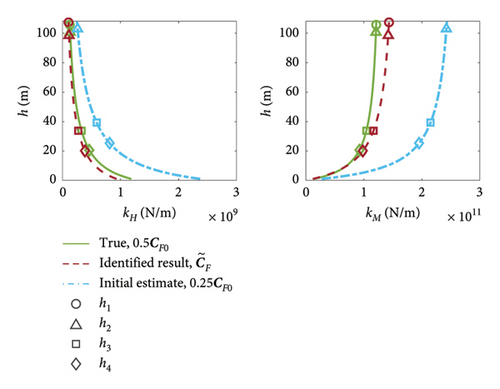
As shown by equation (10) in Section 2.1.1, for the ith vibration mode, an effective load eccentricity, hi, can be calculated from the KF (or CF) terms and the ground-level lateral and rotational displacements of the ith mode shape, vG,i and θG,i, respectively. These mode shape displacements are found using the FAST model realised with the foundation parameters of interest, e.g., . The calculated hi are shown in Figure 16 with markers. The modal properties at these effective load eccentricities are both the data available for model updating and the critical measures of performance required in order to match the model and observed behaviour. Figure 16 indicates that stiffer foundations present modes with higher effective load eccentricities. For Case 2, h varies from approximately 18 m for mode 4 to 108 m for Mode 1. This sparsity of data at low values of h results in greater uncertainty for the foundation parameters in this region. As a result, , which relates to the x-intercept on the kH plot (see Figure 2), is the least well identified compliance parameter. Conversely, there is a relatively large amount of information at high h, hence why , which relates to the vertical asymptote on the kM plot, is generally the best identified parameter across all seven parameter cases. This agrees with the predictions found with the error sensitivity analysis shown in Figure 15.
Higher order vibration modes result in lower h, so the estimated h − kH and h − kM relationships at low values of h would likely be improved by the inclusion of higher order tower substructure modes, resulting in a higher order model. However, the frequencies of these higher order modes are significantly greater than the typical frequencies of the sources of input excitation for OWT (wind, wave and rotor excitations). These higher order modes are, therefore, less likely to be excited by the inputs, thus have a smaller contribution to the overall OWT dynamic behaviour and are consequently of less interest from a design perspective. In addition, the lack of excitation of these modes may result in them being more difficult to identify in practice. By accurately capturing the foundation and modal behaviour at load eccentricities, h, relevant to the lower frequency modes, as in this study, the model updating process delivers a set of foundation parameters that will allow accurate modelling of the most critical structural dynamic behaviour and provide an appropriate basis for comparison with design models.
5. Conclusion
This work demonstrates that OWT structures exhibit significant nonproportional aerodynamic damping. A method, termed “complex normalisation,” is shown to successfully approximate the undamped mode shapes of the OWT model when applied to the damped mode shapes. By applying this complex normalisation to sensor-identified mode shapes, model updating can be performed accurately for this example using an undamped model, thus removing the need for high fidelity modelling of the physical sources of damping. In contrast, it was shown that the commonly applied technique of normalising the modes using their real part alone can lead to erroneous conclusions under the presence of nonproportional damping. The example studied showed how the user could incorrectly classify a mode’s plane of vibration. Further investigation demonstrated how this can result in erroneous conclusions about the foundation properties.
Four model frequencies and undamped mode shapes are identified well from simulated data under various conditions with the subspace state-space system identification method N4SID.
It was found that for a ground-level coupled springs foundation model, the terms of the compliance matrix are better conditioned for optimisation and for the comparison of different foundations than the stiffness terms. The effective lateral and rotational stiffnesses, which govern the foundation behaviour for a given set of loads, are more simply represented by the compliance terms than the stiffness terms. For the identification or comparison of such a foundation model, it is recommended that the compliance terms are adopted.
Based on simulated data for a variety of wind speed conditions and synthetic noise levels, the model updating approach performs well in identifying the foundation behaviour, through identification of the compliance terms. This is shown for three cases of an OWT model with different foundations of varying levels of compliance. It was demonstrated that the model updated foundation parameters are sensitive to the modal identification errors, owing to the shallow gradient of the objective function with respect to the foundation compliance parameters.
The four vibration modes used in this study, which are those typically primarily considered for the design of a wind turbine, have effective load eccentricities between approximately 18 and 108 m. The identified foundation compliance parameters are shown to accurately replicate the behaviour of the true foundation parameters in this range and, therefore, provide an effective basis for accurate modelling of the typically critical structural behaviour and comparison of the identified foundation with design models.
The problem of nonproportional damping, such as that arising from wind turbine rotor aerodynamics, is expected to persistently affect the majority of investigations related to such structures. The procedure used here for the normalisation of mode shapes can be paired with other methods for tackling complementary issues such as the problematic effects arising from closely spaced modes, operational conditions and blade flexibility. Future publications will investigate those complementary issues.
Conflicts of Interest
The authors declare no conflicts of interest.
Funding
This work was supported by grant EP/L016303/1 for Cranfield University, the University of Oxford and Strathclyde University, Centre for Doctoral Training in Renewable Energy Marine Structures from the UK Engineering and Physical Sciences Research Council (EPSRC).
Open Research
Data Availability Statement
All data used in this paper were simulated using FAST v7 with the NREL 5 MW Reference Turbine, with some amendments as described herein. The data are available from the corresponding author upon reasonable request.


