Vision-Aided Damage Detection With Convolutional Multihead Self-Attention Neural Network: A Novel Framework for Damage Information Extraction and Fusion
Abstract
The current application of vibration-based damage detection is constrained by the low spatial resolution of signals obtained from contact sensors and an overreliance on hand-engineered damage indices. In this paper, we propose a novel vision-aided framework featuring convolutional multihead self-attention neural network (CMSNN) to deal with damage detection tasks. To meet the requirement of spatially intensive measurements, a computer vision algorithm called optical flow estimation is employed to provide informative enough mode shapes. As a downstream process, a CMSNN model is designed to autonomously learn high-level damage representations from noisy mode shapes without any manual feature design. In contrast to the conventional approach of solely stacking convolutional layers, the model is enhanced by combining a convolutional neural network (CNN)–based multiscale information extraction module with an attention-based information fusion module. During the training process, various scenarios are considered, including measurement noise, data missing, multiple damages, and undamaged samples. Moreover, the parameter transfer strategy is introduced to enhance the universality of the application. The performance of the proposed framework is extensively verified via datasets based on numerical simulations and two laboratory measurements. The results demonstrate that the proposed framework can provide reliable damage detection results even when the input data are corrupted by noise or incomplete.
1. Introduction
Engineering structures are susceptible to various levels of damage due to harsh environments and complex loads [1, 2]. To guarantee the integrity and safety of structures, studies on structural health monitoring (SHM) have been pursued. In the field of SHM, vibration signals are frequently used to assess structural conditions [3]. Several vibration-based methods are developed to detect damage, such as those based on frequency response function [4–6], modal damping [7–9], characteristic frequency [10–12], and mode shape [13–16]. Among these methods, mode shape-based methods are well suited to the task of detecting damage, leveraging their comprehensive spatial dynamic information.
Accurate mode shape measurement is vital for mode shape-based damage detection, as it directly influences the precision of damage localization. Currently, mode shape acquisition methods fall into two broad categories: contact and noncontact techniques. Contact methods based on contact sensors are the most adopted [17–19]. However, contact methods inevitably induce mass-loading effects and offer only sparse and discrete monitoring points, resulting in low spatial measurement resolution [20, 21]. This is typically insufficient for mode shape-based damage detection. Noncontact methods, such as scanning laser vibrometer (SLV)–based and vision-based techniques, can collect vibration signals without requiring sensors to be physically mounted on structures. Yang et al. placed nineteen measurement points on an aluminum beam and utilized SLV to capture its mode shapes [22]. Pan et al. measured the mode shapes of carbon-epoxy curved plates under free conditions using SLV [23]. Xin et al. utilized high-speed videos processed with a phase-based computer vision algorithm to measure the mode shapes of beams [24]. Chen et al. applied complex-valued steerable pyramid filter banks to analyze digital videos of structural motion and extract mode shapes of a pipe [25]. Despite providing denser measurement points, the use of SLV is costly and time-consuming. In contrast, vision-based methods, which offer lower costs, higher efficiency, and high-spatial-resolution measurements, are gaining increasing attention [26–28].
On the other hand, there is currently a lack of universally applicable mode shape-based index for revealing damage. Roy presented detailed mathematical derivations showing that the maximum difference in mode shape slopes occurs at the damage location [29]. Pooya et al. introduced the difference between mode shape curvature and its estimation as an indicator of damage location [30]. Cao et al. proposed a damage index combining wavelet transform technique and mode shape curvature to detect multiple cracks in beam structures [31]. Xiang et al. adopted modal curvature utility information entropy index (MCUIE) to catch the damage-induced discontinuity in mode shapes [32]. Cui et al. identified fatigue cracks by calculating spatially distributed wavelet entropy of mode shapes [33]. Although different damage indices have been presented and verified, it is important to note that these hand-engineered indices face many challenges. The formulation of a hand-engineered damage index necessitates an analysis of dynamic characteristics both before and after damage has occurred. This process heavily relies on domain-specific expert knowledge. Moreover, it is not feasible to universally apply a specific damage index in realistic complex noisy environments, even for identical structures. Therefore, a model that requires no manual intervention and is robust to noise, as well as capable of dealing with extreme cases of partial data missing, is desirable.
In recent years, data-driven methods based on deep neural network (DNN) have revolutionized numerous scientific domains [34]. One significant advantage of DNNs is their capacity to autonomously learn high-level feature representations from massive samples without manual feature engineering, which allows for end-to-end prediction [35]. Scholars have made efforts to utilize DNN-based methods to realize damage detection. Oh et al. used a convolutional neural network (CNN) to model the interrelation of dynamic displacement response between healthy and damaged states [36]. Lei et al. proposed a CNN model to identify structural damage from transmission functions of vibration response [37]. Tang et al. developed a CNN-based data anomaly detection method imitating human vision and decision making [38]. He et al. combined CNN with fast Fourier transform (FFT) to identify damage conditions [39]. Guo et al. utilized a model composed of stacked CNN modules to extract damage features from raw mode shapes [40]. Nevertheless, most DNN-based methods rely solely on CNN for their network architecture. This limits their model improvement to merely stacking network layers to increase trainable parameters, rather than enhancing feature extraction capabilities.
To overcome the above deficiencies, in this paper, we propose a novel vision-aided framework with convolutional multihead self-attention neural network (CMSNN) to deal with damage detection tasks. A computer vision algorithm named optical flow estimation is first employed to conduct high-spatial-resolution vibration measurements. Then, the CMSNN model, composed of two distinct types of modules, is designed to perform multiscale damage information (DI) extraction and fusion autonomously. To meet the requirement of generating massive labeled samples for model training, a numerical simulation strategy is adopted to construct datasets of damaged mode shapes, accounting for measurement noise, multiple damages, and undamaged samples. Moreover, the results of numerical simulations and experiments show that the proposed framework can accurately detect structural damage from raw data with strong robustness and remains effective across various scenarios.
The rest of the paper is organized as follows. Section 2 presents the theory of optical flow estimation and the architecture design of the CMSNN model. Section 3 describes the strategy for the CMSNN model training. The performance of the CMSNN model is numerically evaluated in Section 4, and the proposed framework is experimentally verified in Section 5. Section 6 concludes the paper with a summary of findings and suggests potential future research directions.
2. Methodology
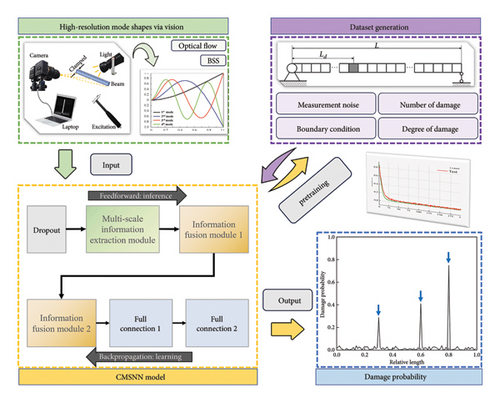
In this section, the principles of the proposed damage detection framework are described in detail. Figure 1 provides a visual representation of the specific process of the framework.
2.1. High-Spatial-Resolution Mode Shapes via Vision
In practice, optical flow vectors are calculated to track the locations of pixels across video frame sequences, thereby providing the vibration signals associated with those pixels. Notably, each tracked pixel can serve as a measuring point, which allows for high-spatial-resolution vibration measurements. In this paper, blind source separation (BSS) technique is adopted to extract high-spatial-resolution mode shapes from the obtained vibration signals. The comprehensive explanations and derivations of BSS are available in [41].
2.2. CMSNN Model for DI Extraction and Fusion
In this paper, a novel CMSNN model is proposed to autonomously learn high-level feature representations from obtained noisy mode shapes, obviating the need for explicit manual feature design. In particular, the architecture of the CMSNN model mainly consists of two principal functional modules: the CNN-based multiscale information extraction module and the attention mechanism–based information fusion module.
2.2.1. Multiscale Information Extraction Module
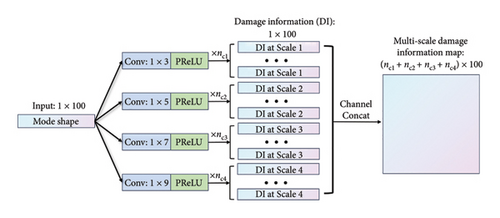
The architecture design of the multiscale information extraction module is depicted in Figure 2. In this module, convolutional layers are used to extract multiscale damage features from the raw mode shape data. The input mode shape vector comprises 100 components, indicating that the mode shapes obtained via simulations and vision-aided experiments both equally contain 100 sample points.
2.2.2. Information Fusion Module
The attention mechanism is fundamentally analogous to the human vision mechanism focusing on the key features and attenuating the impact of noise interference during the training process [43], making it particularly well suited to the damage detection task. The primary objective of the information fusion module is to achieve an efficient fusion of multiscale DI using an architecture based on multihead self-attention mechanisms. Figure 3 provides a visual representation of this architecture.

The multihead attention obtained has established an adaptive correlation of DI between different scales in multiple embedding spaces. It is important to note that this is an efficient and robust process of information fusion, not limited by the spacing of the scales.
2.2.3. CMSNN Model Construction
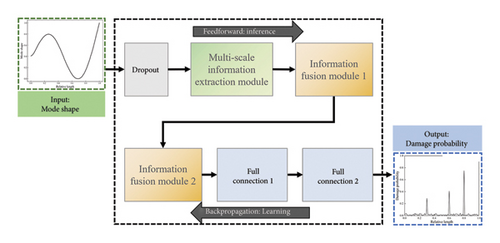
During the verification stage, a series of experiments were conducted to assess the performance of different module combinations and hyperparameter settings. Figure 4 illustrates the overall architectural configuration that yielded the optimal results, and Table 1 lists the detailed configuration of each module.
| Module type | Kernel size | Kernel number | Stride | Padding | Head number | Activation function | Output size |
|---|---|---|---|---|---|---|---|
| Multiscale information extraction module | 1 × 3 | 32 | 1 | 1 | / | PReLU | 32 × 100 |
| 1 × 5 | 32 | 1 | 2 | / | PReLU | 32 × 100 | |
| 1 × 7 | 32 | 1 | 3 | / | PReLU | 32 × 100 | |
| 1 × 9 | 32 | 1 | 4 | / | PReLU | 32 × 100 | |
| Information fusion module 1 | / | / | / | / | 4 | PReLU | 128 × 100 |
| Information fusion module 2 | / | / | / | / | 2 | PReLU | 128 × 100 |
| Full connection 1 | / | / | / | / | / | PReLU | 1 × 1000 |
| Full connection 2 | / | / | / | / | / | Sigmoid | 1 × 100 |
The mode shape fed into the CMSNN model is initially processed by a dropout layer to randomly freeze input nodes. This simulates data-missing scenarios while simultaneously avoiding overfitting. Subsequently, the damage semantic information is extracted from various scales through the multiscale information extraction module to construct the DIM. Following this, two information fusion modules are stacked to perform attention computation on the DIM in multiple embedding spaces, achieving efficient and robust information fusion. Finally, the high-level attention feature is flattened and fed into two stacked fully connected layers to provide the damage probability distribution.
3. Training Strategy
3.1. Dataset Generation
Constructing datasets through video stream acquisition and optical flow estimation undoubtedly results in significant computational overheads and wasted storage space. Accordingly, we adopt a numerical simulation strategy to generate a large number of labeled samples for model training. The strategy is divided into two steps.
| Boundary condition | First mode shape | Second mode shape | Third mode shape |
|---|---|---|---|
| Clamped–free (C–F) | 1.875104 | 4.694091 | 7.854757 |
| Clamped–clamped (C–C) | 4.730041 | 7.853205 | 10.995608 |
| Clamped–pinned (C–P) | 3.926602 | 7.068583 | 10.210176 |
In the process of dataset generation, various factors are taken into account, including boundary conditions, measurement noise, number of damages, and degree of damages, to allow the CMSNN model to learn a more intrinsic representation of the DI. The range of possible choices at random for each of these factors is shown in Table 3, and the detailed allocation of samples for the dataset is shown in Table 4.
| Boundary condition | Number of damages | Degree of damages | Signal-to-noise ratio (dB) |
|---|---|---|---|
| {C-F, C-C, C-P} | {1, 2, 3} | (0, 1) | (60, 120) |
| Sample use | Damaged samples | Undamaged samples | Total samples |
|---|---|---|---|
| Train | 10,000 | 2000 | 12,000 |
| Validate | 2500 | 500 | 3000 |
| Test | 1000 | 200 | 1200 |
3.2. Loss Function
To minimize the loss value, we use Adam [45] as the optimization method to optimize the network weights, as it can adaptively change the learning rate according to the current gradient. The two momentum parameters for Adam are set to β1 = 0.9 and β2 = 0.999.
3.3. Training Results
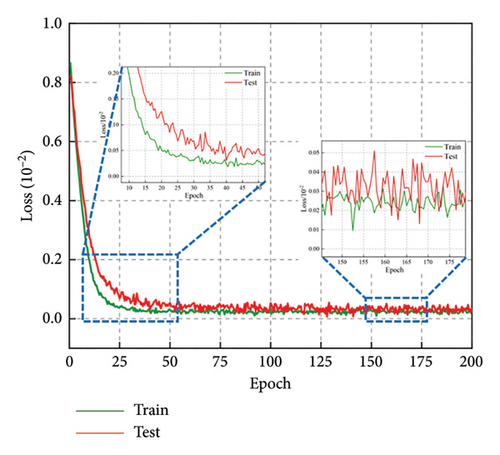
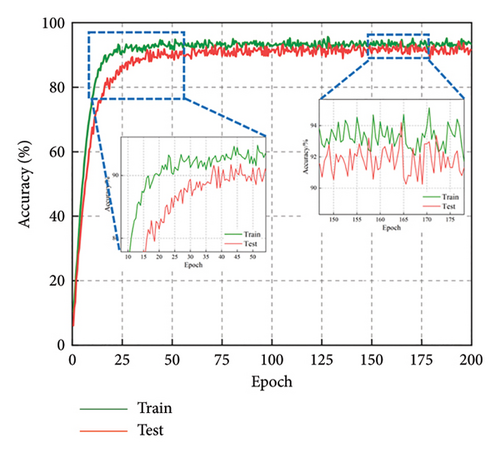
The CMSNN model is implemented on the PyTorch (Version 1.11.0) platform. All modules are initialized from scratch with random weights. The training and testing processes are conducted on the same hardware (CPU: Intel Xeon Platinum 8375C, GPU: NVIDIA GeForce RTX 3090, RAM: 128 GB). We trained the proposed network with the generated dataset for 200 epochs using a batch size of 128, with detailed records of loss and accuracy values. The convergence history of the CMSNN model is plotted in Figure 5. The plots reveal that the loss and accuracy curves exhibit an inflection point around the 30th epoch, signifying the model’s quick convergence in the initial 30 epochs to meet the task’s predictive demands. Following 200 epochs of training, the accuracy on both the training set and testing set reaches 0.9, demonstrating that the CMSNN model presents an excellent ability for the prediction task.
4. Model Evaluation
4.1. Noise Floor Evaluation
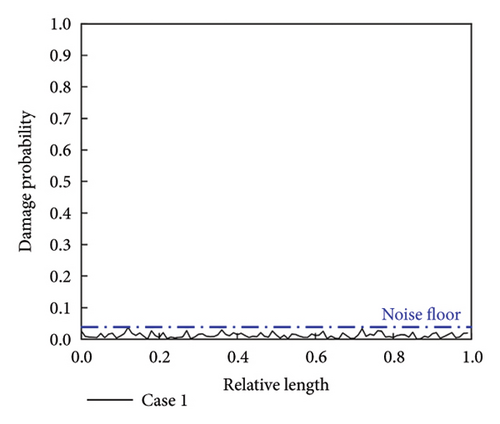
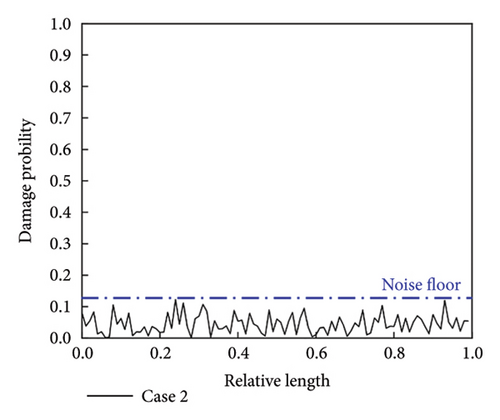
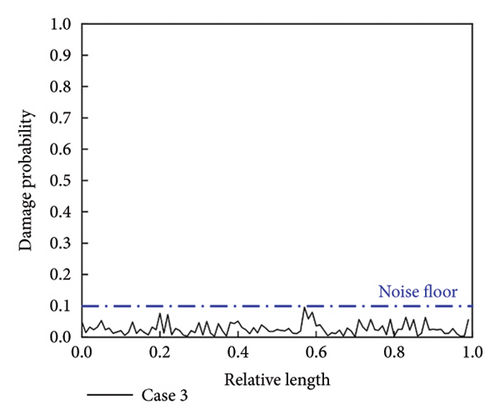
The noise floor is an important indicator of a model’s performance. In the context of our damage detection task, the noise floor level is reflected in the predicted damage probability distribution for undamaged samples. We first randomly chose three cases to evaluate the noise floor level of the CMSNN model. The specific settings of these cases are presented in Table 5.
| Case | Mode shape | Boundary condition | Signal-to-noise ratio (dB) |
|---|---|---|---|
| 1 | First order | C-C | 105 |
| 2 | Second order | C-F | 69 |
| 3 | Third order | C-P | 82 |
By feeding the mode shapes into the CMSNN model, the predicted damage probability distributions for three undamaged cases are obtained, as shown in Figure 6. It is presented that the predicted damage probability distributions lack localized peaks, indicating the absence of damage. Despite increased fluctuations in the damage probability distribution curve in noisier cases (i.e., lower signal-to-noise ratio), the damage probability remains at a low level. This suggests that the CMSNN model can deal well with undamaged states and possesses a low noise floor.
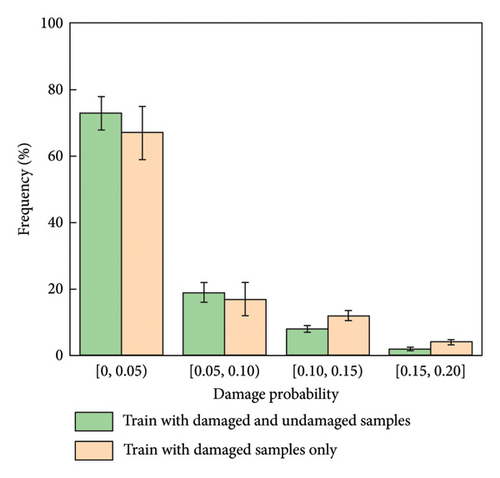
Moreover, it is important to recognize that this good performance benefits from the incorporation of a proportion of undamaged samples within our dataset. To verify this inference, we remove the undamaged samples from the dataset and retrain the network. On a batch of 512 undamaged samples, the model trained with damaged samples only is compared to the model trained with both damaged and undamaged samples. Figure 7 demonstrates the frequency distribution pattern of damage probability predicted by the two models for all samples, where the height of the column denotes the mean of the frequencies and the height of the error bar denotes the standard deviation of the frequencies. As demonstrated in plots, the model trained with both damaged and undamaged samples achieves a lower and more stable predicted damage probability distribution for the undamaged case, indicating a lower noise floor.
4.2. Noise Immunity Test
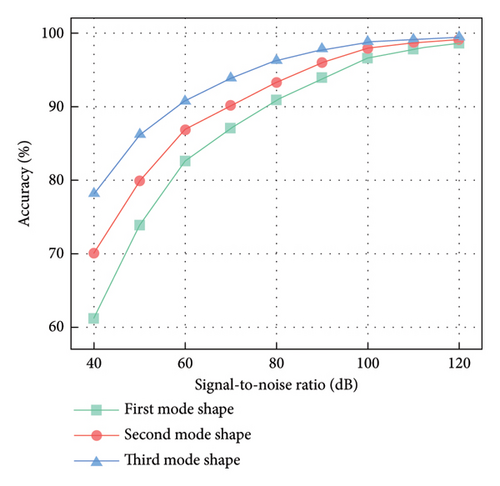
Figure 8 shows the results of the accuracy assessments. It can be observed that the higher order mode shape demonstrates greater robustness to noise compared to the lower order mode shape. Although the damage features are inevitably blurred by noise, the proposed model maintains satisfactory detection accuracy. The model can achieve an accuracy of over 90% when the signal-to-noise ratio exceeds 80 dB, and an accuracy of over 80% when the signal-to-noise ratio is above 60 dB. When the signal-to-noise ratio falls below 60 dB, the model’s detection accuracy drops more rapidly, as the model has not yet learned from samples with these noise levels. Nevertheless, the accuracy can reach over 60% at the signal-to-noise ratio of 40 dB, suggesting that the model has learned a more fundamental representation of the DI.
4.3. Data Missing Test
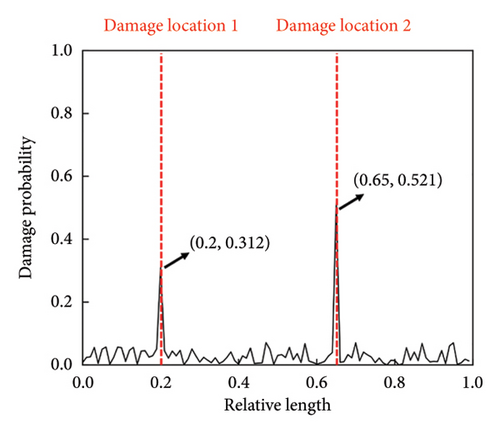
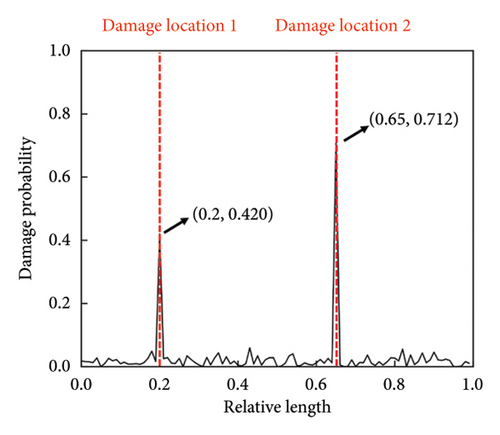
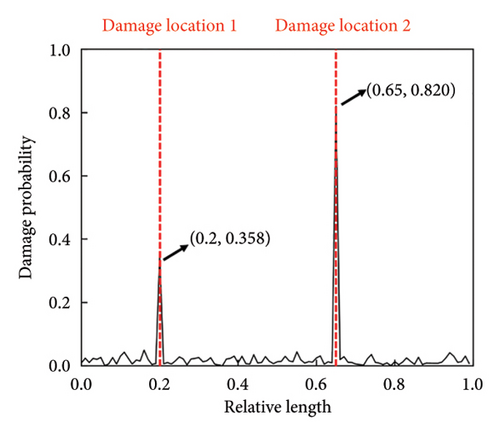
Considering the limitations of measurement and data storage, the issue of missing data sometimes arises in practice. To evaluate the capability of the CMSNN model to deal with data-missing scenarios, three cases are randomly selected. In each case, we introduce 20% and 30% stiffness reductions at the relative lengths of 0.2 and 0.65, respectively. The data missing is simulated by replacing the original value of the missing location with zero. The settings of these cases are given in Table 6.
| Case | Mode shape | Boundary condition | Missing ratio (%) |
|---|---|---|---|
| 1 | First order | C-F | 5 |
| 2 | Second order | C-C | 8 |
| 3 | Third order | C-P | 10 |
The detection results of the three cases are shown in Figure 9. It is presented that the damage locations can be correctly detected even when incomplete data are provided as input. This indicates that the proposed model is capable of extracting effective DI in the data-missing scenarios.
4.4. Compared With Other Methods
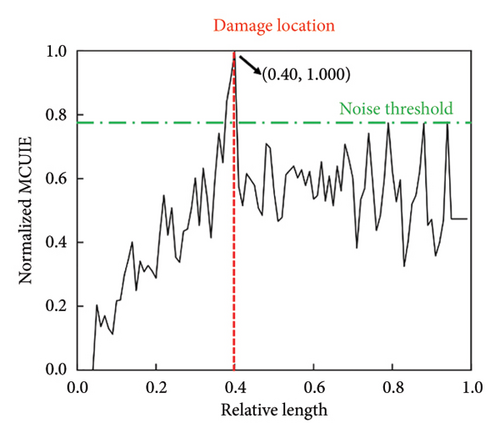
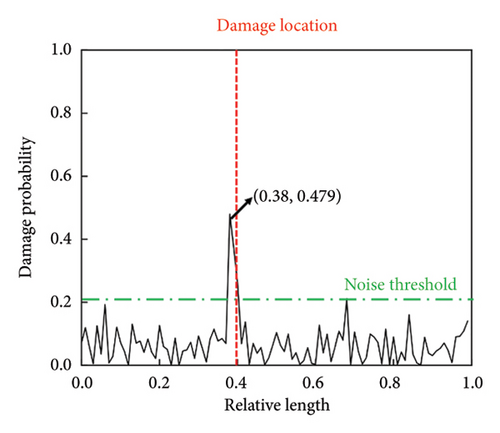
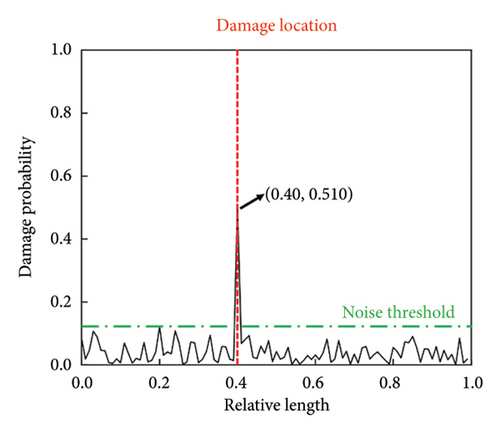
The detection results of the three methods are illustrated in Figure 10. Although both the MCUIE-based and stacked CNN-based methods are capable of damage detection, each exhibits certain limitations. The MCUIE-based method, while sensitive to damage, is prone to noise interference. Its sensitivity to local mutations in the MCUIE can lead to false positives, where noise is mistakenly identified as damage features, and it achieves a degree of differentiation of only 1.28. On the other hand, the stacked CNN-based method is more robust against noise, but it still exhibits significant fluctuations in nondamaged regions, with a low degree of differentiation of 2.34. This can make it challenging to set an accurate noise threshold for damage detection and may introduce ambiguity in localizing the damage. In contrast, the proposed CMSNN model demonstrates a marked improvement, effectively detecting damage with a high degree of differentiation reaching 4.22. This superior performance highlights the CMSNN model’s ability to discern damage features with greater precision, even in the presence of noise, and to provide a clearer distinction between damaged and nondamaged regions.
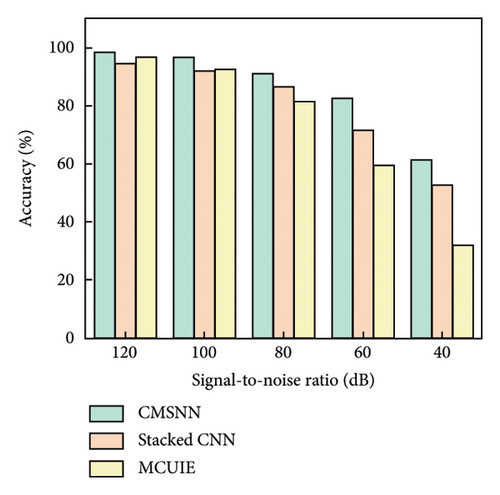
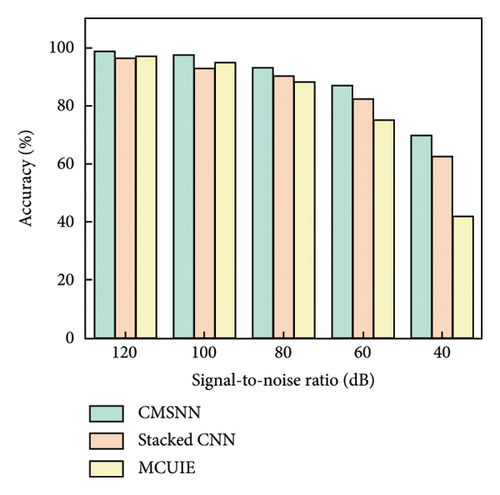
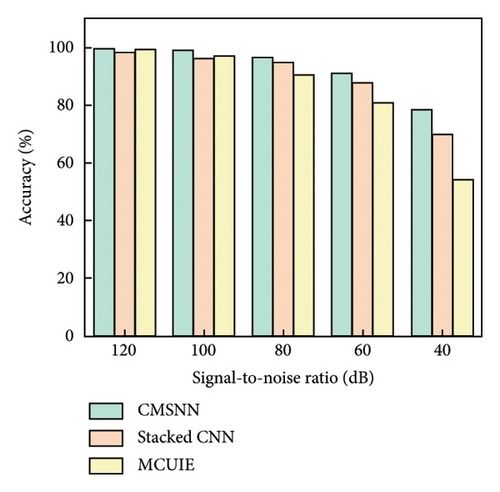
Furthermore, to quantitatively assess the detection accuracy of the various methods under statistical conditions, we conducted Monte Carlo experiments. The outcomes of the Monte Carlo simulations are presented in Figure 11. The proposed CMSNN model exhibits a superior level of noise immunity relative to the other two methods under consideration, highlighting its reliability and stability in detecting damage even in the presence of significant noise.
5. Experimental Verifications
This section details the experiments conducted to further validate the proposed damage detection framework with real-world data, which comprises two distinct parts. Concretely, the first part involves performing damage detection on a beam with multiple damages to validate the method’s effectiveness in practical situations. In the second part, a practical strategy, called parameter transfer, is introduced and applied to the method for further damage detection in a laminated plate.
5.1. Damage Detection for the Through-Hole Beam
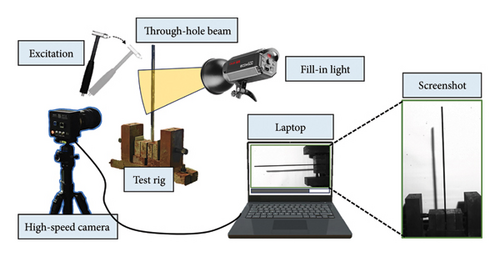
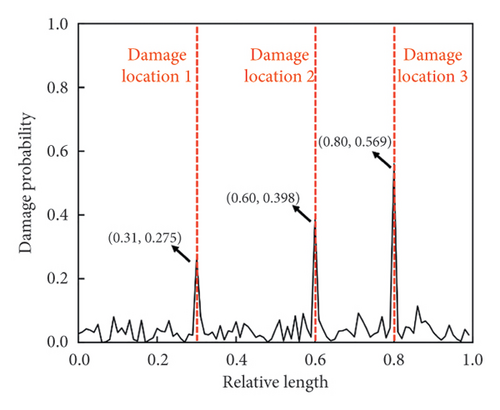
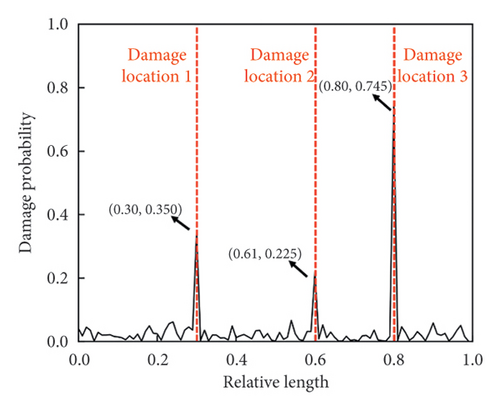
The schematic diagram of the vision-aided experimental system is displayed in Figure 12(a). The experiment is carried out on an aluminum alloy 6061 beam specimen with three through-holes. The three through-holes are introduced into the specimen by a drilling machine, with internal diameters of 4, 4, and 5 mm, respectively. Figure 12(b) illustrates the dimensions of the specimen and the location of damages. The beam’s vibration video is collected during the experiment process using a high-speed camera (Revealer 5F04, full resolution: 2320 × 1718 pixels, pixel size: 7 × 7 μm, maximum frame rate: 52,800 fps, responsivity: ISO 6400). Based on the finite element analysis, the first three modal frequencies of the beam are calculated as 19.73, 123.71, and 346.39 Hz. In accordance with the Nyquist sampling theorem, it is imperative that the sampling frequency exceeds twice the frequency of the signal being identified to ensure that the discrete signals can accurately reconstruct the original continuous signals without the introduction of aliasing. For modal shape identification, which is crucial for damage detection, a more conservative sampling frequency is indeed preferable. Given that an elevated sampling frequency can enhance the fidelity of the vibration data, the frame rate of the camera is set to 3000 frames per second (fps).

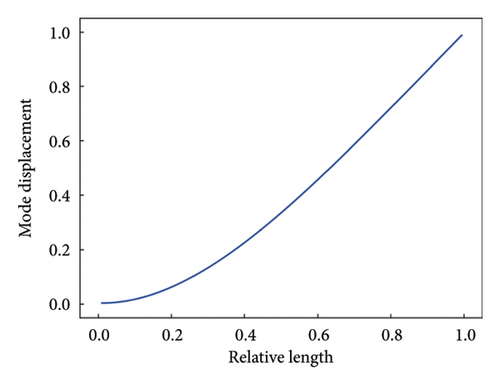
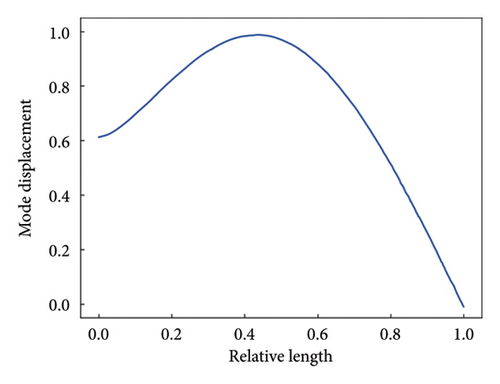
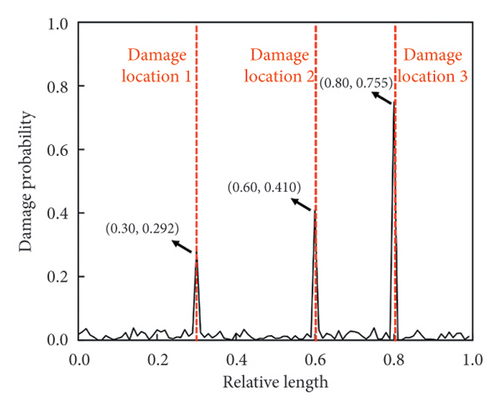
A total of 100 pixel points are uniformly selected along the length direction of the target beam to be tracked by optical flow estimation, acting as 100 virtual sensors without mass loading effects. Based on the high-spatial-resolution measurement, the first three mode shapes are identified, which are shown in Figure 13. The detection results are shown in Figure 14. In actual scenarios, although vision-aided technology can be a useful solution to the limitation of measurement resolution, it cannot be ignored that the measurement noise is still present in the obtained mode shapes due to various factors like lighting conditions and image resolution. Benefiting from the efficient CNN-based DI extraction and robust attention-based information fusion of the CMSNN model, the exact locations of damage are all indicated at the peak of the predicted damage probability distribution.

5.2. Application of Parameter Transfer Strategy
In the field of SHM, it is a common issue that the length of the input signal (or the number of sampling points) varies due to the differences in the measuring approaches and target objects. Conventional methods suggest resolving this issue by interpolating the input signal to meet the signal length requirement or by retraining the network model. However, data interpolation can result in loss of information from the source signal, and retraining the network from scratch can be both time-consuming and computationally intensive.
Inspired by the domain of transfer learning, a practical strategy named parameter transfer is introduced here. The CNN-based multiscale information extraction module can extract essential DI from input mode shape signals after training without strict length requirements for input signals. This makes it a generic extractor for DI without needing to be retrained. That is, in various damage detection scenarios, the proposed model can be employed to address the detection task by fixing the parameters of the generic multiscale information extraction module and only retraining the information fusion module with explicit constraints on the signal length.
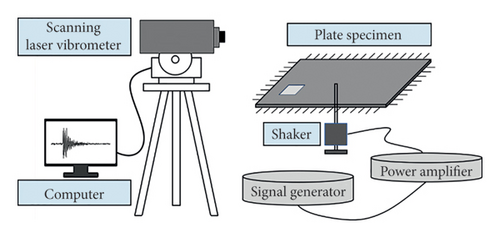
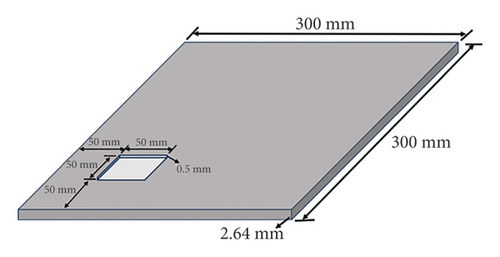
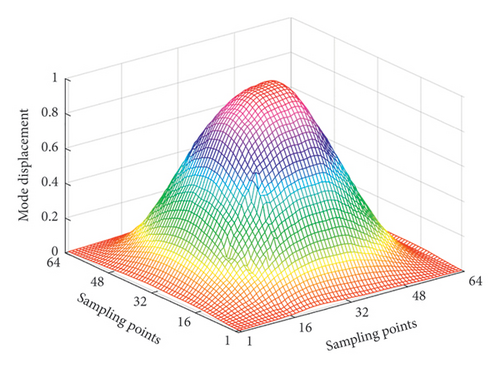
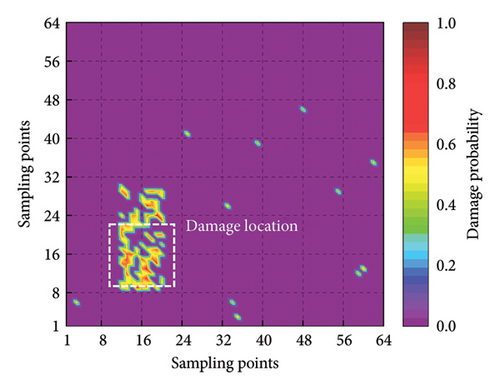
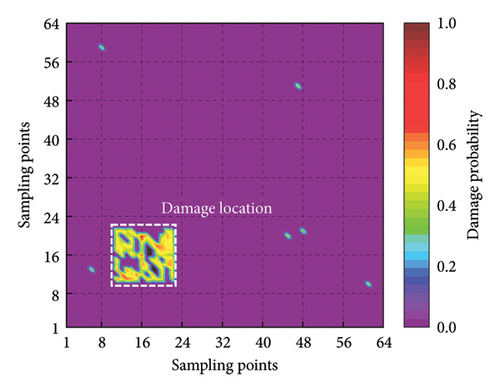
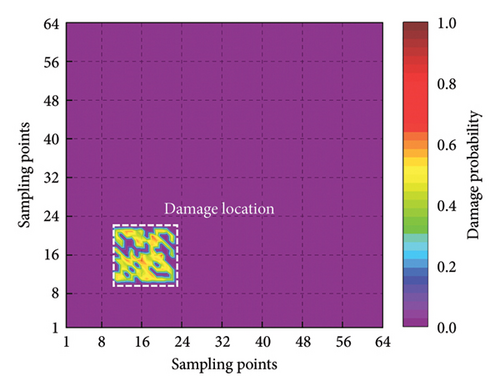
In order to verify the detection capability of the proposed framework with parameter transfer, an experimental investigation is performed based on the publicly available Damage Assessment Benchmark, as detailed in reference [46]. The schematic diagram of the experimental system is shown in Figure 15(a). This benchmark includes data measured from vibration tests of composite structures. The study focuses on the case of a damaged laminated plate specimen, which is a square plate made of 12-layered grass fiber-reinforced epoxy-based laminated composite. It has a length of 300 mm and a thickness of 2.64 mm, and all four sides are fixed. The spatial surface damage is machined with a milling machine to a depth of 0.5 mm. Figure 15(b) shows the dimensions and location of the damage. The first four mode shapes are obtained using an SLV (Polytec PSV-400) with a resolution of 64 × 64 sampling points, which are demonstrated in Figure 16.
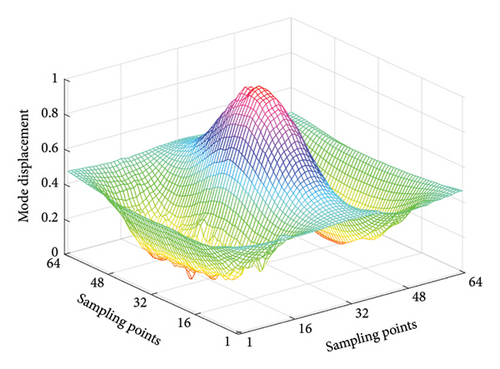
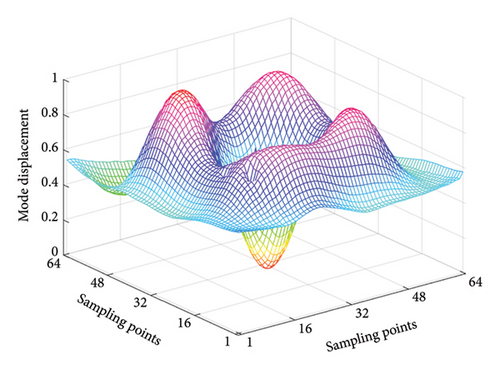
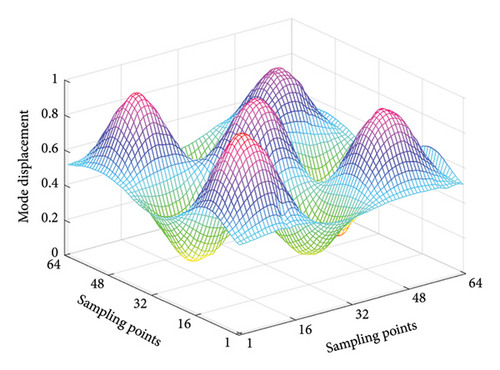
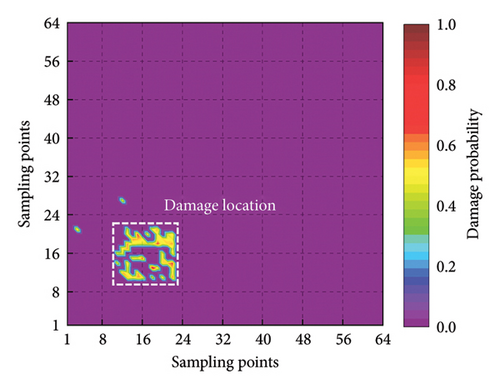
In the experimental process, the weights of the multiscale information extraction module in the CMSNN model are frozen and only the weights of the information fusion module are retrained. To analyze the two-dimensional plate using the proposed model, we input the mode shape data of the plate row by row and column by column. This enables the predicted damage probability spatial distribution in two different directions to be obtained. The final damage probability spatial distribution is calculated by taking a weighted average of the two aforementioned spatial distributions. To enhance the intuitiveness of the results, positions with a damage probability of less than 0.3 are set to zero. The detection results are presented in Figure 17, which clearly demonstrates the damaged area.
6. Conclusions
- 1.
The utilization of optical flow estimation algorithm enables the acquisition of mode shapes of target structures at a high spatial resolution without mass-loading effects, which is suitable and informative enough for damage detection tasks.
- 2.
A novel CMSNN model is designed to autonomously learn high-level feature representations from noisy mode shapes, eliminating the need for explicit manual feature design. The model combines a CNN-based multiscale information extraction module with an attention-based information fusion module, thereby enhancing its capabilities.
- 3.
During the design and training process, the CMSNN model considers a range of scenarios, including measurement noise, data missing, and undamaged samples. This ensures that the proposed framework can provide reliable detection results even when the input data are corrupted by noise or incomplete.
- 4.
The results of experiments demonstrate that the proposed framework accurately detects damages in actual scenarios. Furthermore, the application of the parameter transfer strategy minimizes retraining effort while preserving the capacity for damage detection, which increases versatility.
Despite the laboratory success of this paper, there are some potential challenges. The excessive compression artifacts and lighting variations of experimental videos under undesirable conditions may affect the accuracy of optical flow estimation and alter the noise distribution compared to the training dataset, which impacts the overall performance of the CMSNN model. In future work, real-world data will be further combined with simulation-generated dataset for training to improve generalization and address the challenges. Moreover, the interpretability of the proposed model will be studied using visualization techniques to guide the understanding of damage features. The combination of data-driven models and physics-based methods promises to provide a more comprehensive approach to damage detection.
Conflicts of Interest
The authors declare no conflicts of interest.
Funding
This work was supported by the Basic Research Project Group (No. 514010106-302).
Open Research
Data Availability Statement
The data that support the findings of this study are available from the corresponding author upon reasonable request.


