Deciphering Metabolic Responses in Traumatic Brain Injury Patients With Different Severity Using 1H NMR-Based Serum Metabolomics
Abstract
The analysis of metabolites presents a promising opportunity to gain insight into the neuropathophysiology of individuals affected by traumatic brain injury (TBI). In order to elucidate the underlying pathophysiologic mechanisms and identify serum biomarkers associated with TBI, we conducted a comprehensive investigation utilizing a 1H nuclear magnetic resonance (NMR)–based metabolomics approach and ELISA analysis of serum samples obtained within 24 h postinjury from a cohort of participants with varying degrees of TBI severity. Our findings revealed that the decrease of isoleucine, valine, tryptophan, and histidine, as well as the increase of lactate, were proportional to the severity of TBI. In addition, creatine phosphate showed promise in specifically distinguishing moderate TBI from controls, while glutamine and the lactate-to-pyruvate ratio demonstrated excellent performance in diagnosing severe TBI from controls. Pathway analysis revealed disruptions in the ketone body metabolism, carnitine synthesis, butyrate metabolism, and citric acid cycle across mild to severe TBI patients. Moreover, our findings suggest an upregulation of the cytokines IL-1β, IL-6, and TNF-α following TBI, displaying correlations with lactate, 5-aminopentanoate, glucose, and creatinine metabolites. This study offers a novel concept and theoretical framework by leveraging serum metabolites to enhance the objective, rapid and reliable assessment of TBI severity. The clinical implications of this research are significant, as it facilitates the diagnosis and prognosis of TBI patients across a spectrum of severity levels.
1. Introduction
Traumatic brain injury (TBI) is a prevalent type of head injury encompassing various forms such as skull fracture, focal brain injury, concussion, and diffuse axonal injury. Severe and moderate TBI are significant contributors to global mortality and disability rates. In civilian populations, mild, moderate, or severe TBI commonly arise from sports-related injuries, falls, or traffic accidents [1]. Presently, the Glasgow Coma Scale (GCS) score is frequently employed in clinical settings to assess the initial severity of TBI patients. However, this method has certain limitations including time consumption, complexity, and potential treatment complications. Therefore, the identification of a prompt, precise, and unbiased diagnostic test to assess the extent of TBI is crucial for healthcare professionals to devise personalized treatment approaches for patients.
Recent research has demonstrated that metabolic dysfunction can occur even in cases of mild TBI following a concussion [2]. It is widely recognized that the initial mechanical injury to neurons initiates a multifaceted series of metabolic processes and neuroinflammatory responses, an understanding of which is imperative for clinical, translational, and pharmacological investigations. From this standpoint, scholars have devoted considerable effort to identifying fluid biomarkers for TBI. However, the specific metabolic alterations that occur immediately after various levels of TBI severity remain largely unknown. Therefore, the identification of serum metabolites undergoing changes following TBI presents a valuable opportunity to comprehend the underlying pathophysiological mechanisms of TBI and its assessment of severity. In addition, the literature extensively acknowledges the presence of a neuroinflammatory response to TBI, with evidence indicating that the extent and nature of neuroinflammation impact neurogenesis and functional recuperation in laboratory-based models [3–5]. The release of both pro- and anti-inflammatory cytokines occurs after TBI. However, the contribution of each to the progression of TBI and whether cytokine changes are related to metabolic disturbance is yet to be clearly defined. Moreover, utilizing multiple biomarkers including metabolites and cytokines to assess the severity of TBI patients may yield better results and predictive values for future therapeutic interventions.
Metabolomics is a robust methodology for evaluating endogenous small molecules present in biological fluids [6], rendering it a valuable biomarker tool for TBI [7, 8] and various other neurological disorders such as stroke [9], spinal cord injury [10], and sport-related concussion [11]. Nuclear magnetic resonance (NMR) spectroscopy is an amenable technique for investigating metabolomics due to its ability to identify novel compounds without the need for chemical derivatization [12]. NMR can effectively detect 67 metabolites in human blood, with approximately one-third of these being previously unreported compared to those identified previously as a part of the Human Serum Metabolome Database [13]. Though recent studies hold promise [14–16], further investigation is warranted to enhance comprehension of the connections between serum metabolites and the extent of TBI in patients utilizing NMR-based metabolomics.
In this study, we conducted a 1H NMR-based metabolomic analysis to identify serum biomarkers in patients experiencing mild to severe TBI during the acute stage. In addition, we elucidated the correlations between alterations in inflammatory cytokines and metabolic fluctuations in patients with varying degrees of TBI severity. These findings have the potential to establish a theoretical foundation for the development of a prompt, reliable, and objective clinical test for diagnosing and prognosing patients with different levels of TBI severity.
2. Materials and Methods
2.1. Sample Collection
The First Affiliated Hospital of Wannan Medical College granted approval for human subject participation, and all participants provided written informed consent prior to entering the study. Patients with TBI admitted to the Neurosurgery at The First Affiliated Hospital of Wannan Medical College were recruited between January 2021 and June 2023. The study’s inclusion criteria comprised a history of cranial trauma, first admission within 24 h of injury, an initial head CT scan upon admission revealing no signs of cerebral infarction, and the availability of complete medical records for analysis. Exclusion criteria included a history of cerebral infarction; cerebral hemorrhage or other cerebral diseases; patients who passed away before receiving a follow-up CT scan; patients with a history of coronary heart disease, hypertension, carotid atherosclerosis, atrial fibrillation, deep vein thrombosis, liver cirrhosis, blood system diseases, or exogenous embolism; as well as those who experienced trauma due to cerebrovascular disease or limb fractures. Patients discharged against medical advice within 3 days of admission were also excluded. Control participants were recruited via random sampling from individuals visiting the hospital for annual medical check-ups during the same period as TBI patients. The same exclusion criteria were applied to healthy subjects, with the addition of no history of TBI within the past 6 months. Prehospital delays among patients ranged from minutes to an hour. The sampling intervals after admission for mild, moderate, and severe TBI patients were 1 ± 0.2, 1.2 ± 0.2, and 0.98 ± 0.22 h, respectively. Peripheral blood samples from participants were collected into promoting coagulating tubes, stored on ice, and processed within 1 hour of collection. The serums were then stored at −80°C until use.
2.2. Clinical Assessments
The GCS was used to rate the initial severity of TBI for each patient. It evaluates three different functions: eye-opening, verbal response, and motor responses, with higher scores indicating better function [17]. The final GCS score was determined by summing these individual scores, with the following categorizations: severe (GCS equal to or less than 8), moderate (GCS 9–12), and mild (GCS 13–15).
2.3. ELISA Assay
A 200 μL aliquot of serum was collected for enzyme-linked immunosorbent assay (ELISA) to quantify the concentrations of proinflammatory cytokines. This was performed using sandwich ELISA kits (Chundubio, Wuhan, China), following the manufacturer’s instructions.
2.4. 1H NMR Spectroscopy
As previously mentioned [18], blood samples were prepared for NMR spectroscopy examination following established protocols. In brief, a serum volume of 300 μL was combined with methanol at 1:2 ratios (v/v) to precipitate proteins. The mixture was vortexed and incubated at −20°C for 20 min before being centrifuged at 12,000 g for 15 min to pellet the proteins. The obtained supernatant was decanted into a new vial and dried. The dried extract was diluted in 600 μL of 99.8% D2O phosphate buffer (0.2 M, pH at 7.0) containing 0.05% (w/v) TSP (sodium salt of 3-(trimethylsilyl)propionate-2, 2, 3, 3-d4), vortexed, and transferred to a 5 mm NMR tube.
The NMR data were collected using a 500 MHz Bruker Avance III NMR spectrometer equipped with a room-temperature probe. TSP served as the chemical shift reference (1H, 0.00 ppm), while D2O was used for field frequency locking. Prior to data collection, three-dimensional and one-dimensional shimming tests were conducted on the serum samples to address any inhomogeneities in the static magnetic field. To minimize signals from residue proteins, a transverse relaxation–edited Call–Purcell–Meiboom–Gill (CPMG) sequence (90 [τ-180-τ] n-acquisition) with a total spin-echo delay (2 nτ) of 20 ms was employed. The 1H NMR spectra were acquired using 64 scans into 64 K data points with a spectral width of 20 ppm. Fourier transformation of the spectra was performed after multiplying the free induction decay (FID) with an exponential weighting function corresponding to a line-broadening of 0.5 Hz.
The NMR spectra were imported into MestReNova software (Version 14.0, Mestrelab Research SL) for denoising, phase and baseline correction, and peak alignments using the TSP signal as a reference (1H, 0.00 ppm). Each spectrum was segmented into integrated buckets of 0.002 ppm between 0.8 and 9.0 ppm. Regions from 4.3 to 6.8 ppm were excluded to eliminate residual water and its impact on nearby regions. After binning, each spectrum was reduced to 2582 bins with each bin considered a new variable.
2.5. Multivariate Analysis
To facilitate sample comparison, the dataset was standardized to unity and Pareto-scaled before multivariate data analysis using SIMCA 14.1 software (Umea, Sweden). Principal component analysis (PCA) was first employed to assess intrinsic variation and metabolic patterns of unsupervised samples (Figure S1). A partial least-squares discriminant analysis (PLS-DA) model with 2582 features and four latent variables was constructed to enhance group discrimination and identify distinctive variables. The score plot was used to illustrate class groupings. The validity of the PLS-DA model was evaluated using a 7-fold cross-validation method, where R2Y represents the total explained variance and Q2 denotes the prediction capacity. In addition, an orthogonal PLS (OPLS-DA) model was constructed to improve classification among groups (Figure S2).The classification performance of the PLS-DA model was evaluated through receiver operating characteristic (ROC) analysis. The ROC curves were generated by plotting the classifier’s sensitivity versus 1-specificity for each class separately. The area under the ROC curve (AUROC), ranging between 0.5 (bad classification) and 1.0 (perfect classification), served as a quantitative measure of classification success. Variable importance in projection (VIP) scores was used to rank variables based on their importance in discriminating between different groups. Variables with higher VIP scores are considered more important for the classification task.
Metabolites were identified using commercially available software, Chenomx NMR suite (Edmonton, Alberta), and the Human Metabolome Database [19]. The fold changes (FCs) of metabolite levels among groups and their associated p values were calculated based on their integration areas, which are provided in a color-coded table after the log2 transformation. The correlations between metabolites and cytokines were assessed using the sparse-partial least-squares (sPLS) method in the mixOmics R package [20], with metabolite concentrations as X variables. The categorical variables representing the groups, along with the cytokine concentrations obtained from ELISA assays, were used as the Y (response) variables. Significant metabolites were further analyzed using MetaboAnalyst [21] online tools for pathway analysis. Enrichment analysis was performed using Fisher’s exact test, while topology analysis utilized out-degree centrality algorithms, all based on the SMPDB pathway library for humans [22].
2.6. Identification of Biomarker Panel for Diagnosing the Severity of TBI
Multivariate and univariate methods were employed to identify potential biomarkers for diagnosing the severity of TBI. First, metabolites were selected based on the criteria of VIP > 1. Subsequently, a shared and unique structures (SUS) analysis was constructed using a custom R script, which reveals the shared and unique metabolites between the two compared PLS-DA models with the same reference group. Variables aligning along the diagonal from the lower left corner to the upper right corner indicate shared structures among the models, while those not aligned represent unique structures to either model. Specific diagnostic metabolites for severe and moderate TBI were identified using the SUS plot in combination with the criteria of FC > 1.2 or < 0.8. The diagnostic efficiency of these biomarkers in distinguishing one class from another was determined using binary logistic regression models in GraphPad Prism 10 software. Model performance was monitored using ROC analysis, with the AUROC values evaluated. An AUROC threshold of greater than 0.9 was set to determine significance.
2.7. Statistical Analysis
The data were analyzed using SPSS 25.0 statistical software. Measurement data were expressed as mean ± standard deviation. Significant differences between groups were tested using one-way ANOVA followed by Fisher’s LSD multiple comparison, while non-normally distributed data were analyzed using nonparametric Mann–Whitney U tests.
3. Results
3.1. Patient Characteristics
A total of 24 controls and 72 TBI patients were recruited. The detailed baseline characteristics of participants are summarized in Table 1. No significant differences (p > 0.05) were found in age and sex between TBI patients and healthy controls, ensuring that any observed effects or outcomes from metabolomic analysis are less likely to be influenced by these variables. Due to the limited sample size for each sex, grouping males and females into a single group was necessary to ensure sufficient statistical power for analysis.
| Control | Mild | Moderate | Severe | p valuea | |
|---|---|---|---|---|---|
| Age | 50.33 ± 8.45 | 50.38 ± 15.72 | 57.21 ± 11.93 | 57.83 ± 14.74 | 0.07 |
| Gender | |||||
| Male | 11 | 15 | 14 | 16 | 0.494 |
| Female | 13 | 9 | 10 | 8 | 0.357 |
- Note: p value greater than 0.05 means that, across the four groups being compared, there were similar distributions or proportions of patients in terms of age and sex.
- ap value was derived from the ANOVA test with all the four groups being involved.
3.2. ELISA Analysis
We conducted ELISA assays to identify the most common neuroinflammatory cytokines associated with the severity of TBI. As illustrated in Figure 1, our ELISA data revealed a significant increase in the levels of proinflammatory cytokines (IL-1β, IL-6, and TNF-α) compared to the control group (p < 0.05). The peripheral levels of inflammatory cytokines IL-1β, IL-6, and TNF-α were lowest in the mild group, followed by the moderate group, and were highest in the severe group (p < 0.05), indicating that TBI caused the most serious inflammation in those severe patients (Figure 1).

3.3. Metabolomic Analysis
The clusters of the four groups were clearly separated as observed in the PLS-DA scores plot (Figure 2(a)), with the control and severe groups being furthest apart, and the mild and moderate groups positioned in between. This demonstrates distinct metabolic disturbances occurring in patients with different severities of TBI. The permutation test intercepts of R2 (0.0 and 0.137) and Q2 (0.0 and −0.32) on the Y-axis illustrated that the PLS-DA model’s performance is superior to what would be expected by randomly permuting the class labels (Figure 2(b)). In addition, the AUROC values for the PLS-DA model were greater than 0.9, indicating a good diagnostic accuracy (Figure S3).


A total of 30 metabolites in the serum were identified in the NMR spectrum (Figure S4), with peak assignments confirmed using statistical total correlation spectroscopy (Figures S5–S12). The FCs of metabolites between groups are listed in the color-coded table (Table 2). The levels of lactate, lysine, and 5-aminopentanoate were markedly increased in every group of TBI, while isoleucine, valine, citrate, tryptophan, and histidine were significantly decreased. The changes in blood glucose levels among groups were further validated (Figure S13) using a commercially available kit (GSGLU001M, Beijing Strong Biotechnologies, Inc., Beijing, China), which aligns with the metabolomic result. Based on the Venn plot (Figure 3), specific disturbed metabolites were identified within each group. Phenylalanine disturbance was observed solely in the mild group; 2-hydroxyvalerate, creatine phosphate, threonine, and formate were disordered exclusively in the moderate group; and leucine, glutamate, pyruvate, creatinine, ornithine, and tyrosine were disturbed uniquely in the severe group.
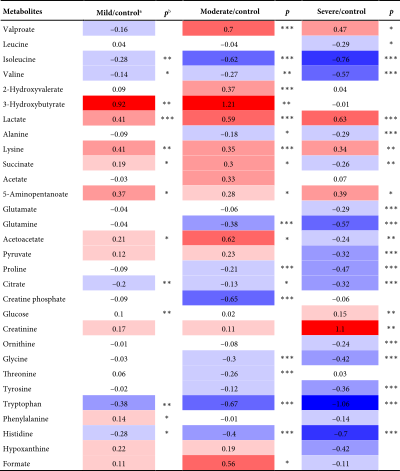 |
- Note: Color bar.
- aColor-coded according to log2 (fold change), with red and blue representing metabolites with increased and decreased concentrations in TBI patients compared to controls.
- b ∗p < 0.05, ∗∗p < 0.01, and ∗∗∗p < 0.001
 .
.

3.4. Pathway Analysis
The significantly changed metabolic pathways post-TBI were identified based on an impact-value threshold set at 0.05, with a p value less than 0.05. Pathway analysis (Figures 4(a), 4(b), and 4(c)) and further examination using a Venn plot (Figure 4(d)) revealed that the phenylalanine and tyrosine metabolism was affected in both mild and severe TBI groups. In addition, the ketone body metabolism, carnitine synthesis, butyrate metabolism, and citric acid cycle were commonly affected across all TBI groups. Specific pathways identified for the severe TBI group included alanine metabolism, transfer of acetyl groups into mitochondria, and Warburg effect.


3.5. Correlations Between Metabolites and Cytokines
To elucidate the correlations between metabolite disturbances and cytokine changes that occurred in TBI patients, sPLS analysis was conducted using the “mixOmics” R software [20]. The results are presented in a correlation circle plot (Figure 5). It reveals that several metabolites, such as glutamine and isoleucine, exhibit negative correlations with the severe TBI group, while positive correlations are observed between metabolites (such as glucose, creatinine, and lactate) and inflammatory cytokines (TNF-α, IL-6, and IL-1β). Notably, creatine phosphate and threonine showed a marked negative correlation with the moderate TBI group, while IL-1β displayed the most significant positive correlation with the severe TBI group.

3.6. Biomarker Identification
A total of 12 potential metabolites exceeding the VIP threshold (2-hydroxyvalerate, 3-hydroxybutyrate, creatine phosphate, creatinine, glutamine, glycine, lactate, pyruvate, valine, valproate, 5-aminopentanoate, and acetoacetate) were identified as a candidate biomarker for TBI. To ascertain distinctive biomarkers for each group among the candidates, the p(corr)[1] vectors from two compared PLS-DA models were then plotted against each other in the SUS plot (Figure 6 and Figure S14). The variables positioned at 6 and 12 o’clock, particularly those within the highlighted rectangles defined by the cutoff values of ± 0.6 and ± 0.3, were unique variables for Model 2 as their p(corr) value for Model 1 approached 0. Conversely, the variables situated at 3 and 9 o’clock were unique to Model 1, exhibiting p(corr) values close to 0 for Model 2.


By integrating the SUS plot with the FC criteria, specific diagnostic metabolites for distinguishing moderate TBI from controls were conclusively identified as valproate, creatine phosphate, and 2-hydroxyvalerate, while those for discriminating severe TBI from controls were identified as creatinine, pyruvate, and glutamine. Then, we established individual binary logistic regression models for each candidate biomarker, and AUROC values were used to assess their diagnosing abilities. Creatine phosphate and glutamine, both surpassing the AUROC threshold of 0.9, were selected as biomarkers to distinguish between moderate and severe TBI and controls, respectively (Figure S15). In addition, the ratiometric markers such as glutamine-to-glutamate ratio, phenylalanine-to-tyrosine ratio, and lactate-to-pyruvate ratio were evaluated for predicting TBI severity. Among them, the lactate-to-pyruvate ratio, with an AUROC greater than 0.9, showed a promising ability for distinguishing severe TBI from controls (Figure S16).
4. Discussion
It is hypothesized that TBI will induce a cascade of metabolic changes detectable in serum, providing insights into the injury’s severity. Identifying objective and reliable TBI biomarkers, obtained through minimally invasive methods, holds significant potential for accurate clinical diagnosis and tailored treatment approaches. Moreover, it has been observed that changes in inflammatory cytokine levels correlate with the severity of TBI [23, 24], and elevated serum cytokine levels have been associated with poorer posttraumatic symptoms and executive function measures, suggesting a possible link between inflammation and neuropsychological outcomes post-TBI [25, 26]. IL-6 is a multifunctional cytokine known to promote inflammatory cell infiltration, enhance monocyte–endothelial cell adhesion, induce endothelial cell destruction, and impact the blood–brain barrier [27, 28]. Similarly, IL-1β and TNF-α have been identified as hazardous cytokines that directly harm neuronal cells [29]. Consistent with prior research, our study found higher blood levels of IL-1β, IL-6, and TNF-α in the TBI group (Figure 1).
Of particular significance, the circulation circle plot (Figure 5) indicated a strong association between elevated levels of these cytokines and metabolites such as lactate, 5-aminopentanoate, glucose, and creatinine. Increased glucose and lactate levels are valuable biomarkers of energy metabolism, and the elevation of lactate can indicate shifts toward anaerobic metabolism, suggesting increased energy demands [30], forcing cells to prioritize anaerobic glycolysis for survival. Hence, aerobic glycolysis may dominate postsevere TBI, resembling the Warburg effect (Figure 4(c)). Previous work revealed a hyperglycolysis following severe TBI in humans [31]. Previous studies also highlighted the frequent occurrence of hyperglycemia after severe TBI and the underlying mechanisms that lead to hyperglycemia and discussed how they may contribute to poor outcomes [32]. Creatinine is a byproduct of creatine phosphate breakdown in muscle tissue, which could indicate disturbances in energy metabolism [33]. It may also reflect disturbances in renal function due to its filtration by the kidneys. These findings suggest that severe TBI may lead to bidirectional regulation between energy metabolism and inflammatory cytokines.
Branched-chain amino acids (BCAAs), comprising leucine, isoleucine, and valine, play vital roles in various physiological processes, including energy metabolism and neurotransmitter synthesis. Previous research has shown that mild TBI can lead to reduced circulating levels of BCAAs and their metabolites [34]. Consistently, our current investigation also observed decreased levels of BCAAs, particularly in the severe TBI group (Table 2). The alterations in BCAA levels during TBI may contribute to diminished energy production and neurotransmitter synthesis, potentially influencing TBI pathogenesis. Interestingly, previous research suggests that supplementation with BCAAs may mitigate TBI progression and improve outcomes [34]. These findings underscore the importance of investigating the metabolic disturbances associated with TBI and exploring potential therapeutic interventions targeting BCAA metabolism.
In line with the prior findings [35, 36], a significantly increased serum ratio of glutamate/glutamine in moderate and severe TBI patients was observed (Figure S17). Glutamate serves as the predominant excitatory neurotransmitter in brain tissue and is implicated in various physiological processes. Importantly, glutamate excitotoxicity is considered a key initiating factor in numerous downstream events following TBI, contributing significantly to the secondary damage cascade [37]. The consistency between our findings and previous studies underscores the significance of targeting glutamate/glutamine for future drug development and for enhancing our understanding of TBI pathophysiology.
Decreased levels of three aromatic amino acids (AAAs): tyrosine, phenylalanine, and tryptophan were observed after TBI, with severe TBI patients suffering the most pronounced effects (Table 2). Tryptophan has been demonstrated to possess a notable ability to reduce proinflammatory cytokine levels [38], while phenylalanine and tyrosine are amino acids with both glucogenic and ketogenic properties. Pathway analysis also revealed significant alterations in phenylalanine and tyrosine metabolism as well as ketone body metabolism (Figure 4(d)). Ketones can serve as alternative energy substrates to glucose [39], which are crucial energy sources for the brain, and exogenous ketone bodies have shown promise as neuroprotective agents for developmental brain injury [39]. Butyric acid has demonstrated therapeutic potential for neurological disorders as a histone deacetylase inhibitor, energy substrate, and G protein-coupled receptor activator. Deficiencies in butyric acid levels might be detrimental in the context of brain injury [40]. The alterations in AAAs and 3-hydroxybutyrate indicate a neuropathophysiological response in TBI patients, possibly aimed at combating inflammation or replenishing the body’s inadequate energy reserves.
We identified specific biomarkers with excellent diagnostic capabilities for distinguishing between moderate and severe TBI from controls: creatine phosphate for moderate TBI and glutamine and the lactate-to-pyruvate ratio for severe TBI. However, we did not identify a unique biomarker for predicting mild TBI, suggesting that the pathophysiological changes in mild TBI may be less pronounced compared to moderate and severe cases. It is worth noting that previous studies have also reported limitations of the GCS score in assessing mild TBI injuries [41]. Besides, we also compared the key metabolic changes observed in this study with those reported in previous studies, and most of our findings are consistent with earlier results (Table S1). The early and accurate diagnosis of different severities of TBI using biomarker panels holds immense potential, especially for cases where neuroimaging is not readily available. Such biomarkers could assist in determining whether patients require advanced medical interventions or immediate transfer to specialized clinical settings. Furthermore, TBI biomarkers could serve as valuable tools for drug development and treatment monitoring.
Despite these promising findings, the variations in sampling times after TBI represent a limitation of our study, as metabolic processes can fluctuate over time. Further clinical validation using a separate validation dataset is warranted before integrating these biomarkers into routine diagnostic and prognostic practices. Although achieving complete uniformity in sampling during the acute phase is challenging due to clinical constraints, future studies should adopt stricter, time-standardized sampling protocols and evaluate the impact of sampling time to improve the reliability of biomarkers for assessing TBI severity. In addition, time-resolved sampling (e.g., multiple time points or continuous monitoring) will be critical to identifying dynamic metabolic shifts during the acute and subacute phases.
5. Conclusions
NMR-based metabolomics, coupled with multivariate analysis, emerges as a valuable tool for pinpointing biomarkers within circulating metabolites of TBI patients, potentially enhancing the ability to differentiate TBI severity. Future investigations must prioritize the validation of these findings in larger cohorts and elucidate the temporal dynamics of these biomarkers, spanning from the acute to subacute and chronic phases of injury. Such insights hold the potential to unveil targets for therapeutic intervention.
Ethics Statement
The First Affiliated Hospital of Wannan Medical College provided approval for human subject participation (no. WNMC-AWE-2023045).
Consent
All participants provided written informed consent prior to entering the study.
Conflicts of Interest
The authors declare no conflicts of interest.
Author Contributions
Huan Zhou and Dongdong Sun contributed equally to this work.
Funding
This project was funded by the National Natural Science Foundation of China (22304131 and 82405142), the Anhui Provincial Natural Science Foundation (1908085QH342), the Scientific Research Fund of Wannan Medical College (WK202205 and WK2022F22), the Anhui University Scientific Research Project (Natural Science Key Project) (2023AH051750), the National College Students’ Innovation and Entrepreneurship Training Program Project (202210368013 and 202210370156) and the Anhui Provincial College Students’ Innovation and Entrepreneurship Training Program (S202210368049 and 202010370204), and the Open Project of Guangxi Key Laboratory of Precision Medicine in Cardio-Cerebrovascular Diseases Control and Prevention (GXXNXG202102).
Supporting Information
The figures and table that are used to support the findings in this research are included in the Supporting Information word file.
Open Research
Data Availability Statement
The data are available upon request. The raw 500 MHz NMR data were stored at the metabolomic data repository platform of Metabolomics Workbench (Data Track ID 4961).