Volume 2025, Issue 1 3956474
Research Article
Open Access

An Ultrawideband Stacked Structure Metasurface Incorporating Rotational Slots for the Reduction of Backward RCS

Boli Su

Boli Su

School of Electronic and Information Engineering , Beijing Jiaotong University , Beijing , China , njtu.edu.cn

Hebei Key Laboratory of Seismic Disaster Instrument and Monitoring Technology , Institute of Disaster Prevention , Sanhe , Hebei , China , fzxy.edu.cn

Search for more papers by this author
Ke Guan

Corresponding Author

Ke Guan

School of Electronic and Information Engineering , Beijing Jiaotong University , Beijing , China , njtu.edu.cn

State Key Laboratory of Advanced Rail Autonomous Operation , Beijing Jiaotong University , Beijing , China , njtu.edu.cn

Search for more papers by this author
An Qian

An Qian

Hebei Key Laboratory of Seismic Disaster Instrument and Monitoring Technology , Institute of Disaster Prevention , Sanhe , Hebei , China , fzxy.edu.cn

Search for more papers by this author
Jianxian Cai

Jianxian Cai

Hebei Key Laboratory of Seismic Disaster Instrument and Monitoring Technology , Institute of Disaster Prevention , Sanhe , Hebei , China , fzxy.edu.cn

Search for more papers by this author
Lanying Zhao

Lanying Zhao

Hebei Key Laboratory of Seismic Disaster Instrument and Monitoring Technology , Institute of Disaster Prevention , Sanhe , Hebei , China , fzxy.edu.cn

Search for more papers by this author
First published: 12 April 2025
Academic Editor: Anil Kumar Gautam

Abstract

In this letter, an ultrawideband stacked structure metasurface is designed to minimize the backward RCS across a frequency range of 5–40 GHz. The stack structure design demonstrated a maximum RCS reduction at 19 GHz, achieving an impressive reduction of 18.11 dBsm compared to a PEC of the same dimensions. The proposed metasurface exhibits the capability to scatter incident plane waves in various directions under both normal and oblique incidence conditions. Additionally, the calculated quantized encoding phase can facilitate further RCS reductions of 3–6 dBsm within the frequency range of 8–25 GHz. Consequently, this work effectively designs and promotes research on low RCS metasurfaces across different frequencies.

1. Introduction

Reducing the radar cross-section (RCS) is vital for stealth aircraft, enhancing key features such as stealth capability, low observability, high survivability, improved strike effectiveness, and information superiority. RCS measures a target’s ability to reflect radar signals. Metasurfaces applied in tasks, such as orbital angular momentum [1, 2], polarization conversion [35], and scattering RCS reduction [6, 7], offer the potential to reduce the reflection of electromagnetic waves or the backward RCS of a target.

Several RCS reduction technologies have been developed, such as phase cancellation technology [810], artificial magnetic conductor structure [11, 12], polarization conversion [1316], and resistance absorbing technology [17]. Stacked intelligent metasurfaces have recently emerged as a promising technology in the field of integrated sensing and communications [18]; however, their potential applications in stealth or RCS reduction remain unexplored.

This letter presents a novel low RCS metasurface that combines rotational slot meta-atoms with a stacked structure metasurface. The rotational slot meta-atom enables broadband phase shift curves through rotation, facilitating easier meta-atom design without the need for extensive simulations. The resulting metasurface consists of a 10-layer stacked structure that generates multiple outgoing beams in various directions. Extensive simulations and analyses of bistatic and monostatic RCS validate the effectiveness of the proposed design.

2. Theoretical Analysis of Stack Structure Metasurface

2.1. Meta-Atoms With Rotational Slots

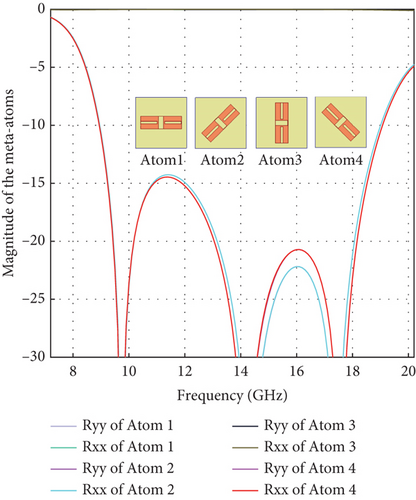
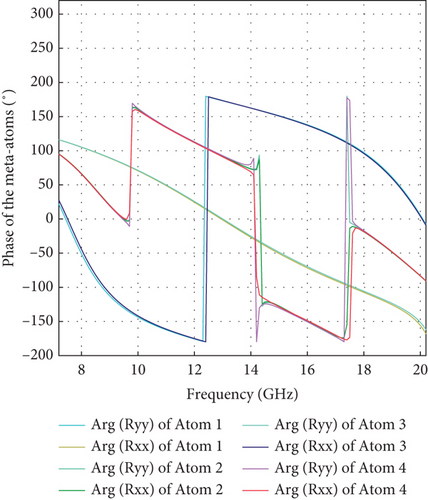
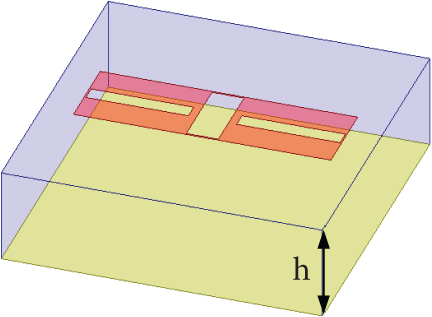
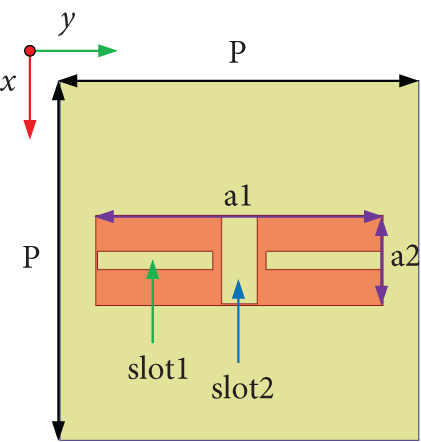
A dielectric material, F4BM265 with a relative permittivity (εr = 2.65, tanδ = 0.0015), serves as substrate. The design is tailored to the Ku-band, with the period of the meta-atom’s period chosen to be about half the wavelength of free space (λ0 = 20mm) at 15 GHz. The simulation of the meta-atom with rotational slots is conducted using the periodic boundary condition, and the meta-atom is shown in Figure 1. The meta-atom is located on the top of a substrate with a perfect electric conductor (PEC) ground at the bottom. The meta-atom undergoes a counterclockwise rotation of 0° about the Z-axis to obtain Atom1, followed by rotations of 45°, 90°, and 135° to obtain Atom2, Atom3, and Atom4, respectively. The results are shown in Figure 2; Atom1 and Atom3 showcase a notable reflection coefficient, while Atom2 and Atom4 exhibit a low value.
Details are in the caption following the image
(a) Side view and (b) top view of the meta-atom, where a1 = 8 mm, a2 = 2.5 mm, P = 10 mm, and h = 3 mm, and the dimensions of Slot1 are 3.2 mm and 0.5 mm and, similarly, for Slot2 are 2.4 mm and 1 mm.
Details are in the caption following the image
(a) Side view and (b) top view of the meta-atom, where a1 = 8 mm, a2 = 2.5 mm, P = 10 mm, and h = 3 mm, and the dimensions of Slot1 are 3.2 mm and 0.5 mm and, similarly, for Slot2 are 2.4 mm and 1 mm.
Details are in the caption following the image
Simulated performance of the rotation slot meta-atoms: (a) the magnitude of the meta-atoms and (b) the phase of the meta-atoms.
Details are in the caption following the image
Simulated performance of the rotation slot meta-atoms: (a) the magnitude of the meta-atoms and (b) the phase of the meta-atoms.
Employing the Jones formalism [19] to analyze the incident and scattered fields of the meta-atoms with rotational slots, the reflected and incident fields are related by reflection coefficients in the reflected Jones matrix, as shown in (1). In Equation (1), the symbols Rxx, Ryy, Rll, and Rrr represent the copolarized reflection coefficients for x-, y-, left circularly, and right circularly polarized normal incidence, respectively. In addition, Rxy, Ryx, Rlr, and Rrl correspond to the cross-polarized reflection coefficients. The phase changes, denoted as e−2jkφ(e2jkφ), can be introduced by a meta-atom with a rotation angle of kφ, where kφ is the rotation angle of the meta-atom.
()
()

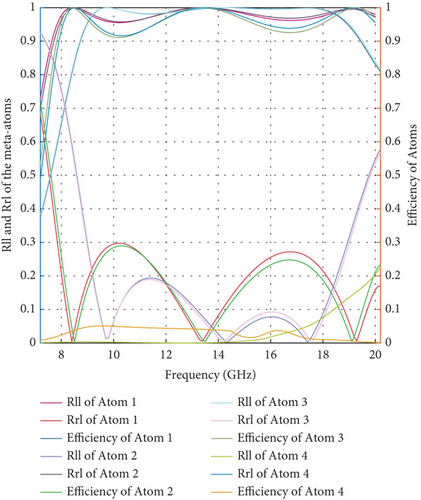
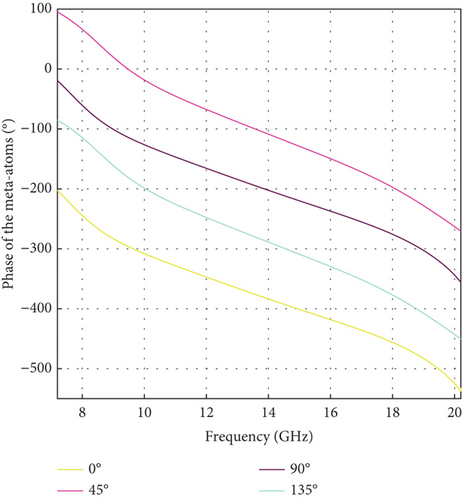
Figure 3 shows that the phase responses are almost paralleled as expected and that the copolarization reflection coefficients are consistently above 0.8 in the frequency range from 7.2 to 20.2 GHz. The polarization conversion efficiency is calculated by (2) to quantify the performance of the conversion, as depicted in Figure 3a. Atom1 and Atom3 exhibit high efficiency (efficiency > 0.91), while Atom2 and Atom4 demonstrate low efficiency.
Details are in the caption following the image
Reflection spectrum for the slot meta-atoms with different rotation angles under (a) circular polarization wave excitations. (b) The reflection phase of the meta-atoms.
Details are in the caption following the image
Reflection spectrum for the slot meta-atoms with different rotation angles under (a) circular polarization wave excitations. (b) The reflection phase of the meta-atoms.

2.2. Phase Design of Stack Structure Metasurface
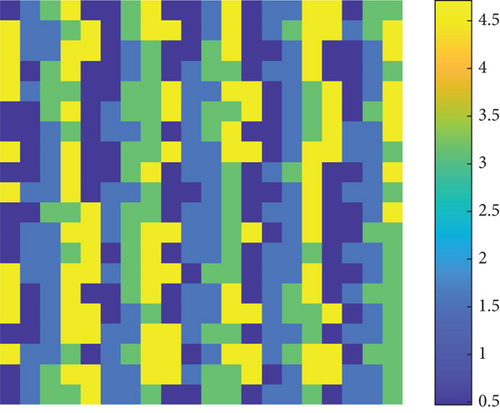
The initial construction of the metasurface phase distribution is based on Equation (3). The metasurface in question consists of 20 × 20 meta-atoms with a period denoted as P. The indices nx and ny denote the nth meta-atom along the row or column. The phase (SPx,y) for each element on the metasurface is calculated using Equation (3). The angle θ is fixed at 30°, while the angle φ is fixed at 90°. The randi function in (3) facilitates the introduction of a randomized phase distribution at 90°. The phase (SPx,y) is further quantified into discrete angles of 0°, 90°, 180°, and 270°, as shown in Figure 4. The design objective is to achieve dual beam in the direction (30°, 90°).
()
Details are in the caption following the image
Calculated phase distribution.

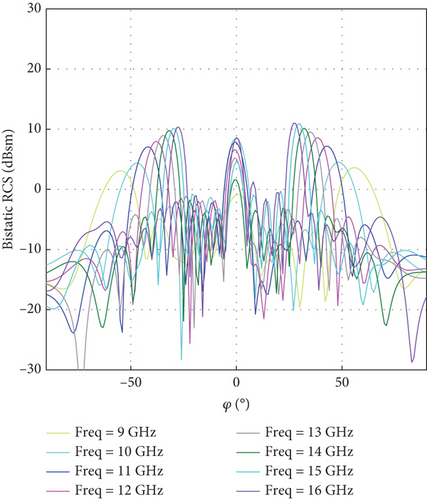
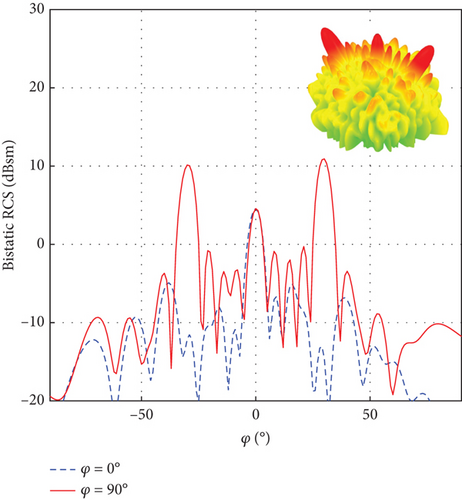
Figure 5a is the simulated bistatic RCS at 15 GHz, the exit angle theta of 30° exhibits a dual beam distribution, which aligns with the intended design. Figure 5b illustrates the bistatic RCS with an observation angle of φ = 90°, operating within the frequency range of 9–16 GHz. It should be noted that the beam exit angle will vary by 30° depending on the frequency.
Details are in the caption following the image
Simulated bistatic RCS for the initial 20-lattice metasurface at (a) 15 GHz and at frequency range from (b) 9 to 16 GHz.
Details are in the caption following the image
Simulated bistatic RCS for the initial 20-lattice metasurface at (a) 15 GHz and at frequency range from (b) 9 to 16 GHz.

2.3. Construction of the Stack Structure Metasurface

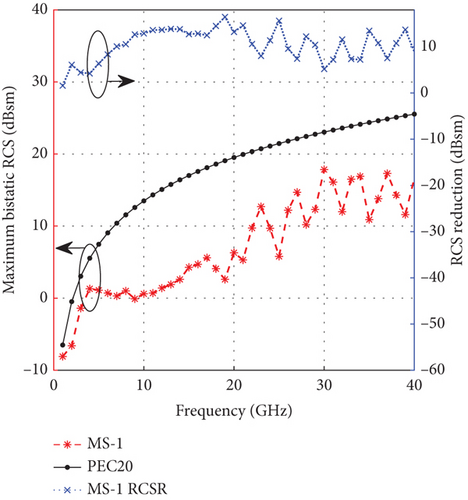
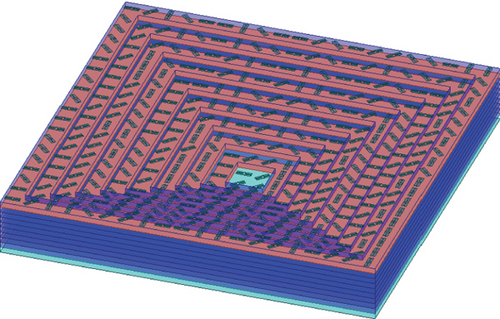
Figure 6a is the proposed stacked 20-lattice metasurface, named MS-1. The construction method involves raising each circle of metasurface elements by a height h1 (where h1 = h + 2∗ copper thickness) in the Z-axis direction, starting from the center and extending towards the four sides. Figure 6b depicts the simulated maximum bistatic RCS results for the 20-lattice metasurface under normal incidence conditions. Compared to a PEC of the same size, the MS-1 demonstrates its ultrawideband RCS reduction capabilities ranging from 5 to 40 GHz, achieving a maximum RCS reduction of 16.47 dBsm at the frequency of 19 GHz.
Details are in the caption following the image
(a) The proposed stacked 20-lattice metasurface, named MS-1. (b) Simulated bistatic RCS and RCS reduction.
Details are in the caption following the image
(a) The proposed stacked 20-lattice metasurface, named MS-1. (b) Simulated bistatic RCS and RCS reduction.

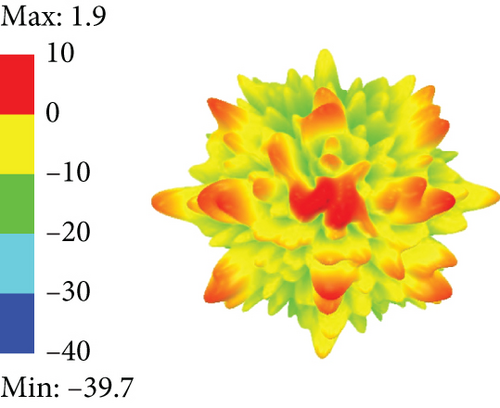
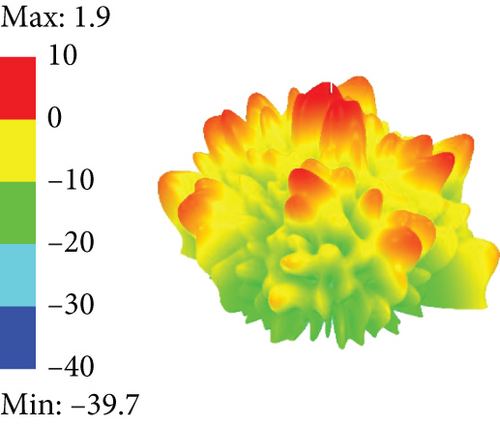
Figure 7 is the normalised three-dimensional scattering patterns of MS-1 and PEC surface at 13, 15, and 17 GHz. The comparison shows that MS-1 effectively reduces the RCS by scattering the incident wave in eight different directions, thereby minimizing backscattering.
Details are in the caption following the image
Normalised three-dimensional (3D) scattering patterns of MS-1 and PEC surface. At 13 GHz, (a) top view and (b) side view of MS-1 and (c) side view of PEC surface. At 15 GHz, (d) top view and (e) side view of MS-1 and (f) side view of PEC surface. At 17 GHz, (g) top view and (h) side view of MS-1 and (i) side view of PEC surface.

3. Design of the Large Stack Structure Metasurface

3.1. Normally Incidence Simulation

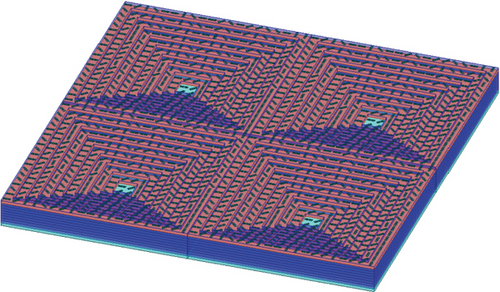
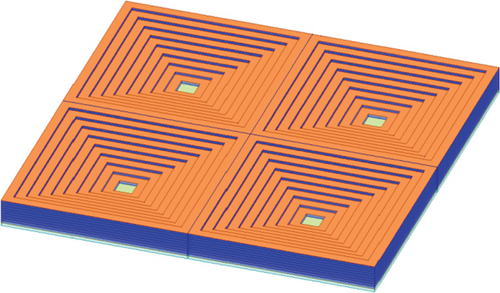
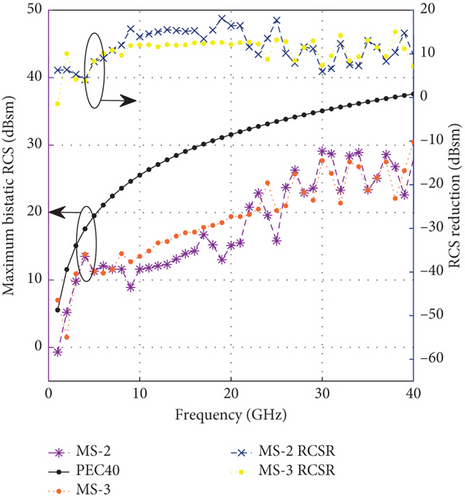
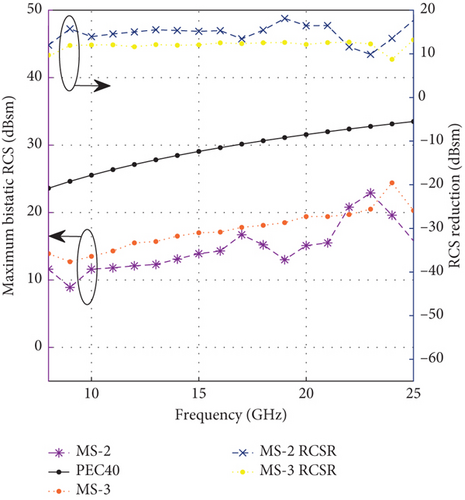
Figure 8a is the proposed large stacked 40-lattice metasurface, named MS-2. It consists of four stacked 20-lattice metasurface. Figure 8b is the stacked PEC surface, named MS-3. The construction method is that the top metasurface atoms in Figure 8a are replaced by a rectangular PEC surface with period P. Figure 8c depicts the simulated maximum bistatic RCS and RCS reduction under normal incidence conditions. MS-2 demonstrates its ultrawideband RCS reduction capabilities ranging from 5 to 40 GHz. In addition, compared to MS-3, the MS-2 demonstrates its further RCS reduction capabilities ranging from 8 to 25 GHz, achieving a maximum RCS reduction of 18.11 dBsm at the frequency of 19 GHz. Figure 8d presents a detailed illustration of Figure 8c within the frequency range of 8–25 GHz, indicating that an additional reduction in RCS by 3–6 dBsm can be attained in MS-2 where the rotating slot element configuration satisfies the geometric phase conditions.

Details are in the caption following the image
(a) The proposed stacked 40-lattice metasurface, named MS-2. (b) The stacked PEC surface, named MS-3. (c, d) Simulated maximum bistatic RCS and RCS reduction.
Details are in the caption following the image
(a) The proposed stacked 40-lattice metasurface, named MS-2. (b) The stacked PEC surface, named MS-3. (c, d) Simulated maximum bistatic RCS and RCS reduction.
Details are in the caption following the image
(a) The proposed stacked 40-lattice metasurface, named MS-2. (b) The stacked PEC surface, named MS-3. (c, d) Simulated maximum bistatic RCS and RCS reduction.
Details are in the caption following the image
(a) The proposed stacked 40-lattice metasurface, named MS-2. (b) The stacked PEC surface, named MS-3. (c, d) Simulated maximum bistatic RCS and RCS reduction.

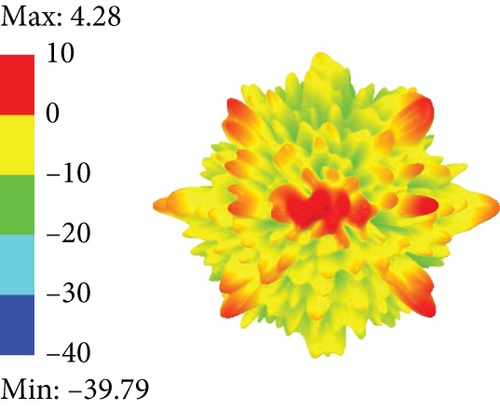
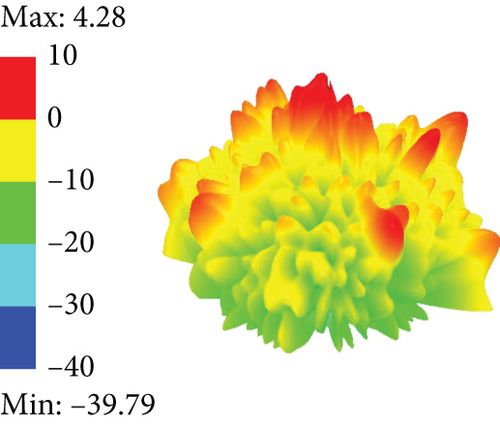
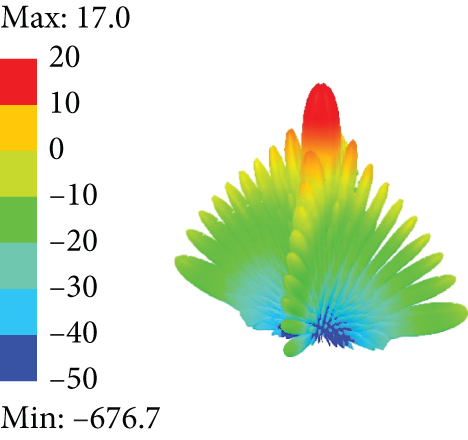
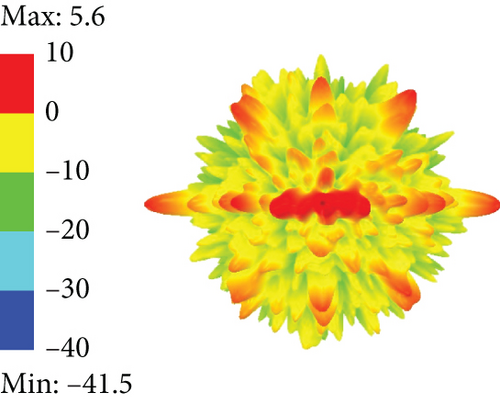
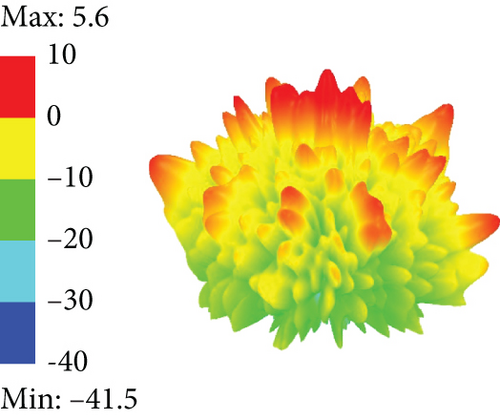
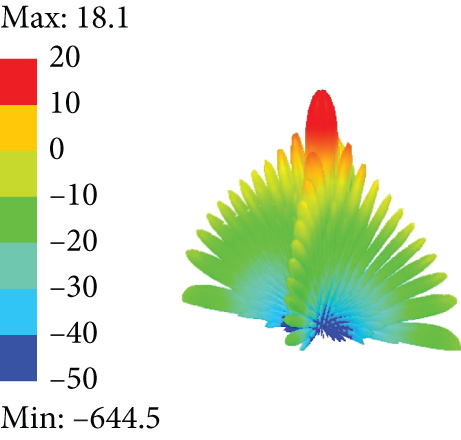
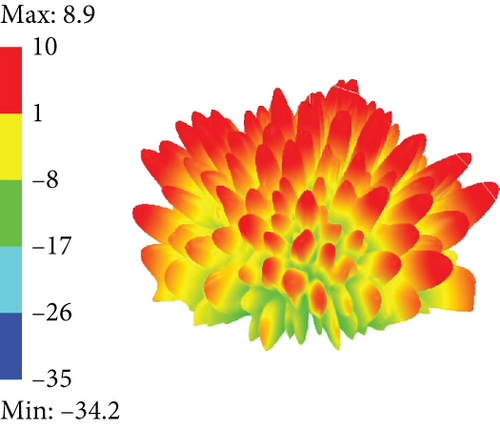
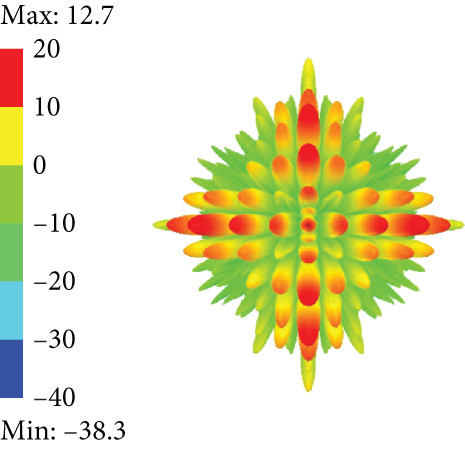
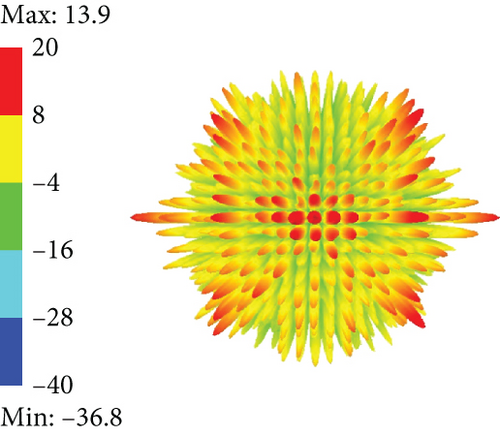
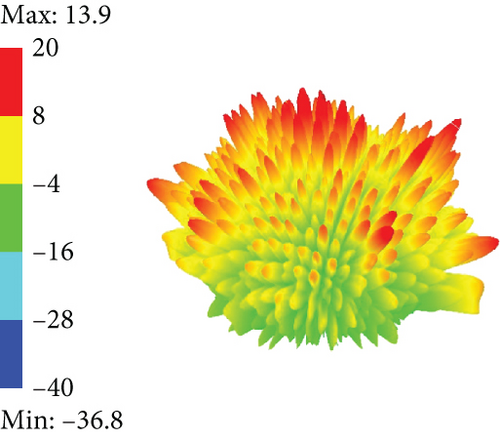
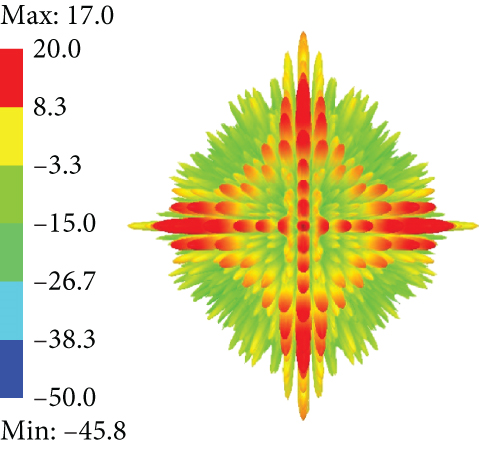
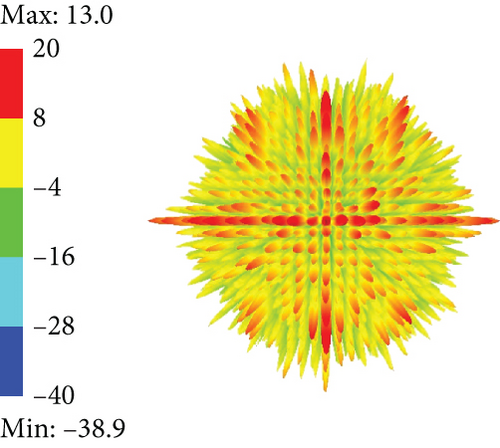
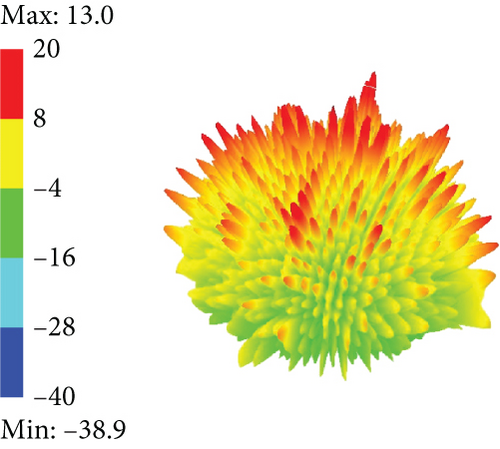
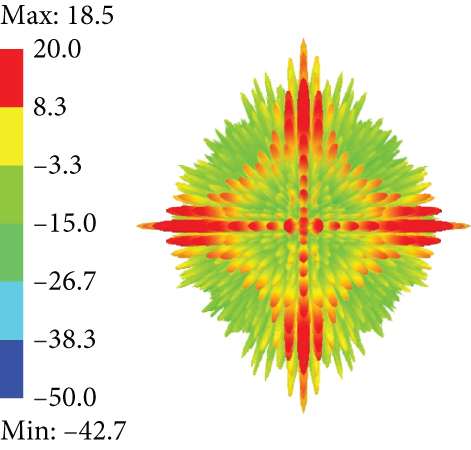
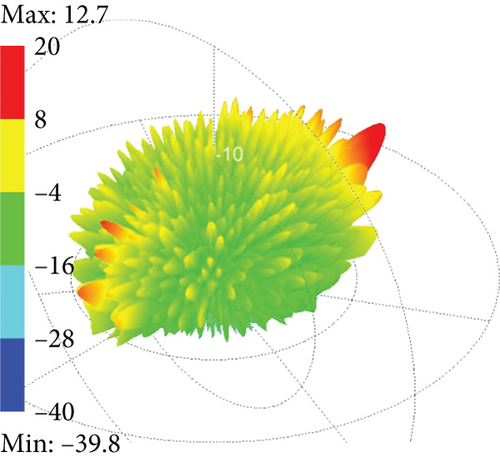
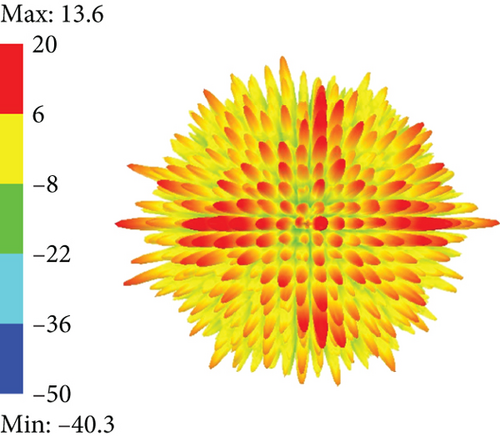
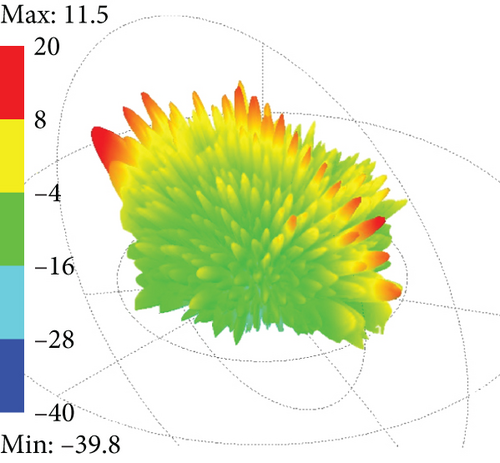
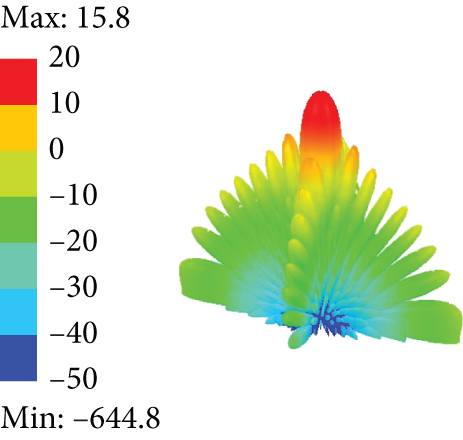
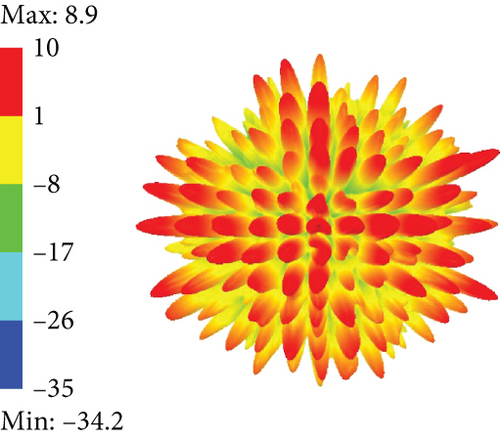
Figure 9 is the normalised 3D scattering patterns of the MS-2 and MS-3 surface at 9, 15, and 19 GHz. The comparison shows that MS-2 effectively reduces the RCS by scattering the incident wave in multiple directions, thereby minimizing backscattering. The maximum bistatic RCS values of MS-2 are 8.9, 13.9, and 13 dBsm. Figures 9c, 9f, and 9i are the 3D scattering patterns of MS-3. It can be seen that the MS-3 surface can only scatter beams in four main directions. The maximum bistatic RCS values of MS-3 are 12.7, 17, and 18.5 dBsm.
Details are in the caption following the image
Normalised 3D scattering patterns of MS-2 and MS-3. At 9 GHz, (a) top view and (b) side view of MS-2 and (c) side view of MS-3. At 15 GHz, (d) top view and (e) side view of MS-2 and (f) side view of MS-3. At 19 GHz, (g) top view and (h) side view of MS-2 and (i) side view of MS-3.

3.2. Oblique Incidence Simulation

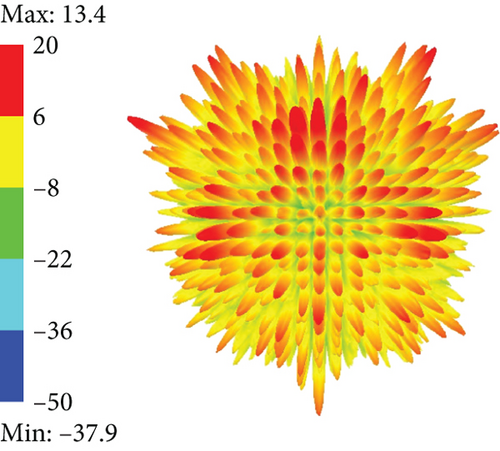
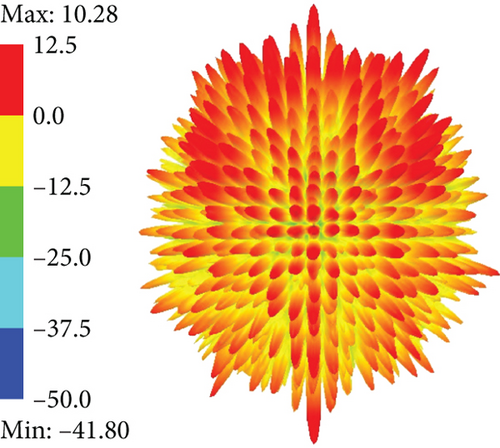
The RCS value for oblique incident waves is crucial for evaluating the scattering properties of a target, especially in the context of stealth considerations. Figure 10a,d reveals the scattered beams at oblique incidence conditions at 15 GHz with ϑ = 25°, where incident electromagnetic waves are scattered at different directions. Figure 10b,e reveals the scattered beams at oblique incidence conditions with ϑ = 50°, and Figure 10c,f reveals the scattered beams at oblique incidence conditions with ϑ = 75°. As the oblique angle of incidence ϑ increases, the primary scattered beams concentrate around (−ϑ, φ), as shown in Figures 10a, 10b, and 10c where φ = 0° or as shown in Figures 10d, 10e, and 10f where φ = 90°.
Details are in the caption following the image
Normalized 3D scattering patterns of MS-2 at 15 GHz. (a, b, c) At φ = 0° oblique incidence with elevation angles of ϑ = 25°, 50°, and 75°, respectively. (d, e, f) At φ = 50° oblique incidence with elevation angles of ϑ = 25°, 50°, and 75°, respectively.

3.3. Monostatic RCS Simulation

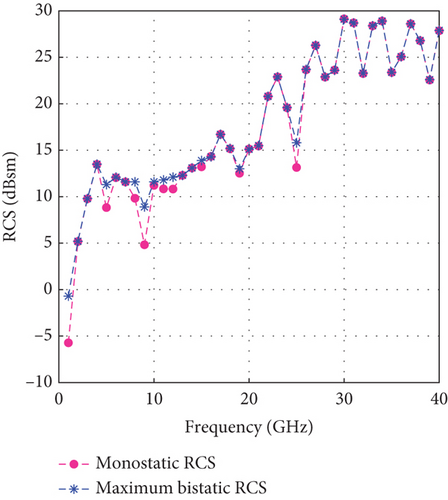
In practical applications, the monostatic RCS is of utmost importance for the evaluation of the stealth characteristics of a target. The monostatic RCS simulation results of the MS-2 metasurface are presented in Figure 11, covering a frequency range from 1 to 40 GHz. The observations were made at an elevation angle of 0° and an azimuth angle of 0° and represented by a pink line. The maximum bistatic RCS is represented by a blue line. The monostatic RCS of this observation point differs from the maximum bistatic RCS at frequencies (1, 5, 8, 9, 11, 12, 15, 19, and 25 GHz), while other frequencies exhibit almost similar values. Therefore, the testing process can be significantly simplified by solely examining the monostatic RCS of the observation point.
Details are in the caption following the image
Simulated monostatic RCS at ϑ = 0° and φ = 0° and the maximum bistatic RCS of MS-2.

Table 1 shows a comparison between the metasurface and some previous works. It is indicated that the metasurface has a strong RCS reduction capability in a frequency range from 8 to 40 GHz.

Table 1. Comparison of this work with previous work.
Ref. RCS reduction method OFB (GHz) RBW (fH/fL) Profile size( λL)
Gu et al. [8] Diffuse reflection 4.92–40 8.13:1 5.05 × 5.05 × 0.13
Murgesan et al. [15] Phase deviation 4.3–12.6 2.93:1 3.44 × 3.44 × 0.11
Zhang et al. [17] Resistive absorption 2.7–12.7 4.47:1 2.83 × 2.83 × 0.09
Lin et al. [13] Polarization rotation 9.2–46.2 4.8:1 5.52 × 5.52 × 0.125
Dai et al. [12] Circular sector structure 13.7–27.5 2:1 47.05 × 47.05 × 0.07
This work Stacked structure 8–40 5:1 10.67 × 10.67 × 0.8

4. Conclusion and Discussion

An ultrawideband stacked structure metasurface is proposed to achieve a significant anisotropic scattering response, composed of meta-atoms featuring rotational slots. A 20-lattice metasurface and a 40-lattice metasurface were designed and simulated using full-wave simulation software, demonstrating comparable RCS reductions. At 19 GHz, the incident plane wave exhibits a maximum RCS reduction of 18.11 dBsm. The phase designed according to Equation (3) is frequency-dependent, while the stacked structure metasurface remains frequency-independent, enabling an ultrawideband RCS reduction from 5 to 40 GHz. Simulations for normal incidence, oblique incidence, and monostatic RCS confirm the effectiveness of this design. Additionally, the MS-2 metasurface achieves an extra reduction in RCS by 3–6 dBsm compared with the stacked PEC surface within the range of 8–25 GHz. By integrating stacked structures with meta-atoms featuring rotational slots, this ultrawideband low RCS metasurface holds promise for various stealth technology applications.

Conflicts of Interest

The authors declare no conflicts of interest.

Funding

This research was supported by Hebei Key Laboratory of Resource and Environmental Disaster Mechanism and Risk Monitoring under Grant (number FZ248108) and the Self-Funded Project of Scientific Research of Hebei Department of Education under Grant (number ZC2023117).

Data Availability Statement

Data is available on request from the authors.

    The full text of this article hosted at iucr.org is unavailable due to technical difficulties.