Integrative Taxonomy of Ourapteryx Leach (Geometridae, Lepidoptera) Based on Molecular and Morphological Evidences
Abstract
Ourapteryx is widely distributed in the Palearctic and Oriental regions, with the highest species diversity found in China. As of 2024, 95 described species have been recorded globally; however, no comprehensive revision of this genus has been published. Identifying Ourapteryx species based solely on wing patterns is challenging due to their extreme similarity, often leading to frequent misidentifications and the oversight of cryptic species. In this study, we utilized 68 morphological species, along with 1050 COI sequences, to develop an integrative taxonomy for Ourapteryx. This taxonomy integrates morphological, molecular, distributional, and ecological evidences. Our findings identified nine candidate species (labeled as sp1–sp7, O. horishana and O. brachycerca), increasing the total number of recognized species from 68 to 77. Using this updated checklist, we compared four molecular delimitation methods against the outcomes of morphological taxonomy. The analysis indicated that a 2% threshold produced the highest efficiency. Additionally, we explored the reasons behind morpho-molecular discordance and the presence of hidden species. Our study underscores the importance and reliability of integrative taxonomy, which relies on multiple lines of evidence for accurate species identification and classification.
1. Introduction
Taxonomy is central and crucial to the fields of biology and biodiversity exploration [1–3]. It encompasses the science of characterizing, classifying, and naming taxa. Since the advent of Linnaean nomenclature in 1758, ~2.1 million species have been described and named worldwide, with nearly half of these being insects [4]. Before DNA barcoding became widespread, classical taxonomy based on the “lock and key” hypothesis was the predominant method for species classification [5–7]. This hypothesis posits that the morphology of insect genitalia is often species-specific [5], and it has been widely used to distinguish species [8] across various insect taxa, including moths [9, 10], katydids [11], and beetles [12, 13]. However, this hypothesis has faced considerable skepticism. Male genitalia often show significant divergences, and different genital morphologies do not always prevent hybridization. Rapidly evolving molecular taxonomy has, to some extent, bridged the gap left by morphological taxonomy [14–19]. With the increasing availability of COI data on public databases, such as the Barcode of Life Database (BOLD) and the National Center for Biotechnology Information (NCBI), molecular taxonomy has gained significant potential for rapid exploration of global biodiversity [20]. Consequently, integrative taxonomy, which combines molecular, morphological, ecological, and other types of evidence, has emerged as a powerful tool for efficient and accurate species classification [20–23].
Ourapteryx Leach, 1814 (Lepidoptera: Geometridae: Ennominae: Boarmiini) is a genus primarily distributed in the Palearctic (particularly East Asia) and Oriental regions [24]. It has the greatest species diversity in China [25–28]. For instance, Cheng et al. [27] recently described 11 new cryptic Ourapteryx species from China, significantly enhancing the genus’s species diversity in the country. The Himalaya and Hengduan Mountains (HHM) also include extreme species diversity of Ourapteryx. Taking Mêdog county (Xizang, China) as an example, seven species have been identified: O. linzhiensis Jiang & Cheng, 2024; O. aniqiaoensis Cheng & Zhu, 2024; O. motuoensis Cheng & Zhu, 2024; O. amphidoxa; O. pallistrigaria Stüning, 1994; O. margaritata Moore, 1868; and O. pallidula Inoue, 1985. Rajaei et al. [29] listed 83 Ourapteryx species globally. As of the present, ~95 described species have been recorded worldwide, and no comprehensive revision of the genus has been published.
The genus Ourapteryx can be easily distinguished from other genera by its distinctive morphological characteristics. Typical species of the genus are characterized by white wings marked with straight, grayish brown transverse lines, an elongated forewing discal spot, a swallowtail-like shape of the hindwing tail on vein M3, and an asymmetrical furca in the male genitalia [24, 30–33]. However, distinguishing different species within Ourapteryx based solely on wing features is often challenging due to their close similarity. This difficulty frequently leads to misidentifications or the overlooking of hidden species [27].
For all these reasons, Ourapteryx serves as an excellent case for conducting integrative taxonomy and comparing morphological and molecular methods. To achieve credible and highly accurate taxonomic results, the authors examined the holotype specimens of all described species from institutions such as ZFMK, NHM, ZSM, and IZCAS. This involved detailed assessments of facies, genitalia, and sampling information. Notably, over a thousand specimens and more than 400 dissected genitalia slides from IZCAS were utilized. For the poorly studied Himalaya–Hengduan region, which is characterized by extremely high species richness, we added multiple Ourapteryx specimens.
In this study, we aimed to resolve the taxonomy of Ourapteryx by combining morphological, molecular, and other evidences. Our objectives included conducting revision work and adding new species, comparing different taxonomic methods, explaining morpho-molecular discordance, and compiling a comprehensive checklist of Ourapteryx species.
2. Material and Methods
2.1. Taxon Sampling
For the taxonomic analysis, we studied numerous Ourapteryx specimens in various museums, with all sampling sites indicated in Figure 1. The specimens used primarily come from the collections of the Institute of Zoology; Chinese Academy of Sciences, Beijing, China (IZCAS); the Zoologisches Forschungsmuseum Alexander Koenig, Bonn, Germany (ZFMK); the Bavarian State Collection of Zoology (ZSM); and the Natural History Museum, London, United Kingdom (NHM). We included all recognized valid Ourapteryx taxa, with the exception of O. infuscataria Boisduval, 1832. This species was excluded because we did not find any material at BMNH, ZFMK, or MNHN, and the original description is bizarre, lacking a figure.
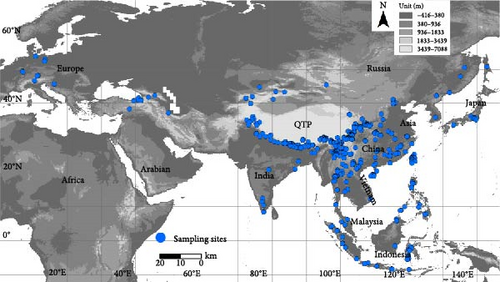
For the DNA barcoding analysis, most COI sequences were generated from specimens housed at IZCAS. Genomic DNA was extracted from leg samples obtained from specimens at IZCAS. The legs were preserved in 100% ethanol or dried. Sampling was typically restricted to a few vouchers per species. A total of 771 barcodes for Ourapteryx species from IZCAS and 290 barcodes downloaded from BOLD and NCBI were included in this study. Several Sirinopteryx species were selected as the outgroup. A detailed list of all the taxa in this study with the sequence IDs, sampling sites and dates, accession numbers in GenBank, and process IDs in BOLD is provided in Supporting Information 1: Appendix S1.
2.2. Morphological Studies
The terminology for wing venation follows the Comstock–Needham system, and that of the genitalia is based on Pierce [34], Klots [35], and Nichols [36]. Photographs of the moths were taken with digital cameras. Composite sharp images were generated using Auto Montage software version 5.03.0061 (Synoptics Ltd). The plates were compiled using Adobe Photoshop software.
2.3. DNA Barcoding Analysis
DNA extraction was done using Qiagen DNeasy Blood and Tissue Kit (Qiagen, Beijing, China). The primers for the amplification of the 658 bp fragment of COI gene were LepF1 (5′-ATTCAACCAATCATAAAGATATTGG-3′) and LepR1 (5′-TAAACTTCTGGATGTCCAAAAAATCA-3′)GTCCAAAAAATCA-3′) [18]. The PCR reactions were performed using the standard procedure described by Hebert et al. [18]. The PCR products were detected by 1% agarose gel electrophoresis and directly sequenced with ABI PRISM 3730xl capillary sequencers. Forward and reverse nucleotide sequences were assembled in Chromaspro. The assembled sequences were aligned and manually edited in MEGA 6.0 [37]. Most DNA barcodes (sequence ID begins with “IOZLEPM”) were obtained from IZCAS; other DNA barcodes were obtained from the BOLD website.
The extent of sequence difference within and between species was calculated by averaging pairwise comparisons of sequence difference across all individuals. The quantification of sequence divergences was conducted using the Kimura two-parameter (K2P) model method in MEGA 6 [37, 38] including all sites, with the pairwise deletion option, and assuming both a homogeneous pattern of divergence among lineages and a uniform rate of substitutions among sites. A neighbor-joining (NJ) tree [39] was reconstructed, based on the aligned sequences. One thousand bootstrap replications were calculated to assess the credibility of the NJ analysis.
2.4. Molecular Species Delimitation Analyses
In the present study, to compare morphological taxonomy and molecular taxonomy, the following nucleotide distance-based and tree-based molecular species delimitation methods were adopted: (i) the 2% nucleotide distance threshold proposed by Hebert, Ratnasingham, and De Waard [15]; (ii) ABGD [40]; (iii) ASAP [41]; and (iv) the 3% nucleotide distance threshold proposed by Hebert et al. [16].
ABGD analyses were run using the program web interface (https://bioinfo.mnhn.fr/abi/public/abgd/) with the following settings: K2P nucleotide substitution model [38] to infer the nucleotide distance; relative gap width of 1.5, when gap was not found using this value and a width of 1 or 0.5 was set; and prior P ranging from 0.001 to 0.1 and the remaining parameters were left as default. ASAP analyses were run using the program web interface (https://bioinfo.mnhn.fr/abi/public/asap/asapweb.html); K2P was selected as nucleotide substitution model; and other parameters were left as default. ASAP delimitation was defined evaluating both the partitions with first and the second best ASAP score according to Puillandre, Lambert, Brouillet, and Achaz [40]. Partition with lowest scores was chosen.
Based on Magoga, Fontaneto, and Montagna [42], the delimitation results obtained for each analysis were compared to the identity of the morphological species and classified in the following categories: (i) match, all the sequences of the same morphological species were delimited as belonging to the same unit; (ii) split, the sequences of a species are delimited as belonging to two or more units; (iii) merge, the sequences of two or more species are included the same unit; and (iv) mixture, some sequences of a species are split while others are merged.
2.5. Phylogenetic Analysis
The phylogenetic relationships of Ourapteryx in this study were reconstructed using IQ-TREE [43] and MrBayes 3.1.2 [44]. The close related genus Sirinopteryx were chosen as outgroup.
The maximum likelihood (ML) tree was reconstructed using IQ-TREE (http://www.iqtree.org) with default settings. Support for nodes was estimated using 1000 replicates of ultrafast bootstrapping [45]. This method calculates the tree with the best likelihood, and prior to the calculation, it tests for an appropriate substitution model based on the Akaike information criterion (AIC, [46]).
For Bayesian inference analysis, the best fit model of nucleotide substitution was selected for each gene using jModelTest 0.1.1 [47]. Two independent parallel runs of four incrementally heated Metropolis-coupled Monte Carlo Markov chains (MCMCs) were run for 50 million or more generations, with trees sampled every 1000 generations, until the average standard deviation of the split frequencies was <0.01. The first 10% of generations was discarded as burn-in when summarizing tree results. Convergence of the MCMC results was verified in tracer 1.6 [48].
3. Results
3.1. Species Delimitation and Taxonomic Changes Based on Integrative Data
A NJ tree based on 1061 COI sequences from 68 Ourapteryx morphological species was constructed with high support values (Figure 2). Three clusters (I, II, and III) were identified. Cluster I included eight morphological species, primarily distributed in Southeast Asia and Southern China. Cluster II included one unnamed species (sp1) from Yunnan, China. Cluster III included the remaining 60 morphological species, with half (34/60) distributed in the HHM and adjacent regions. One of the most important distinguishing feature within Ourapteryx is the size, breadth, length, and shape of the furca in the male genitalia, which varies substantially between the three clusters: Cluster I included species with the furca on the left side or with a juxta lacking a furca; Cluster II included one species with a furca positioned centrally; and Cluster III included the remaining species with the furca on the right side.
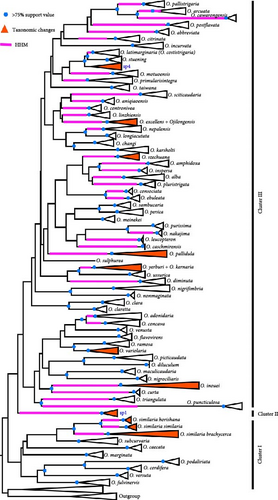
Compared with the NJ tree, the phylogenetic trees of COI (Supporting Information 1: Figure S1) showed very different phylogenetic structure. Cluster I was divided into two clades on the ML tree and still located at the root. Cluster II was embedded within Cluster III. Although failing to obtain reliable phylogenetic structure, the cluster results of species groups owing cryptic species are congruent with NJ tree and phylogenetic results, for example, O. cawarongsis Cheng & Jiang, 2024 + O. arcuata Jiang & Cheng, 2024, and O. nepalensis Inoue, 1995 + O. longiacutata Jiang & Cheng, 2024. Considering the morphological evidences, we still use the results of NJ tree.
The mean interspecific genetic distances between different morphological species and the mean intraspecific genetic distances within each morphological species are shown in Supporting Information 2: Appendix S2. The largest interspecific distance (17.5%) occurred between O. caecata (Bastelberger, 1911) and O. cawarongsis, whereas the smallest distance (2.2%) occurred between O. stuening Inoue, 1993, and O. latimarginaria Leech, 1897. Some other genetic divergences of species pairs are between 2% and 3%, including O. kernaria Oberthür, 1893, and O. yerburii Butler, 1886 (2.4%); O. ebuleata Guenée, 1858, and O. consociata Inoue, 1993 (2.7%); O. purissima Thierry-Mieg, 1905, and O. nakajima Inoue, 1995 (2.8%); O. sambucaria (Linnaeus, 1758) and O. persica Ménétriés, 1832 (2.5%); and O. longiacutata and O. nepalensis (2.9%).
For ASAP results, 70 subsets with lowest scores (3.0) with p-value (1.67e-02) were selected as the reliable result, with a threshold distance of 2.35%. For ABGD, an initial partition of 72 groups was chosen, with a prior maximal distance p-value (1.29e−02), and a barcoding gap distance of 2.0%.
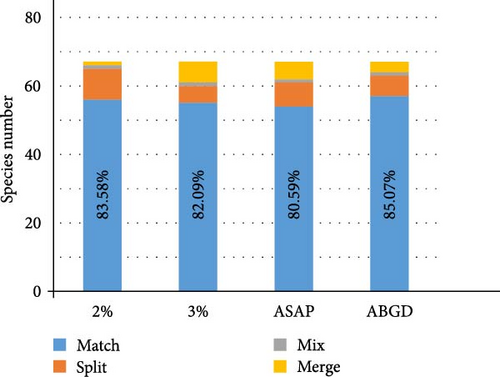
Combining the morphological and molecular evidence, we created nine candidate species (sp1–sp7, O. horishana Matsumura, 1910, and O. brachycerca Wehrli, 1939), increasing the species count from 68 to 77. Morphological species for which no taxonomy changes are proposed are labeled at Figure 2. The remaining morphological species, which may undergo taxonomic changes, are provided with an NJ tree and photos of adults and male and female genitalia. Based on the previous checklist of Ourapteryx and the new one provided in this study, we calculate the success percentage of each species delimitation method (Figure 3). Compared to the initial 68 morphological species, the four delimitation methods showed similar percentage of matches (80.59%–85.07%). Specifically, ABGD had the highest match percentage (85.07%), followed by the 2% threshold (83.58%), the 3% threshold (82.09%), and ASAP (80.59%). With reference to the resulting 77 species, all were supported by morphological evidences except O. szechuana. Among the four delimitation methods, the 2% threshold showed the highest match percentage (96.10%), followed by ABGD (92.21%), ASAP (88.31%), and the 3% threshold (84.41%).
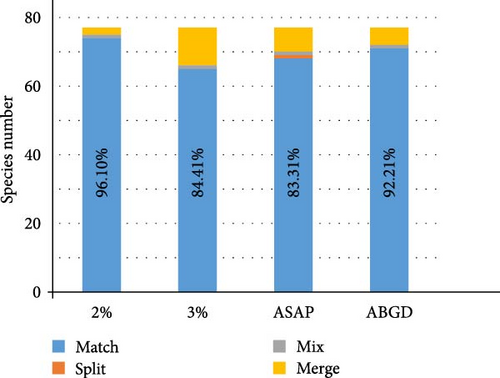
In the following sections, we examine the incongruences between the results of the four different species delimitation methods and those from morphology. Multiple species groups are involved in these comparisons.
3.1.1. Cryptic Candidate Species Supported by Integrative Evidence
3.1.1.1. Sp1 (Cluster II)
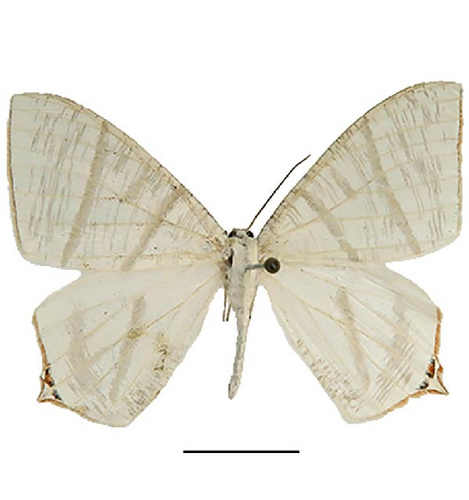
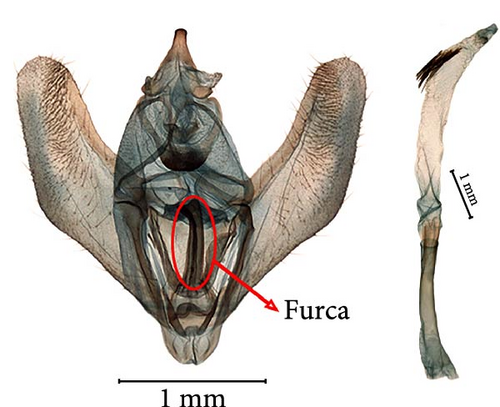
On the NJ tree, Cluster II includes only one species (sp1) with no closely related species and is the sister clade of Cluster III (Figure 2). The validity of sp1 as an independent species is supported by morphological and molecular evidence (2%, 3%, ASAP, and ABGD). The lowest genetic distance between sp1 and other species is 7.1%. This species can be easily distinguished based on the unique furca in the male genitalia (indicated by an arrow in Figure 4): it is developed in the middle and short and does not reach the median process of the gnathos. The ventral surface of the furca features a spinose band and a short row of thorns at the apex. Additionally, the aedeagus is long and thin, corresponding to the long ductus bursae in the female genitalia.

3.1.1.2. O. inouei Group
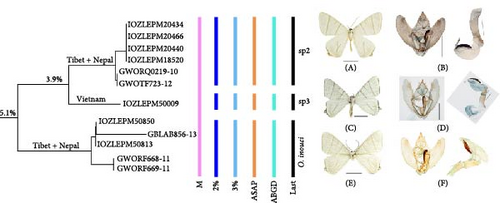
On the NJ tree, this group included three molecular lineages: sp2, sp3, and O. inouei Stüning, 2000, with genetic distances of 3.9% and 5.1% between them, respectively (Figure 5). Four species delimitation methods supported the treatment of the three lineages as independent species. Sp2 is distributed in the Shannan region (Xizang, China) and Nepal; sp3 is distributed in Vietnam; O. inouei is distributed in Jilong county (Xizang, China) and Nepal. Despite general similarities in wing patterns, male genitalia, and distribution ranges, which have led to their treatment as a single species, molecular evidence suggests the presence of morphological differences between the three lineages. For example, the shape of the forewing, the size of the hindwing tails, and the sclerotized lateral protrusion on the left juxta in the male genitalia differ significantly between sp2 and the other two lineages; sp3 has the whitest wings, with distinct black transverse lines; the shape of the valva also differs between the three lineages.
3.1.1.3. O. latimarginaria Species Group
On the NJ tree, this group included three lineages: O. latimarginaria Leech, 1897; O. stuening Inoue, 1993; and sp4. O. latimarginaria and sp4 were originally considered to be one species due to their nearly identical wing patterns. Both lineages included two morphological types, a lighter type (typical and normal, previously treated as O. costistrigaria) and a darker type (IOZLEPM7600 and IOZLEPM6876) (Figure 6). Based on wing features and external morphology, it is very difficult to distinguish between these two lineages. However, incorporating molecular analysis provides a clearer distinction. O. latimarginaria and sp4 can be differentiated by their distribution ranges and specific details of the male genitalia: the former is distributed in Sichuan, Hubei, Shaanxi, Gansu, Henan, and Beijing, with a shorter furca that is curved into a right angle at its terminal end; the latter is distributed in Guangxi, China, with a longer furca that is straighter at its terminal end (IOZLEPM7669).
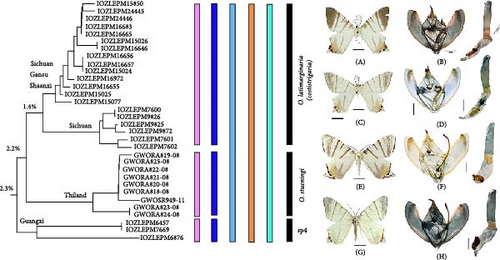
In O. stuening, the male forewing length can reach up to 37–38 mm, potentially making it the largest species in this genus. This feature alone makes it easily distinguishable from O. latimarginaria and sp4. Other distinguishing morphological features include a longer furca in the male genitalia, broader and more distinct transverse lines in the forewing, and a different distribution pattern of black dots on the hindwing. Additionally, O. stuening is allopatric with the other two species, with records from Thailand and Vietnam.
3.1.1.4. O. pallidula Species Group
On the NJ tree (Figure 7), two new clades (sp5 and sp6) have been differentiated from O. pallidula Inoue, 1985. The validity of these branches as separate species was supported by a 2% genetic distance and the ABGD methods. O. pallidula sensu lato has a wide range and was divided into four subclades: the Taiwan subclade, the Nepal subclade, the southern China subclade (Xizang, Yunnan, Sichuan, and Guangdong), and the Vietnam subclade. Sp5 included three specimens from Tacheng, Yunnan, China. Sp6 included three specimens from the Qinling Mountains, Shaanxi, China. The morphological differences between these three clades are evident, particularly in wing pattern, transverse lines, furca, valva, signum, and ductus bursae. For example, sp5 has broader and more prominent transverse lines on the wings, a thicker furca sclerotized at its terminal part, a smaller signum, and a thinner ductus bursae. Sp6 is similar to sp5 but differs in the following characters: the transverse lines on the wings are narrower; in the male genitalia, the valva has a protrusion in the middle, and the aedeagus is slender. The female genitalia have a thicker ductus bursae and a larger signum.

3.1.1.5. O. variolaria Species Group
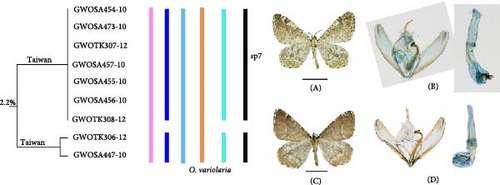
On the NJ tree (Figure 8), one new clade (sp7) was separated from O. variolaria Inoue, 1985. The validity of sp7 as a separate species was supported by 2% genetic distance and the ABGD methods. Both clades are distributed on Taiwan Island. The wing patterns of the males in both two clades are unique within Ourapteryx. Sp7 included specimens lacking the dense diffusion of dark grayish brown patches. There were some differences in the male genitalia: the valva of O. variolaria is narrower in the basal half, and more sharply curved in the apical half, and the aedeagus is narrower at the base.
3.1.2. Morphological Species Not Supported by Molecular Delimitation Methods
3.1.2.1. O. yerburii Butler, 1886, and O. kernaria Oberthür, 1893
On the NJ tree (Figure 9), a monophyletic group of O. kernaria was embedded within a nonmonophyletic group of O. yerburii. This arrangement suggested that the classification of O. kernaria as a separate species is not supported by total delimitation methods. However, O. kernaria can be easily distinguished from O. yerburii by its morphological features, such as the black dots covering its wings, a smaller wing size, and the specific form of the male genitalia’s furca (Figure 9). The overlapping distribution of these species, with O. kernaria found in Yunnan and Sichuan, and O. yerburii having a broader range including these areas as well as parts of South China, India, Nepal, and Pakistan, further complicates the distinction. Additionally, O. kernaria is typically found at higher altitudes (>2000 m), while O. yerburii is found at lower altitudes (500–2100 m). Considering the collective evidence, we conclude that O. kernaria should be recognized as an independent species

3.1.2.2. O. excellens Butler, 1889, and O. jilongensis Mi et al. [49]
O. excellens and O. jilongensis demonstrate significant morphological differences, including distinct wing coloration—O. excellens with yellow wings and O. jilongensis with white wings—and differences in the wing patterns, male genitalia furca, and valva structure (Figure 10). The relatively low genetic divergence of 1.7% does not support O. jilongensis as a separate species based on molecular delimitation methods. Moreover, these two species have allopatric distributions: O. excellens is primarily found in Pakistan, and O. jilongensis is only distributed at Jilong, Xizang, China. Based on integrative taxonomy, we support the recognizing O. jilongensis as a valid species.

3.1.3. Position of Subspecies
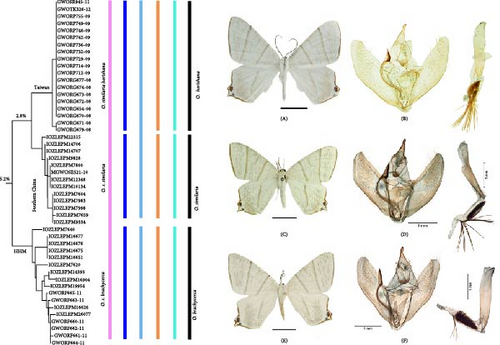
In previous studies, O. similaria was considered as including three subspecies: O. s. similaria (Leech, 1897), O. s. horishana Matsumura, 1910, and O. s. brachycerca Wehrli, 1939. Our NJ tree analysis supported the recognition of O. s. horishana and O. s. brachycerca as independent species based on a 2% genetic threshold, ASAP and ABGD (Figure 11). These species can be distinguished by the following characters: the wing transverse lines of O. s. similaria are more brownish; the broadened apex of the furca is much longer in O. s. similaria and O. s. brachycerca; and the median process of the gnathos is broader terminally in O. s. brachycerca. In the female genitalia, the marginal spines of the signum are slender, while they are stouter and fewer in number in O. s. similaria and O. s. brachycerca; the anterior marginal spines are longer than the others in O. s. horishana, while they are almost equal in length in O. s. similaria and O. s. brachycerca. Based on this evidence, we propose to restore O. s. brachycerca and raise O. s. horishana to specific status as O. brachycerca and O. horishana.
3.1.4. Variable Morphological Features
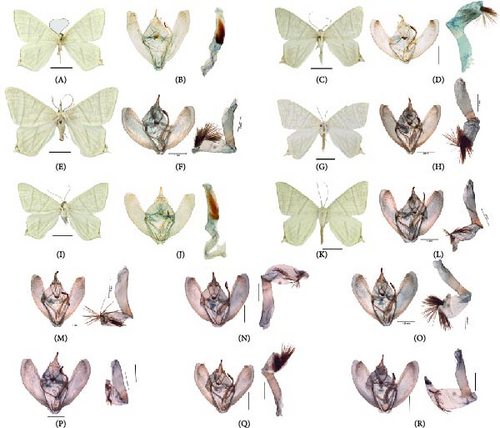
O. szechuana Wehrli, 1939, a widely distributed species in the HHM, South and North China, Nepal, North Korea, and parts of Russia, can be found at altitudes ranging from 180 to 3500 m, without showing significant genetic divergence in mtDNA or ncDNA [50, 51]. This is one of the most numerous and widespread species in Ourapteryx, and there are about 400 specimens stored at IOZCAS. To achieve an accurate taxonomy classification, we dissected 64 specimens (half with COI sequences) and obtained about 200 COI sequences. We observed significant variations in the male genitalia and wing patterns of O. szechuana (Figure 12), which often align with the characteristics of closely related species, such as O. alba Cheng & Han, 2024; O. amphidoxa Wehrli, 1939; O. inspersa Wileman, 1912; and O. pluristrigata (Warren, 1888). For example, the specimen of Figure 12N–P resembles closely O. pluristrigata (Figure 12B), while the specimen in Figure 12O is more similar to O. amphidoxa (Figure 12F) than O. szechuana based on the shape and length in the male genitalia furca. This illustrates the challenges in species identification based solely on morphological features.
4. Discussion
4.1. Ourapteryx Taxonomy
In this study, we applied integrative taxonomy, which includes morphological and molecular methods, along with evidence derived from distribution and altitude, to reassess the status of Ourapteryx species. Throughout this process, a thorough morphological investigation was conducted [52–55]. Our research identified nine new candidate species (sp1–sp7, O. horishana, and O. brachycerca), thereby increasing the species count from 68 to 77. Cheng et al. [27] also described 11 new hidden Ourapteryx species from China, initially identified using molecular evidence. Finding such a significant number of new species is exceptional within the Ennominae and even the Geometridae. Based on this evidence, it is plausible to assume that more new and hidden species within Ourapteryx could be discovered with further molecular taxonomy. Therefore, obtaining COI sequences for more species will be crucial in completing the taxonomy of Ourapteryx. As Skou and Sihvonen [24] said, several species and groups require modern analysis using molecular methods, critical for their validation.
The presence of multiple hidden species in Ourapteryx can be attributed to both morphological and evolutionary features [19]. Firstly, Ourapteryx species exhibit similar external features and minor morphological differences, such as white body and wing colors, and similar wing patterns, dots, and tails [25, 30–33, 56–58]. Stüning [25] noted species richness, behind an extreme external similarity in the ebuleata group, and the shortage of sufficient material lead to species identification confusions. This confusion was also evident in misidentifications on the BOLD and NCBI databases [54], increasing the challenge of accurate species identification. After checking almost all known Ourapteryx species, the location, length, width, and shape of the furca in male genitalia were found to be the most effective traits for species identification beyond external features [27]. Hence, thorough dissections, including specimens with minor morphological differences and across the entire distribution range, are necessary during the description of new species and the review and distinguishing Ourapteryx species.
Secondly, Ourapteryx species are concentrated in several small areas (Figure 1), such as the HHM and Taiwan island [24]. For example, seven species have been identified in Mêdog. Such sympatric distribution added complexity to species identification. Many Ourapteryx species have narrow distribution ranges, exemplified by O. puncticulosa Inoue & Stüning, 1995, found only in the Qinling Mountain, while O. jilongensis is only found in Jilong, Xizang, China. Given this, comprehensive and detailed sampling is essential to cover the entire distribution range of a species or across regions where it is found. In this study, sp2 and sp3 were distinguished from O. inouei; sp3 included specimens only from Vietnam, whereas sp2 and O. inouei were sympatric in Xizang, China, and Nepal.
Thirdly, recent rapid evolutionary processes [19, 59, 60] may be contributing to the diversity of Ourapteryx. Summarizing all the evidence, it is reasonable to infer that the diversification of Ourapteryx is connected with the diversification of the furca in the male genitalia. Ourapteryx species exhibit three types of furca: on the left, middle, and right. The furca of most species is on the right, which is congruent with Clade III on the NJ tree (Figure 2). A significant proportion of species within Clade III (34/60) was found at the HHM, suggesting these species are experiencing recent diversification induced by the uplift of the Qinghai–Xizang Plateau. Future research will analyze more genes to construct a robust phylogeny of Ourapteryx to test our hypothesis.
4.2. Species Delimitation of Ourapteryx
In our study, four molecular species delimitation methods (2% threshold, 3% threshold, ASAP, and ABGD) were applied to 68 known morphological species of Ourapteryx, yielding varying species counts and different threshold distances, as expected given their diverse principles and assumptions [48]. After integrative taxonomy, our study recognizes a system of 77 species. Among the delimitation methods tested, distance-based analyses showed the highest efficiency (Figure 3), with the 2% threshold (96.10%) slightly surpassing ABGD (92.21%), followed by ASAP (88.31%) and the 3% threshold (84.41%). The ABGD barcoding gap distance is also 2.0%, further supporting the 2% threshold’s highest efficiency. With increasing availability of molecular delimitation methods generating various results [61–63], different taxa often necessitate different methods, primarily dependent on morphological evidence [64]. Our findings align with studies where ABGD and ASAP demonstrate matching delimitation efficiency [65–67] and preference for the 2% threshold over the 3% threshold [42].
The 2% sequence divergence threshold, established by Hebert, Ratnasingham, and De Waard [15] for animal groups, has faced criticism for potentially overestimating species numbers [68–72]. This is illustrated by the aphid taxa Aphis and Illinoia, which exhibit divergences of less than 1% [73]; Lepidoptera may reach 3% [74], and whiteflies can diverge by up to 3.5% [75]. However, within Ourapteryx, the 2% threshold shows better efficiency than other thresholds [15]. This effectiveness may be enhanced by detailed morphological analyses, including reviewing all described species from multiple museums, acquiring molecular data, and gathering distributing and altitude information. Our study included many closely related species, which could reduce the lowest interspecific genetic distance. Given the varying evolutionary histories, mutation rates, or divergence times of different taxa, taxonomists should integrate all evidence and collaborate with biologists focusing on diversity, invasive species, population genetics, and biogeography to reach reliable taxonomic conclusions [15, 16, 72].
4.3. Incongruence Between Morphological and Molecular Taxonomy
Ideally, morphological and molecular taxonomy should be congruent, producing what is known as “good species” [76]. Yet, numerous studies have highlighted significant incongruence between these taxonomic approaches [77, 78], questioning the “lock and key” hypothesis, which relies on divergent male genitalia and the prevention of hybridization [6, 79–81]. In this study, we also identified species pairs with such incongruences and will explore the underlying reasons and mechanisms by examining representative species.
4.3.1. Budding Speciation
Budding speciation, often caused by incomplete lineage sorting, is a common reason for incongruence between morphological and molecular taxonomy [77, 82]. Based on this concept, species A should be embedded within a paraphyletic species B in the phylogenetic tree. In this study, the species pair O. yerburii and O. kernaria can be distinguished by markedly different external features and genitalia but cluster together in one clade on the NJ tree (Figure 9). Beyond the mixed phylogenetic structure, additional evidence are as follows: the distribution of O. kernaria (Yunnan and Sichuan) is a subset of that of O. yerburii (Yunnan, Sichuan, south China, South Asia); O. kernaria occupies relatively high altitudes (>2000 m), while O. yerburii occupies lower altitudes (500–2100 m). It is reasonable to infer that O. kernaria has possibly evolved from O. yerburii as an adaptation to high elevations. Species divergence due to altitude variations is common in the HHM, contributing to the region’s numerous endemic species living at high altitudes [77, 83]. In the context of budding speciation, morphological taxonomy is more effective than molecular taxonomy.
4.3.2. Hybridization
Hybridization is another important factor leading to incongruence between morphological and molecular taxonomy [78, 84]. Species that have experienced hybridzation or introgression may acquire other species’ morphological features, leading to misidentifications or hidden species [10, 27, 85–87]. This phenomenon has been confirmed to be widespread within Geometridae [88–90]. Within Ourapteryx, O. szechuana is one rare species with a wide distribution range (most of China, Nepal, North Korea, and Russia), adapting to altitudes from 180 to 3500 m, yet lacking genetic divergence in mtDNA and ncDNA [50, 51]. Conversely, the male genitalia (especially the furca) and wing pattern of O. szechuana show significant variations that overlaps with closely related species, such as O. alba, O. amphidoxa, and O. inspersa (Figure 12). Such variation in male genitalia is compelling evidence against the “lock and key” theory [6, 81]. Except obtaining some genes and features from other species and increasing genetic diversity [91], hybridization also can generate new taxa or result in the loss of genetic identity and eventual extinction of species [89, 92]
Additionally, mitochondrial introgression, when species gained alien mitochondria as a result of hybridization, is an important causes resulting into similar incongruence [93, 94], which is quite common in Lepidoptera and also was found in geometrid moths [88, 95]. The possible consequence is erroneous phylogenetic reconstructions based on mitochondrial DNA (e.g., DNA barcodes) alone. In the future, the phylogenetic tree of Ourapteryx using mitochondrial DNA and nuclear DNA, even genomes, is needed.
In addition, Wolbachia infection is another potential factor [88, 96]. Mitochondrial haplotypes can hitchhike along with the bacteria, leading to drastic changes in population structure of the mtDNA gene [97, 98]. For example, Cheng et al. [51] revealed that O. szechuana has a high infection rate of Wolbachia (60.45%), which can result in gene introgression through selective sweeps [99, 100]. Species with such complex evolutionary histories necessitate integrative taxonomy using multiple lines of evidence [10, 50, 85–87] to effectively explore biodiversity and delimit species.
4.3.3. Seasonal Dimorphisms
Seasonal dimorphism, seen in some Nymphalidae butterflies, is an important factor resulting in incongruence between morphological and molecular taxonomy within insects [101, 102], although it is rare in geometrid moths. This study found two morphological types (dark and light) in O. latimarginaria Leech, 1897, and O. taiwana Wileman, 1910, that occur at the same location and are unrelated to sex (Figure 6). Previously, the light type of O. latimarginaria was named as a junior synonym of O. costistrigaria Leech, 1897 [26], but it is now considered a possible seasonal morph due to its distribution range and occurrence time. Different seasonal types generally have different external features but similar genitalia.
Conflicts of Interest
The authors declare no conflicts of interest.
Author Contributions
Rui Cheng and Nan Jiang contributed equally to this work.
Funding
This study was supported by the Survey of Wildlife Resources in Key Areas of Tibet (Phase II, ZL202303601), by the Biological Resources Programme, the Chinese Academy of Sciences (CAS-TAX-24-003), and the National Nature Science Foundation of China (31660495, 32170464, and 32330013).
Acknowledgments
We gratefully thank all collectors for their assistance in Lepidoptera collection. We thank Sir Anthony Galsworthy, the Natural History Museum, London, UK, for giving valuable comments on the research and correcting the English language of the manuscript. We express our sincere thanks to the trustees and staff of the Natural History Museum, London, for allowing the examination of the material under their curation. We cordially thank Dr Axel Hausmann, Ulf Buchsbaum, and Ms Meiyu Chen (Zoologische Staatssammlung München, Munich) and Dr Dieter Stüning, Dr Marianne Espeland, and Ms Kleikamp Ulrike (Zoological Research Museum Alexander Koenig, Bonn) for their kind help during the examination for material.
Supporting Information
Additional supporting information can be found online in the Supporting Information section.
Open Research
Data Availability Statement
Data are available within the article or its supporting information.


