Feasibility of Using Near-Infrared Reflectance Spectroscopy to Predict the Chemical Composition of Giraffe (Giraffa camelopardalis) Faeces
Abstract
To determine the feasibility of near-infrared spectroscopy (NIRS) for the measurement of certain chemical compounds, a collection of both representative spectral data and reference measurements from many samples (training set) should be compared as part of a screening process. The aim of this study was to investigate the feasibility of developing a rapid prediction of the chemical composition of faeces collected from populations of free-roaming giraffe (Giraffa camelopardalis), located within the central Free State Province of South Africa. Faecal NIRS and chemical analysis data were compared via regression analyses (r2) to determine the feasibility of each chemical (chemometric) parameter. Acceptable high (r2 ≥ 0.8) degrees of screening feasibility for crude protein (r2 = 0.84; RMSE = 1.10) and acid-detergent lignin (r2 = 0.83; RSME = 2.26) were achieved. Spectral data differences are also illustrated based on faeces collected from giraffes provided with supplemental feed or only natural available vegetation, as well as during the dry and wet seasons. This study is the first to screen for the feasibility of developing a NIRS model to determine nutritional status, health and growth performance of giraffes by using faecal droppings. The application of faecal NIRS would most certainly have numerous benefits for wildlife conservation and management.
1. Introduction
Nutritional status, health and growth performance play a crucial role in the successful management of animals held in captivity [1–3]. This is equally true for free-roaming animals located in game reserves and ranches [4–6], but more difficult to measure and manage. Numerous invasive techniques, e.g., blood- and rumen-fluid collection [7–9], are used to determine ruminant health, all of which are time consuming and expensive. When adding the complexity and dangers of giraffe (Giraffa camelopardalis) immobilisation, with equal risks applicable to both animal and human [10–13], a less invasive and a more passive technique would provide numerous benefits.
Analysis of faecal droppings provides a rapid, safer, far less invasive technique for insight towards ruminant health [3, 14–16]. The use of such a noninvasive technique would also allow for more regular opportunities to gain data on animal health across different seasons, management practices, populations and potential stressors [17]. Faecal samples provide little pockets of information relevant to feed digestion, as the amount of nutrients excreted in the faeces reflects diet digestibility, which impacts health and growth performance of ruminants [1, 3]. However, the use of traditional chemical analyses has major disadvantages such as being very labour-intensive, costly, time-consuming and resulting in the analysed sample being destroyed [18–22].
Near-infrared spectroscopy (NIRS) provides a much less expensive, less destructive and simpler method for the analyses of biological samples, such as faeces [19, 23–26]. The basis on which it works is quite simple, but the understanding of the obtained results could be complex.
Faeces contain components with various chemical bonds, primarily from the residues of feed that were resistant to the digestion process, and therefore can provide valuable information regarding the nutritional value of a diet [25]. As an end product of the specialised digestive system in ruminants, it can comprise of a variety of significant compositions attributed to the variety in diet and health [21]. In herbivores, NIRS has been used successfully to monitor the nutritional status and quality of feed ingested, based on the spectral information of faeces [27]. The prediction of dietary chemical composition from faecal spectra is of particular interest in situations where feed intake cannot be determined directly, such as in free-ranging animals [25]. The use of NIRS to determine faecal attributes have been studied mainly for domesticated livestock such as cattle, sheep, donkeys and goats [21, 26–29]. Only recently has this application been investigated for the answers it contains for wildlife, biodiversity and ecological research questions [30–33].
Advances in the application of NIRS technology, especially in the food quality industry, have provided insights on which bands normally represent water (O–H), proteins (N–H overtones), sugars and cellulose (O–H first overtone) [34], although a range of typical spectra exists for these substances [22]. Thus, while the characteristics of near-infrared (NIR) reflected or absorbed from a sample can be used to predict certain sample characteristics, each application of this type must be obtained by calibration [35].
This study investigated the following hypothesis: If NIRS analysis can adequately predict certain parameters from the chemical composition of giraffe faeces collected from free-ranging populations, which were provided with supplemental feed (SF) or only with natural available vegetation (NAV). To determine the suitability of NIRS for its intended application in giraffe faecal analysis, a feasibility study as part of a screening process, was performed. Characteristics of a NIRS calibration feasibility study for a given species include using a relatively small number of samples (30–75 samples) analysed by NIRS and the reference method, from which a calibration model is developed to get an indication of possible future performance [36–38]. Interpretation of the effects which the feeding practices and seasonal changes had on the faecal quality composition was reported in detail in another study [39]. The chemical analysis was based on 10 different faecal parameters: dry matter (DM), organic matter (OM), ash, crude protein (CP), crude fat (CF), gross energy (GE), neutral-detergent fibre (NDF), acid-detergent fibre (ADF), acid-detergent lignin (ADL) and phosphorus (P). The aim of the current study was to investigate the feasibility of using NIRS as a rapid prediction of the chemical composition of faeces (DM, OM, CP, CF, NDF, ADF and ADL) collected from populations of free-roaming giraffe (G. camelopardalis).
Due to the strong absorption of water in the NIR spectrum, the standard practice for calibration development typically involves the use of dried and ground samples [34]. However, in the current feasibility study, moist faecal samples that had been previously frozen and thawed were used [40]. This approach was chosen to minimise the loss of volatile compounds and to prevent chemical reactions that may degrade or alter molecular structures [41]. This consideration is particularly important when analysing organic materials and aligns with a growing body of the literature supporting the reliability of wet sample analysis while maintaining sample integrity [42, 43].
For this study, all faecal pellets were gently rinsed with distilled water prior to any analysis to remove surface contaminants such as dust and small stones. Consequently, no interpretations were made regarding the calculated DM content or moisture concentration of the samples. Future research aimed at developing robust calibration models will consider the use of unrinsed faecal material and include comparative assessments of dried and ground samples to evaluate potential enhancements in predictive accuracy.
2. Materials and Methods
2.1. Study Animals and Area
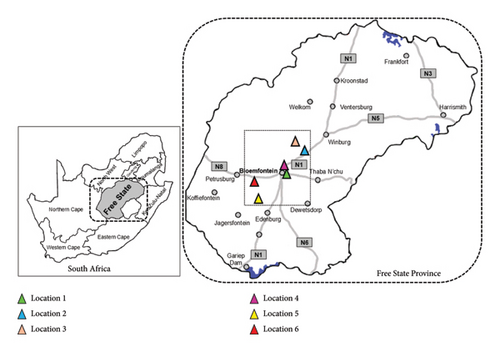
Over 300 faecal samples were collected from six distinct free-roaming giraffe populations in South Africa. Samples were collected from the ground, within 10 min after defecation, using gloved hands, placed in resealable plastic bags and stored at subzero temperatures. The collections took place between July 2021 and June 2023, differentiating between the dry (June to October) and wet (November to May) seasons. The breakdown of sample collection also differentiated between two location groupings, namely, locations which provided SF (Locations 1, 4 and 5) and locations with only NAV (Locations 2, 3 and 6) [39]. All giraffe populations were located within a 60-km radius of the city of Bloemfontein, situated in the central Free State Province, which falls within the Grassland Biome of South Africa [44] (Figure 1). Vegetation types included the Bloemfontein Dry Grassland (Gh 5 at Locations 1, 4 and 5), Western Free State Clay Grassland (Gh 9 at Locations 2 and 3) and the Vaal-Vet Sandy Grassland (Gh 10 at Location 6) [39, 44]. For budgeting reasons, a subset of samples (n = 50) was used to determine feasibility of the NIRS model for giraffes using seven different reference parameters: DM, OM, CP, CF; (ether extract [EE]), NDF, ADF and ADL. Samples were preselected in an attempt to represent the six study locations across all seasons during the 24-month period. Three samples were removed (n = 47) from further statistical interpretations, based on spectral outlier values. Detailed information regarding the study animals, study areas, feeding practices and the associated chemical faecal analyses are provided in a previously published paper [39].
2.2. Chemical Analyses/Reference Data of Faecal Samples
Approximately 300 g of each thawed faecal sample was weighed and dried at 60°C until a constant dry weight was achieved. The dried samples were then ground using a CYCLOTEC 1093 sample mill (Foss, Denmark) with a 1-mm screen and stored for further chemical analysis. Standard laboratory methods, followed by the Animal Science Laboratory, University of the Free State, Bloemfontein, South Africa, were used to determine the content of various components in the faecal samples (reference data) based on percentage of faecal DM and are also described in more detail in a previous study [39]. The NDF, ADF and ADL values are provided on an OM basis (=NDFOM, ADFOM and ADLOM) (Table 1). The official methods from the Association of Official Analytical Chemists (AOAC) [45] were used to determine the following fractions: DM content (Procedure no. 934.01), ash content (Procedure no. 942.05), EE content (Procedure no. 920.39), CP content (Procedure no. 990.03) and ADL (Procedure no. 973.18). The OM content was determined by subtracting the ash content (%) of each sample from 100. The NDF and ADF content were determined according to traditional chemical analysis methods [46, 47]. For the reference chemical methods, each sample was analysed in duplicate with a maximum of 3% deviation tolerated between duplicates as the standard error of the limit (SEL). If the duplicate analysis results differed more than 3%, the analysis was repeated.
| Reference parameters (n = 47) | Mean1 (%) | Range1 (%) | SD1 (%) |
|---|---|---|---|
| Dry matter | 37.440 | 26.512–50.714 | 7.330 |
| Organic matter | 90.288 | 86.353–95.299 | 1.976 |
| Crude protein | 15.330 | 7.697–23.467 | 3.078 |
| Crude fat (EE) | 4.253 | 1.649–7.256 | 1.197 |
| Neutral-detergent fibre (OM) | 68.164 | 60.910–79.714 | 4.344 |
| Acid-detergent fibre (OM) | 57.295 | 49.358–66.586 | 4.283 |
| Acid-detergent lignin (OM) | 40.858 | 29.783–54.423 | 5.390 |
- Abbreviations: EE = ether extract, OM = organic matter, and SD = standard deviation.
- 1All values are rounded-off to three decimals and expressed in percentage of faecal dry matter. The detailed means and standard deviations for the seven faecal chemical parameters analysed from faecal samples (=47) are provided in a previous study [39].
2.3. Faecal NIRS Acquisition
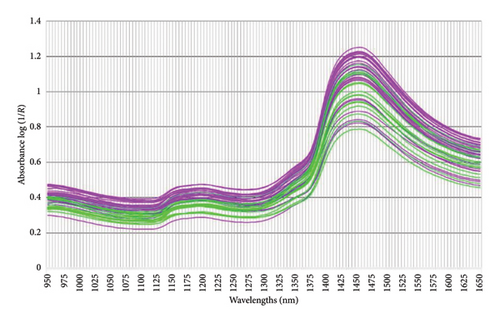
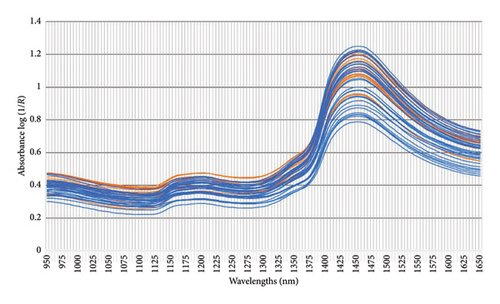
All faecal samples were consistently handled, stored and thawed following standardised procedures up to the point of preparation for NIRS and chemical analyses to minimise variability [48]. Prior to NIRS scanning, the thawed faecal material was ground with a handheld pestle and mortar until a homogenous mixture was created. The sample was transferred into a plastic sample cup (∼43 mL sample volume) and analysed using the PerkinElmer (Diode array) DA 7250 GP NIR analyser (PerkinElmer, Inc. 710 Bridgeport Avenue Shelton, Connecticut 06484-4794 USA). According to the instrument specifications, drying of the sample prior to scanning was not required for the development of the dry basis model [42]. Two cups of subsamples, from each faecal sample, were scanned across the spectral range 950–1650 nm with a minimum λ accuracy of 0.05 nm (∼20 spectra/second). The recorded data were averaged per faecal sample and stored as the absorbance intensity (log [1/R]) using the PerkinElmer DA 7250 GP (Figures 2 and 3).
2.4. Preprocessing of Spectra, Calibration and Validation
No previous NIRS models have been developed for the giraffe faecal analysis. The current study is the first attempt to determine the feasibility of NIRS calibration by focussing on correlation values predicted by cross-validation. Since this is a feasibility study, usual model performance evaluation indicators and external validation do not exist. Statistical analysis details are also defined by the industry software which was utilised [49]. Future and more final NIRS model-development studies and sampling protocols will need to include statistical significance details such as t-test results and external validations.
For the current study, the chemometric and spectral data outcomes were subjected to calibration and model development using Aspen Unscrambler software [49] (Table 2), providing a complete multivariate data analysis experimental design software solution with methods such as principal component analysis, partial least squares (PLS), clustering and classification. To determine the best cross-validated correlation values, spectral pretreatments, such as standard normal variate (SNV), detrending (DT), the Savitsky–Golay (SG) derivative and PLS were trialled on their own and also in various combinations [22]. These pretreatments reduce instrumental noise, signal distorting effects of sample preparation and presentation or any other effects arisen from the spectrometer, the sample and the environment (e.g., stray light, light scattering and mechanical vibrations) [21, 22]. SNV is a row-oriented transformation which removes scatter effects from spectra by centring and scaling individual spectra. DT is a transformation which seeks to remove nonlinear trends in spectroscopic data. SNV and DT in combination reduce multicollinearity, baseline shift (“offset”) and curvature. The SG derivative can be used to compute first, second, third and fourth order derivatives. The SG algorithm is based on performing a least squares linear regression fit of a polynomial around each point in the spectrum to smooth the data. The derivative is then the derivative of the fitted polynomial at each point. The algorithm includes a smoothing factor that determines how many adjacent variables will be used to estimate the polynomial approximation of the curve segment. PLS were determined for each parameter (DM, OM, CP, CF, NDFOM, ADFOM and ADLOM) using the pretreated spectra. PLS models use both the X- and Y-matrices simultaneously to find the latent variables in X that will best predict the latent variables in Y. These PLS components are similar to principal components; however, they are referred to as factors. PLS maximises the covariance between X and Y. For dataset partitioning, the cross-validation was selected at 20 segments and the algorithm was selected as nonlinear iterative partial least squares (NIPALS) [43].
| Reference parameter1 | Slope | Offset | Principal component | r2 (Pearson) | r2 | RMSE | SECV | Bias | Pretreatment |
|---|---|---|---|---|---|---|---|---|---|
| Dry matter | SG | ||||||||
| Predicted by calibration model | 0.96 | 1.55 | 4 | 0.96 | 0.96 | 1.50 | 1.52 | < 0.001 | |
| Predicted by cross-validation | 0.94 | 2.38 | 4 | 0.94 | 0.95 | 1.82 | 1.84 | −0.06 | |
| Organic matter | SG in combination with DT | ||||||||
| Predicted by calibration model | 0.85 | 13.88 | 4 | 0.85 | 0.85 | 0.73 | 0.74 | < 0.001 | |
| Predicted by cross-validation | 0.80 | 18.01 | 4 | 0.77 | 0.78 | 0.90 | 0.91 | 0.03 | |
| Crude protein | SNV in combination with SG | ||||||||
| Predicted by calibration model | 0.90 | 1.58 | 6 | 0.90 | 0.90 | 0.87 | 0.88 | 0 | |
| Predicted by cross-validation | 0.87 | 2.10 | 6 | 0.84 | 0.84 | 1.10 | 1.11 | 0.02 | |
| Crude fat (EE) | SNV in combination with SG | ||||||||
| Predicted by calibration model | 0.83 | 0.71 | 4 | 0.83 | 0.83 | 0.45 | 0.46 | < −0.001 | |
| Predicted by cross-validation | 0.79 | 0.89 | 4 | 0.74 | 0.75 | 0.55 | 0.56 | −0.01 | |
| Neutral-detergent fibre (OM) | SG in combination with DT | ||||||||
| Predicted by calibration model | 0.78 | 14.77 | 3 | 0.78 | 0.78 | 2.02 | 2.04 | < 0.001 | |
| Predicted by cross-validation | 0.72 | 19.25 | 3 | 0.71 | 0.72 | 2.34 | 2.36 | −0.02 | |
| Acid-detergent fibre (OM) | SNV in combination with SG | ||||||||
| Predicted by calibration model | 0.87 | 7.31 | 7 | 0.87 | 0.87 | 1.49 | 1.51 | < 0.001 | |
| Predicted by cross-validation | 0.80 | 11.64 | 7 | 0.75 | 0.75 | 2.10 | 2.12 | −0.01 | |
| Acid-detergent lignin (OM) | SG | ||||||||
| Predicted by calibration model | 0.90 | 4.29 | 6 | 0.90 | 0.90 | 1.72 | 1.74 | < 0.001 | |
| Predicted by cross-validation | 0.83 | 7.14 | 6 | 0.82 | 0.83 | 2.26 | 2.32 | 0.22 | |
- Note: Feasibility of developing a near-infrared model per reference parameter was determined from the original 47 faecal samples, collected from six different free-roaming giraffe (Giraffa camelopardalis) populations in the Free State Province during 2021–2023. r2 = The correlation coefficient of cross validation.
- Abbreviations: DT = detrending, EE = ether extract, OM = organic matter, RMSE = the root mean squared error, SECV = standard error of cross validation, SG = the Savitsky–Golay, and SNV = standard normal variate.
- 1All values are rounded-off to two decimals and expressed in percentage of faecal dry matter.
The root mean square error (RMSE) of prediction was used as a measure of prediction accuracy improvement relative to the mean composition across all samples [23]. The RMSE gives a measure of the efficiency of a calibration equation by being the root mean square of differences between NIRS predicted and reference results [35]. The calculated slope shows the degree to which NIRS predicted values change, relative to reference values (Table 2; Figure 4). A slope near 1.0 is excellent because it shows that the rate of change in both sets of data is identical [34]. The “offset” along the absorption axis indicates the baseline shifts in the NIR spectra due to physical conditions such as particle size, packing density or porosity and even the presence of air bubbles [50].
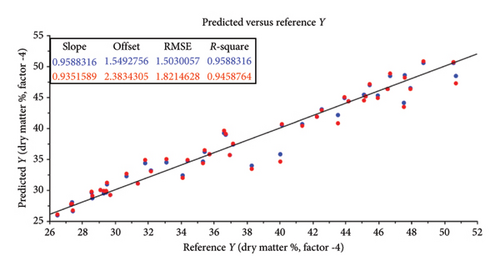
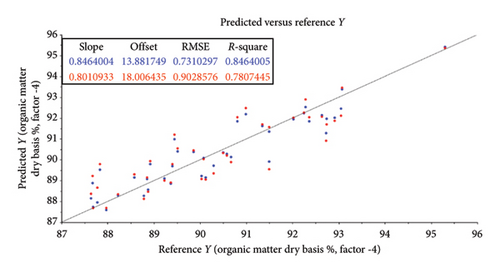
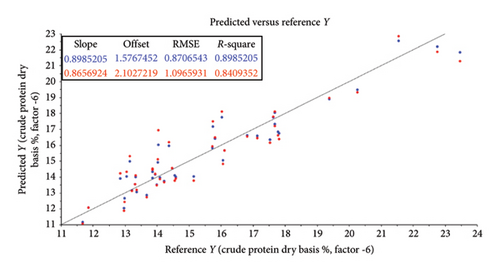
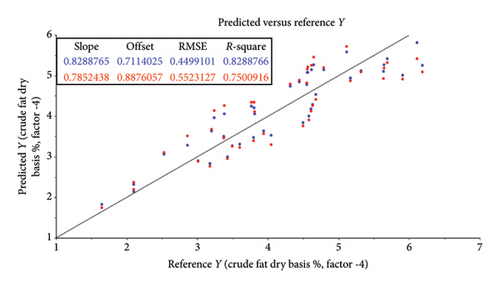
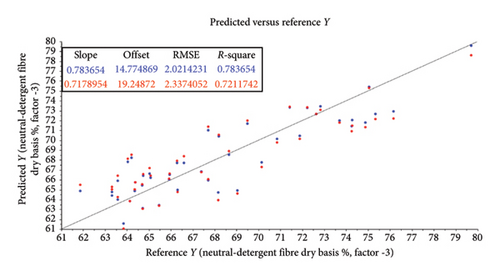
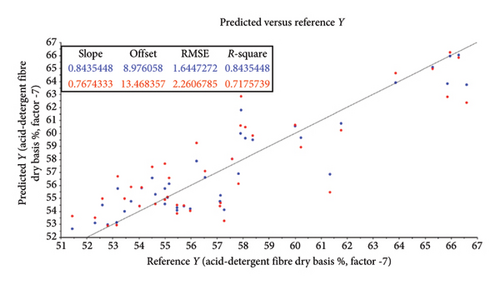
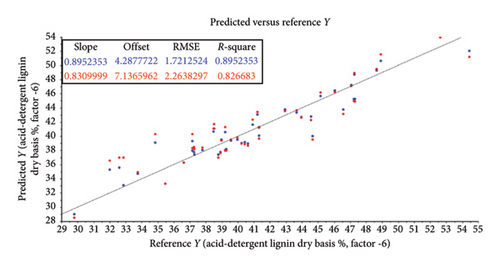
The r or r2 indicates the closeness of fit between the NIRS and the reference data over the range of composition [34]. The closer the correlation coefficient (r2) value is to 1, the more accurate the model prediction results are [36]. For screening purposes and some other approximate calibrations, r2-range of 0.66–0.81 is deemed acceptable, whilst a range of 0.83–0.90 is useable with caution for most applications, including research [34]. The purpose of this study was to determine which of the chemical (chemometric) parameters are feasible (acceptable) for the further calibration development of NIRS models for the analyses of giraffe faeces. For this study, cross-validated correlation values of r2 ≥ 0.8 were considered suitable for screening and approximate NIRS calibrations [35, 51].
3. Results
3.1. Reference Data
The means, ranges and standard deviations calculated for the chemical reference parameters (DM, OM, CP, CF, NDF, ADF and ADL), from the selected giraffe faecal samples (n = 47), are summarised in Table 1.
3.2. Spectra Data
Graphic illustrations of the patterns illustrating the absorbance of the collected faecal samples collected from giraffes presented with different feeding practices (SF and NAV) and during different seasons (dry and wet) are provided in Figures 2 and 3, respectively. The spectral lines depicted represent the composite spectra (raw and second derivative) derived from an aggregation of the scanned faecal. Biological products, e.g., faeces, have a characteristic absorbance spectrum in the NIR region (750 nm–2600 nm) when exposed to NIR light [22]. These absorption peaks are primarily attributed to the stretching vibrations of C–H, O–H and N–H single bonds [21, 22, 34] and different various constituents and physical structures within the biological sample [52].
Several characteristic bands can be identified in the aforementioned spectral range [34]. Some of these include 958 nm, 1153 nm and 1460 nm (corresponding to the O–H bond, which is indicative of water content) and 996 nm, 1415 nm and 1450 nm which are indicative of the O–H bond representing alcohols; the region between 1195 nm and 1390 nm (associated with the C–H, indicating fat content), 978 nm and 1460 nm (indicative of cellulose) and 1018 nm, 1357 nm, 1458 nm, 1485 nm and 1570 nm (indicative of proteins).
3.3. Feasibility of Determination of Composition From Giraffe Faecal Samples
The statistical attributes of the predictive modelling (feasibility) of the chemical composition of faeces, along with the pretreatment used to provide the best correlation, are listed in Table 2. Some spectra outliers were detected via variance versus Leverage score plots [53] and were removed from the final faecal sample size (n = 47) analysed per reference parameter. Scatter plots also illustrate the relationship between NIRS and reference data analyses and are depicted in Figures 4(a), 4(b), 4(c), 4(d), 4(e), 4(f) and 4(g). Acceptable high (r2 ≥ 0.8) degree of screening feasibility for DM (r2 = 0.95; RMSE = 1.82), CP (r2 = 0.84; RMSE = 1.10) and ADLOM (r2 = 0.83; RSME = 2.26) was achieved.
Less convincing outcomes for feasibility were observed with the predictive modelling for OM (r2 = 0.78; RMSE = 0.90), CF (r2 = 0.75; RMSE = 0.55), NDFOM (r2 = 0.72; RMSE = 2.34) and ADFOM (r2 = 0.75; RMSE = 2.10).
4. Discussion
Similar to most biological materials, faeces, being the end product of digestion, contain components with various chemical bonds and functional groups, such as C–H, O–H and N–H [21]. These components contribute to derived NIR spectral information, which in turn can be closely associated with dietary digestibility. During this study, it was found that the log (1/R) absorbance spectral data from giraffe faecal samples scanned using the DA 7250 GP (950–1650 nm) were similar to spectra graphs observed in other faecal NIRS studies [27, 37, 54]. Based on the previous research in the grain quality industry [34], several characteristic bands could be identified. These included the spectral ranges 964 nm, 1156 nm, 1460 nm and 1580 nm (corresponding to the O–H, which is indicative of water content); 996 nm, 1415 nm and 1450 nm (which are indicative of the O–H bend representing alcohols); the region between 1195 nm and 1390 nm (associated with the C–H, indicating fat content); 1004 nm and 1490 nm (indicative of cellulose) and 1018 nm, 1463 nm, 1483 nm and 1570 nm (indicative of proteins) [34] (Figures 2 and 3). During this study, the absorbance peaks of true fat (triglycerides) could not be estimated in the scanned NIRS region (950–1650 nm) in the current study and the feasibility of its use in predictive NIRS modelling was low (CF [EE] [r2 = 0.75]), as depicted in Table 2 and Figure 4(d). High CF concentrations are not expected in healthy ruminant excreta, as most would be digested by rumen microbiota into fatty acids and reabsorbed through the digestive system [55]. CF is an estimate of the total fat content (triglycerides as well as alcohols, waxes, terpenes, steroids, pigments, ester, aldehydes and other lipids) using EE [20]. The occurrence of alcohols was noted at 996 nm, 1415 nm, 1430 nm, 1450 nm, 1540 nm and 1580 nm in Figures 2 and 3 [34] and could form part of CF content. However, traditionally, the NIRS region assigned to fatty acids show characteristic spectral patterns at wavelength ranges of 1600–1800 nm and 2100–2200 nm [56], which fell outside the scanned NIRS region (950–1650 nm) in the current study.
Acceptable high (r2 ≥ 0.8) degree of screening feasibility was calculated for CP (r2 = 0.84; RMSE = 1.10) (Table 2 and Figure 4(c)). Similar to previous studies [2, 21, 57, 58], a high degree of feasibility to correlate CP spectra and chemical analysis results was noted in our study. A seasonal increase in faecal concentration of CP could be attributed to the increase in a quality browse material during the wet season [59]. Overall faecal CP is widely used as an index of dietary digestibility in the nutritional ecology of free-ranging and captive ruminants [60–62] and ultimately plays an important role in the microbial fermentation process which is vital for ruminants [63].
The other reference parameter which achieved an acceptable high degree of feasibility was ADLOM (r2 = 0.83; RSME = 2.26) (Table 2 and Figure 4(f)). A seasonal increase in ADLOM could be indicative of an increased availability of lesser digestible plant structural material during the dry season and present in NAV [59]. Lignin is the least digestible, and hemicellulose and cellulose are contained in the fibrous portion of plant stems and leaves [20]. It is undigestible and hence has a negative impact on cellulose digestibility in ruminants [64]. The high degree of feasibility to use ADL spectral data in the development of a calibrated and validated NIRS model [65] for faecal lignin concentration would provide insight into the digestibility of cellulose available in the diet of giraffes, as well as acting as internal digestion markers for the intake of browse material. Using faecal ADLOM conjunctive with faecal CP would assist in determining if an increase in the latter is a result of increased faecal microbes (N-content) or actual increase in diet quality.
Less convincing outcomes for feasibility were observed with the predictive modelling for OM (r2 = 0.78; RMSE = 0.90), CF (r2 = 0.75; RMSE = 0.55), NDFOM (r2 = 0.72; RMSE = 2.34) and ADFOM (r2 = 0.75; RMSE = 2.10). These findings differ from previous NIRS studies based on grazers such as cattle, where OM, ADFOM and NDFOM were found to be highly predictive (r2 ≥ 0.8) using NIRS in faecal analysis [66, 67]. This might be attributed to the unique combination of digestive processes within giraffes, resulting in a very efficient use of the nutrients and a high, estimated diet digestibility of ∼85% [55] but an increase in sample size, further calibration and model-development are needed to confirm this. The vast coverage of giraffes’ stomach walls with papillae creates a surface area for absorption and is one of the biggest known for ruminants [68, 69]. An estimated 40% of the daily energy is derived from volatile fatty acids, produced by microbial fermentation in the rumen [70] and the remaining 60% is from the intestinal digestion of glucose [55]. A reversed ratio is, however, found in grazer-ruminants and together with the substantial fermentation of undigested fibre (mainly hemicellulose) [64] in the giraffe’s large intestine could explain the differences in its use for predictive uses in NIRS studies.
For the development of a finalised protocol, the model needs to be improved by adding more data (reference and associated spectral data) to the database of the models. Future studies with a greater number of samples, animals and locations are needed to develop a definitive model for faecal composition predictions based on faecal NIRS. Ultimately, carefully trained and properly tested models may be used for predicting qualitative or quantitative parameters of samples having solely spectral data. Ultimately, the provision of a less labour-intensive and less expensive method to determine and management animal welfare would result in more sustainable wildlife ranching practices. Real-time information on the nutritional quality of the diets accessible and consumed by giraffe populations occurring in areas outside of their historical distribution would also benefit managerial decisions with regards to translocations and stocking capacities.
5. Conclusions
Results from the current study indicated the feasibility of using NIRS analysis to adequately predict CP and ADLOM from the chemical composition of giraffe faeces. Although derived from a limited number of reference samples, the findings presented in our study do provide a promising initial step towards the practical application of this methodology in giraffe health and their growth performance analyses. Faecal NIRS can be effectively used as a noninvasive, cost-effective and quick method to determine the nutritional status, health and growth performance of vulnerable species, such as giraffe. Although the science behind analysing and interpreting the results is complex, the collection of the material is not. This provides a viable opportunity for game ranchers to collect faeces from their stock populations and send for analysis. Once calibrated for a specific species, faecal NIRS provides simplistic, fast, accurate cost-effective data, across many samples. This application of faecal NIRS would most certainly lead to an influx of knowledge for wildlife conservation and management.
Ethics Statement
Ethical approval was obtained prior to the commencement of the study. The study was approved by the Animal Research Ethics Committee (AREC) of the University of the Free State (UFS) and Nature Conservation (reference numbers: UFS-AED2022/0006). The process was initiated with the formulation of a formal project proposal, which was submitted for review and approval by the scientific review panel, the official animal welfare committee (AREC) of the UFS and the State Veterinarian for Section 20 of the Animal Diseases Act, 1984 (Act No. 35 of 1984).
Conflicts of Interest
The authors declare no conflicts of interest.
Funding
This research was funded by the National Research Foundation (NRF) of South Africa, grant number: RA201126576714.
Acknowledgements
The authors would like to thank the property owners who provided consent and access to the study locations during this study. We also wish to thank Mrs Johanna van der Merwe at the Department Animal Sciences (UFS) for technical support with the preparation of the chemical analysis reference data set.
Open Research
Data Availability Statement
The data that support the findings of this study are available from the corresponding author upon reasonable request.


