Evaluation of the Quality and Antiaging Activity of Phaffia rhodozyma
Abstract
Phaffia rhodozyma (PR) is a candidate microbial strain for the production of natural astaxanthin. Astaxanthin and other carotenoids have significant antioxidant effects, which can delay aging and prevent tumors. However, so far, there is no effective and convenient method to comprehensively reflect the quality of PR, and there is also a gap in the research on the potential antiaging effect of PR. In this study, 15 batches of PR samples collected in China were analyzed using high-performance liquid chromatography (HPLC) fingerprinting. A total of 14 common peaks were obtained, of which 8 peaks corresponded to astaxanthin. The similarity of fingerprints of 15 PR batches ranged from 0.814 to 0.998. Principal component analysis (PCA) and hierarchical cluster analysis (HCA) were also performed in this study. The content of astaxanthin in 15 batches of PR ranged from 0.401% to 0.867%. This is consistent with the results of PCA and HCA analysis, which revealed significant PR quality differences between samples obtained from different manufacturers. We also studied the antiaging effect of PR on Caenorhabditis. elegans and found that PR can effectively prolong the lifespan of C. elegans, reduce the accumulation of lipofuscin, and increase the frequency of exercise. In addition, it was also found that PR can enhance the heat stress resistance of C. elegans and improve the activity of antioxidant enzymes (MDA, SOD, CAT, and GSH). The combination of HPLC fingerprint and chemical pattern recognition is a reliable and stable research method that can be applied to the systematic quality evaluation of PR. The study on the antiaging effect of C. elegans as a model organism found that PR has an antiaging effect and has certain application potential in food and medicine, which provides a new idea for the development of PR.
1. Introduction
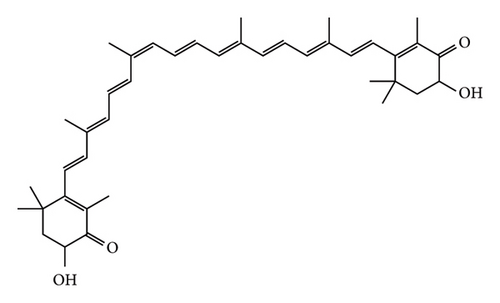
Phaffia rhodozyma (PR) is a lipid-rich red yeast, which was first isolated from the secretions of deciduous trees in Alaska and high latitudes of Japan in the late 1960 s by Dutch yeast ecologist Andrewes, Phaff, and Starr [1]. Andrews discovered its ability to synthesize astaxanthin in 1976, which became the main distinguishing feature of PR from other yeasts [2]. The advantage of this yeast is that more than 80% of the carotenoids it produces are astaxanthin [3]. Astaxanthin is a fat-soluble carotenoid having powerful antioxidant properties, which is superior to other carotenoids, vitamin C, and vitamin E [4, 5]. The chemical structural formula of astaxanthin is shown in Figure 1. In addition, a variety of beneficial health properties have been reported, including prevention of cardiovascular disease, enhancement of the immune system, antihelicobacter pylori, prevention of cataract, anti-inflammation, antihypertension, antiobesity, anticancer, improvement of skin condition, and antiaging [6–9]. PR is the only yeast strain known to synthesize astaxanthin in nature [10]. Therefore, PR has been widely used in food, medicine, cosmetics, and other fields [11].
Aging is the process in which an organisms gradually (over time) lose function and develop adaptive responses in the face of nutritional and environmental changes. It involves multiple levels, including changes at the cellular, tissue, and organ levels [12]. Aging increases cellular oxidative stress and inflammation, leading to impaired cellular structure and function and increasing the risk of chronic diseases [13, 14]. In addition, genetic and environmental factors, including genetic makeup and lifestyle choices, such as dietary habits, stress levels, and exposure to harmful substances play an important role in the aging process [15, 16]. Aging is usually accompanied by physiological and morphological changes, such as skin wrinkles, muscle atrophy, and osteoporosis [17, 18]. It is worth mentioning that aging is also associated with increased risk of developing diseases, for instance, cancer, cardiovascular disease, diabetes, and neurodegenerative diseases [19]. Although aging is part of the natural life process, through healthy lifestyles, proper nutrition, exercise, and advances in scientific research and medical technology, people can slow down the aging process, improve quality of life, and delay the emergence of age-related diseases [20, 21].
This study selected 15 PR batches as the research object. Our aim was to establish fingerprints using high-performance liquid chromatography (HPLC) and to study the PR quality differences using chemical pattern recognition methods, such as hierarchical cluster analysis(HCA) and principal component analysis (PCA). In addition, we assessed the differences in astaxanthin content among 15 PR batches. Moreover, we used Caenorhabditis. elegans as a model to evaluate the effects of feeding C. elegans, a diet containing PR on the lifespan, reproductive capacity, athletic ability, lipofuscin accumulation, heat stress resistance, and antioxidant enzyme activity, including catalase (CAT), superoxide dismutase (SOD), glutathione (GSH), and malondialdehyde (MDA). All these measures are prime indicators of the PR capacity to delay the aging of C. elegans.
2. Materials and Methods
2.1. Materials and Reagents
Fifteen PR batches were obtained from three different production locations in China, as shown in Table 1. All PR batches were red powder solids enclosed in sealed plastic bags and stored in refrigeration.
| Nos. | Production location |
|---|---|
| 1 | Shaoxing City, Zhejiang Province |
| 2 | Shaoxing City, Zhejiang Province |
| 3 | Shaoxing City, Zhejiang Province |
| 4 | Shaoxing City, Zhejiang Province |
| 5 | Shaoxing City, Zhejiang Province |
| 6 | Xiamen City, Fujian Province |
| 7 | Xiamen City, Fujian Province |
| 8 | Xiamen City, Fujian Province |
| 9 | Xiamen City, Fujian Province |
| 10 | Xiamen City, Fujian Province |
| 11 | Xiamen City, Fujian Province |
| 12 | Weihai City, Shandong Province |
| 13 | Weihai City, Shandong Province |
| 14 | Weihai City, Shandong Province |
| 15 | Weihai City, Shandong Province |
N2 wild-type C. elegans and Escherichia coli OP50 (hereinafter referred to as OP50) were donated by the Institute of Translational Medicine, Qingdao University. HPLC grade acetonitrile was purchased from Thermo Fisher Scientific Co., Ltd (China). Cholesterol was purchased from Shanghai McLean Biochemical Technology Co., Ltd. N-butanol, methanol, sodium chloride, sodium hydroxide, potassium dihydrogen phosphate, dipotassium hydrogen phosphate, disodium hydrogen phosphate, and absolute ethanol were of analytical grade, which were purchased from Guangdong Guanghua Technology Co., Ltd. Levamisole hydrochloride injection, 0.5 g/10 mL, was purchased from Beijing Chemical Plant. Agar powder was procured from Tianjin Guangfu Technology Development Co., Ltd. Luria–Bertani (LB) powder was purchased from Beijing Lanjieke Technology Co., Ltd. Dimethyl sulfoxide (DMSO) was acquired from Gentihold Co., Ltd. Tryptone was from Beijing Oboxing Biotechnology Co., Ltd. Streptomycin sulfate for injection was purchased from Shandong Lukang Pharmaceutical Co., Ltd. Calcium chloride was procured from Xilong Science Co., Ltd. Sodium hypochlorite (analytically pure) was purchased from Chengdu Kelong Chemical Co., Ltd. Sodium chloride injection was purchased from Chenxin Pharmaceutical Co., Ltd. Kits for CAT, SOD, GSH, MDA, and protein (bicinchoninic acid [BCA]) analyses were purchased from Nanjing Jiancheng Biotechnology Co., Ltd.
2.2. PR Sample Treatment
PR (20 mg) was accurately weighed on the AB135-S analytical balance (METTLER TOLEDO International Co., Ltd.), placed in a grinder, fully suspended with a small amount of absolute ethanol, and then added 5 mL anhydrous ethanol at 50°C, 350W, 70 Hz ultrasonic treatment (JP300G ultrasonic extraction/emulsification device, Wuhan Jiapeng Electronics Co., Ltd.).
The suspension was filtered at room temperature and the same treatment was repeated twice. The filtrates were collected and merged, the solvent evaporated, 2 mL tetrahydrofuran–acetonitrile (1:1) solution was added to remix, and filtered through a 0.22 μm microporous membrane to recover the filtrate to obtain the PR sample solution.
2.3. Preparation of Astaxanthin Reference Solution
Accurately weigh the appropriate amount of astaxanthin, dissolve it into 5 mL with tetrahydrofuran-acetonitrile (1:1) solution, and place it in a volumetric flask to obtain the astaxanthin reserve solution (2.012 mg/mL). Precisely absorb 1 mL reserve solution and dilute it with tetrahydrofuran–acetonitrile (1:1) solution (1:10) to obtain astaxanthin control solution (0.2012 mg/mL) for subsequent experiments.
2.4. HPLC Fingerprint of PR
2.4.1. Chromatographic Conditions
The analyses were performed in a 1260 high-performance liquid chromatograph (Agilent Technologies Limited, USA). An Agilent TC-C18 column (4.6 × 250 mm, 5 μm) was used with 0.1% phosphoric acid as mobile phase A, acetonitrile as mobile phase B, gradient elution (0–5 min, 50 ⟶ 58% B; 5–8 min, 58 ⟶ 68% B; 8–13 min, 68 ⟶ 72% B; 13–25 min, 72 ⟶ 87% B; 25–30 min, 87 ⟶ 90% B, 30–37 min, 90 ⟶ 95% B, 37–40 min, and 95 ⟶ 100% B), detection wavelength 215 nm, column temperature 25°C, flow rate 2.0 mL min−1, and injection volume 20 μL.
2.4.2. HPLC Fingerprinting
The reference peak (S) was selected and then we performed precision, stability, and repeatability tests under the abovementioned chromatographic conditions described above to verify the suitability of our analysis method. Fifteen PR batches were prepared according the heading “2.2,” and the HPLC fingerprint was established according to the above described chromatographic conditions. The similarity analysis was carried out by importing the “Similarity Evaluation System of Chromatographic Fingerprints of Traditional Chinese Medicine (2012 Edition).”
2.5. Chemical Pattern Recognition
Systematic cluster analysis and principal component analysis were used to cluster and analysis of the common peaks of 15 PR batches, and the quality of PR was comprehensively and objectively evaluated.
2.6. Determination of Astaxanthin Content in PR
2.6.1. Methodological Validation
Six astaxanthin reference solutions with different astaxanthin concentrations were prepared, injected, and analyzed. The standard curve was plotted with the concentrations as the abscissa (x axis) and the peak areas as ordinate (y axis), and the linear regression equation was obtained. Then, the precision, stability, and repeatability of astaxanthin reference solution and PR sample solution were tested and verified.
A sample recovery experiment was conducted to evaluate the accuracy of our astaxanthin content method. For such purpose, 6 parts, each of 10 mg of PR, were grind evenly, separately added with 1 mL astaxanthin reference solution (at 0.02 mg/mL), and used to prepare the sample solution as quoted under “2.2,” analyze and measure, and calculate the sample recovery rate based on the validation guidelines for analytical methods in Part 9101 of the 2020 edition of the Pharmacopoeia of the People’s Republic of China.
2.6.2. Astaxanthin Content Analysis
As quoted under “2.2,” 15 PR batches samples were separately prepared to get the test solutions and analyzed by chromatography according to “2.5.1.” The astaxanthin content was calculated by an external standard method.
2.7. The Antiaging Effect of PR on C. elegans
2.7.1. Culture and Storage of C. elegans, Culture Media, and Other Related Solutions
2.7.1.1. C. elegans Growth Medium
Nematode growth medium (NGM) was prepared by adding 1.5 g of sodium chloride, 8.5 g of agar powder, and 1.25 g of trypsin to 400 mL of purified water and supplemented with additional purified water to 500 mL. Sterilization in autoclave (Kagoshima Seisakusyo Co., Ltd.) at 121°C for 30 min. Next, the sterile medium was cooled in a water bath at 55°C for 15–30 min and 0.5 mL calcium chloride solution (1 M), 0.5 mL cholesterol solution (5 mg/mL), 0.5 mL magnesium sulfate solution (1 M), 12.5 mL potassium hydrogen phosphate buffer (1 M ′), and 500 μL streptomycin solution (50 μg/mL) were added to the clean bench. After mixing, the medium was poured into a 35 mm × 12 mm plate until the plate hole was filled to about two thirds of its capacity. After the medium was solidified, the plates were inverted and stored at room temperature for 2-3 days and then stored at 4°C until use.
2.7.1.2. M9 Buffer
The M9 buffer was prepared in 400 mL purified water added with 1.5 g potassium dihydrogen phosphate, 0.125 g magnesium sulfate, 7.56 g disodium hydrogen phosphate dodecahydrate, and 2.5g sodium chloride. After dissolving all the components, the volume was brought up to 500 mL in a volumetric flask. Autoclaving sterilization was performed at 121°C for 30 min, cooled to room temperature, and ready to use.
2.7.1.3. OP50 Preparation
An ultraclean bench (Suzhou Antai Air Technology Co., Ltd.) was used to add 100 μL OP50 bacterial solution into 25 mg/mL LB culture medium. The mixture was then placed in a constant temperature shaker and incubated at 37°C and 170 r/min for 12 h until the OD600 increased to about 0.4.
2.7.1.4. Culture and Preservation of C. elegans
C. elegans is typically cultured on NGM plates containing OP50 bacterial solution. The NGM plates were prepared by dropwise adding OP50 bacterial solution 200 μL and then cultured until bacterial colony were formed.
The transfer of C. elegans is accomplished by cutting part of the medium containing C. elegans or by collecting a small amount of C. elegans worms and placing them on a new plate. For a large number of C. elegans, rinse with M9 buffer before transferring to a new NGM plate. These NGM plates are incubated at 20°C in an incubator for experimental use or stored at 15°C–20°C for 1-2 weeks.
2.7.1.5. Synchronization of C. elegans
C. elegans in the oviposition period were washed with M9 buffer solution (1 mL) in a sterile centrifuge tube and then the supernatant was removed. Repeat 2-3 times. Following, 1 mL lysis solution (composed of a 1:1:1 mixture of 5 M/L NaOH, 0.5% NaCLO, and ultrapure water) was added and then the test tube was gently inverted for 4 minutes for lysis and centrifuged to remove the supernatant. Rinse the C. elegans again with 1 mL M9 buffer, centrifuge at 3000 rpm for 3 min, discard the supernatant, and leave at least 250 μL. Repeat the above operation twice. A total of 250 μL of C. elegans suspension was dropped into the sterile zone of NGM medium. After 48 h of incubation at 20°C, C. elegans was in the L4 larval state at the same growth and development level, which could be used for subsequent experiments.
2.7.2. Drug Formulation, Grouping, and Administration
About 15 mg PR (S12, Weihai City, Shandong Province) was taken, 1.5 mL purified water was added, and fully ground. Then, an appropriate amount of dimethyl sulfoxide (DMSO) was added to dissolve the solution to obtain the mother liquor. The mother liquor was diluted with sterile water and mixed with E. coli OP50 solution in a ratio of 1:1 to obtain 50, 100 and 150 μg/mL PR concentrations, which were labeled as low-dose PR (LPR), medium-dose PR (MPR), and high-dose PR (HPR) groups, respectively. The final content of DMSO per dose was 0.1%. The 1:1 mixture of sterile water and E. coli OP50 bacterial solution was used as the blank group treatment solution.
Route of administration: the above prepared solutions of different PR concentrations were dropped into 50 μL of fresh NGM culture plates, placed it in a super clean workbench for natural drying, and used for C. elegans experiments.
2.7.3. Lifespan
The experiment included blank group and experimental worm group. The blank group was cultured in NGM medium without any PR extract, and the experimental group was fed with different concentrations of PR in the medium. Synchronized L4 phase C. elegans worms were transferred into plates containing the corresponding medium (3 plates, 15 worms per plate, i.e., a total of 45 C. elegans worms) and then cultured at 20°C. The survival rate of C. elegans was observed starting from day 0 of the experiment and counted every day until all C. elegans worms died.
2.7.4. Reproductive Capacity
Each group comprised three plates and each plate hold two L4 C. elegans worms on the first day. The C. elegans worms were transferred to a new plate every 24 h until they stopped laying eggs.
2.7.5. Athletic Ability
The synchronized L4 C. elegans was transferred to a plate containing the corresponding medium containing different concentrations of PR. On the 4 day of treatment, a C. elegans worm was selected and placed on a new plate with NGM medium, allowing it to move freely for about 1 min, and the number of head swings within 30 s was recorded as the head swing frequency index. At least 20 C. elegans worms were evaluated in each experimental group.
2.7.6. Antiheat Stress Effect
After 5 days of treatment in the blank group and experimental group, 15 L4 stage C. elegans were selected from each plate for 3 parallel experiments in each group to observe the changes in C. elegans lifespan under heat stress environment. The blank group and the experimental group were placed at 37°C in an incubator, and the number of worms per plate was detected and recorded every hour until all worms died.
2.7.7. Lipofuscin Levels
Collect synchronized C. elegans and cultivate them to the L4 stage. Divide the C. elegans into 4 groups, 3 parallel plates in each group, and place 5 C. elegans on each culture plate. Each group was treated with different concentrations of PR (50, 100, and 150 μg/mL) and blank solution. After 10 days of growth, the C. elegans were anesthetized with tetramisole hydrochloride solution, transferred to a 2% agarose glass spacer, observed, and photographs were taken with a fluorescence microscope and then the relative lipofusin content in the worms was analyzed by Image J software.
2.7.8. Determination of MDA, SOD, CAT, and GSH Levels
Four activities of C. elegans were determined: MDA activity, SOD activity, CAT activity, and GSH activity. After 5 days of treatment, the L4 C. elegans were washed with M9 buffer and centrifuged; subsequently, the supernatant was discarded and the worms were ground with normal saline (1:9). After centrifugation, the supernatant of tissue homogenate was obtained. Determination of the various activities tested in C. elegans was carried out immediately, according to the manufacturer’s instructions for each kit.
2.8. Data Analysis
Peak correction and similarity analysis were carried out according to the software of “Chromatographic Fingerprint Similarity Evaluation System for Traditional Chinese Medicine” recommended by the Chinese Pharmacopoeia Commission (Chinese Pharmacopoeia Commission, 2012 Edition). PCA and HCA were performed by SPSS (SPSS USA, Version 20.0) and Origin Pro (2019 b) software to evaluate the PR quality. Excel 2020 and SPSS 22.0 were used for statistical analysis. Data graphs were drawn using GraphPad Prism 8.0.2. Significance test was performed using Student’s T-test. p < 0.01 indicated a very significant difference, p < 0.05 indicated a significant difference, and p > 0.05 indicated no statistical significance.
3. Results
3.1. HPLC Fingerprint of PR
3.1.1. Fingerprint Analysis Method Validation
The chromatographic peak of astaxanthin (no. 8) is our reference peak (S), which is used to analyze the PR sample solution for 6 consecutive injections. The relative retention time RSDs of each common peak were < 0.52% and the relative peak area RSDs were < 1.94%, indicating that the instrument precision was good. The PR sample solution was analyzed at 0, 2, 4, 8, 12, and 24 h. The relative retention time RSDs of the common peaks were < 0.71% and the relative peak area RSDs were < 1.96%, indicating that the test solution was stable within 24 h. The same batch of PR samples (S1) was used to prepare the test solution according to “2.1.” The relative retention time RSDs of the common peak were < 0.62% and the relative peak area RSDs were < 2.18%, indicating that the method has good repeatability.
3.1.2. HPLC Fingerprint and Similarity Evaluation
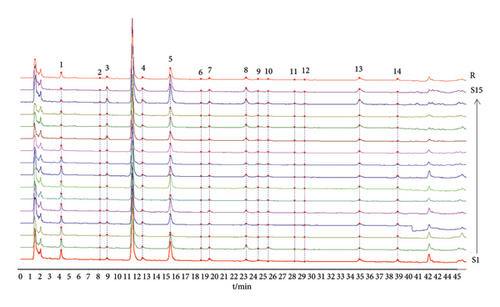
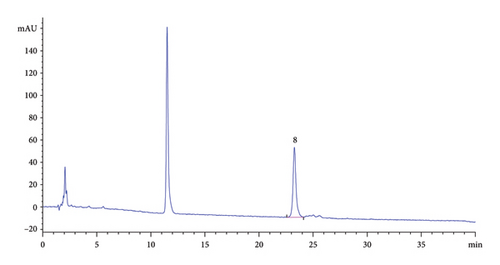
The chromatograms of 15 PR batches were analyzed using the “Similarity Evaluation System of Chromatographic Fingerprints of Traditional Chinese Medicine (2012 Edition),” with the chromatogram of the S1 sample used as the reference spectrum. The chromatographic peaks of the 15 PR batches were matched by multipoint correction to obtain the superimposed fingerprints and control fingerprints (R) of each PR batch, as shown in Figure 2. A total of 14 common peaks were identified in the 15 PR batches. In addition, compared with the control group, peak 8 was identified as astaxanthin, as shown in Figure 3. Therefore, it was used as a reference peak (S). The relative retention time RSD of each common peak ranged from 0.09% to 0.83%, indicating that the components in different batches were similar, but there were some differences. The similarity results of 15 PR batches are shown in Table 2. Except for S3, the similarity between other batches of samples and the control spectrum is greater than 0.951, and the quality difference between different batches of samples is small.
| No | Similarity |
|---|---|
| S1 | 0.989 |
| S2 | 0.987 |
| S3 | 0.814 |
| S4 | 0.988 |
| S5 | 0.994 |
| S6 | 0.951 |
| S7 | 0.995 |
| S8 | 0.976 |
| S9 | 0.995 |
| S10 | 0.995 |
| S11 | 0.972 |
| S12 | 0.955 |
| S13 | 0.998 |
| S14 | 0.966 |
| S15 | 0.973 |
3.2. Chemical Pattern Recognition
3.2.1. HCA
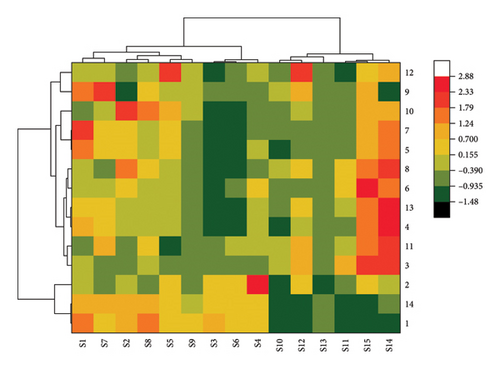
PR was quantified relative to the peak area of the reference peak and the data were imported into Origin Pro software. Ward cluster analysis was performed by the Euclidean distance method. The analysis indicates that 15 batches of samples can be assorted into 2 clusters. The cluster I includes S1∼S9, while cluster II includes S10∼S15. This clustering analysis method separates the PR batches from different manufacturers into two categories, and some manufacturers can be classified. The clustering heatmap is shown in Figure 4.
3.2.2. PCA
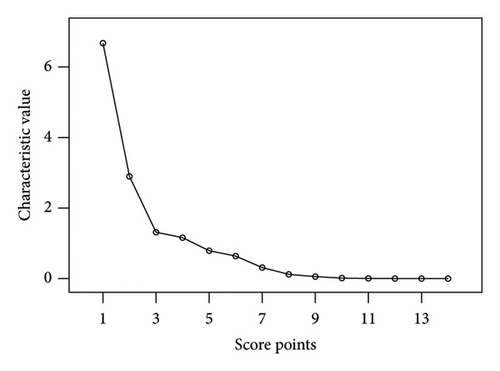
The peak area of 14 common peaks found in the fingerprints of 15 PR batches was used as a variable to enter SPSS for factor analysis. As shown in Table 3, four principal components were obtained with eigenvalue > 1 as the extraction standard. The cumulative contribution rate is 86.085%, which can represent most of the information of the 14 common peaks in the fingerprints. The scree diagram is shown in Figure 5, and the gravel diagram is shown in Figure 6.
| Component | Initial eigenvalue | ||
|---|---|---|---|
| Total | Variance contribution rate (%) | Cumulative variance contribution rate (%) | |
| 1 | 6.677 | 47.693 | 47.693 |
| 2 | 2.897 | 20.694 | 68.387 |
| 3 | 1.316 | 9.401 | 77.787 |
| 4 | 1.162 | 8.297 | 86.085 |
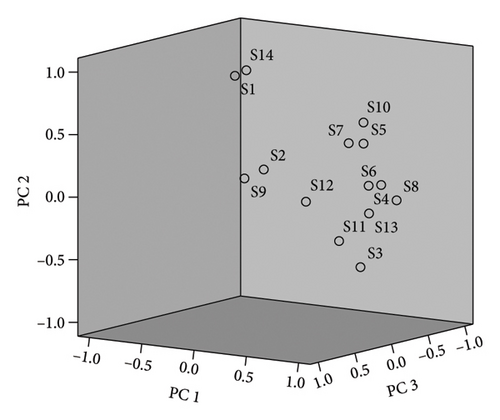
The factor loading matrix reflects the contribution rate of 14 common peaks to each principal component, and the larger the absolute value of the correlation coefficient is, the greater the contribution to the principal component; the results are shown in Table 4. Peaks 8 and 10 contributed more to the first principal component whereas peaks 1, 3, and 14 contributed more to the second principal component. Peaks 8–10 and 12 contributed more to the third principal component, and peak 2 contributed more to the fourth principal component. In order to differentiate the quality of the 15 PR batches, the comprehensive scores of each principal component factor were calculated and ranked by taking the principal component variance contribution rate as the weight coefficient, and the results are shown in Table 5. The overall scores are S14 > S1 > S15 > S2 > S7 > S5 > S8 > S12 > S4 > S11 > S9 > S13 > S10 > S6 > S3. The comprehensive scores of S3, S10, and S6 were low, which were quite different from those of other batches.
| Common peak | Load | |||
|---|---|---|---|---|
| 1 | 2 | 3 | 4 | |
| 1 | 0.064 | −0.299 | 0.023 | 0.067 |
| 2 | −0.037 | −0.026 | −0.079 | 0.831 |
| 3 | 0.039 | 0.215 | −0.017 | −0.001 |
| 4 | 0.119 | 0.018 | 0.092 | 0.101 |
| 5 | 0.172 | −0.095 | 0.082 | −0.054 |
| 6 | 0.177 | 0.017 | −0.145 | 0.107 |
| 7 | 0.138 | −0.101 | 0.179 | −0.101 |
| 8 | 0.212 | 0.050 | −0.228 | −0.124 |
| 9 | −0.13 | −0.037 | 0.65 | −0.142 |
| 10 | 0.262 | −0.157 | −0.275 | −0.147 |
| 11 | 0.006 | 0.151 | 0.119 | 0.127 |
| 12 | −0.023 | 0.046 | 0.246 | 0.192 |
| 13 | 0.091 | 0.087 | 0.088 | 0.061 |
| 14 | 0.083 | −0.309 | 0.051 | 0.054 |
| No | Principal component 1 | Principal component 2 | Principal component 3 | Principal component 4 | Comprehensive score | Sort |
|---|---|---|---|---|---|---|
| S1 | 0.912 | 2.004 | 1.434 | −1.571 | 1.368 | 2 |
| S2 | 0.325 | 1.271 | −2.420 | −0.535 | 0.540 | 4 |
| S3 | −1.521 | −0.445 | 0.471 | 1.705 | −1.404 | 15 |
| S4 | −0.495 | 0.152 | 0.396 | 1.505 | −0.342 | 9 |
| S5 | 0.085 | 0.829 | −0.111 | −0.403 | 0.290 | 6 |
| S6 | −1.185 | −0.541 | 0.669 | 1.342 | −1.137 | 14 |
| S7 | 0.231 | 0.632 | 1.553 | −0.861 | 0.410 | 5 |
| S8 | −0.238 | 0.787 | −0.578 | 0.003 | −0.012 | 7 |
| S9 | −0.549 | −0.147 | 0.200 | 0.269 | −0.511 | 11 |
| S10 | −0.724 | −1.538 | 0.076 | 0.337 | −1.053 | 13 |
| S11 | −0.167 | −1.216 | −0.733 | 0.196 | −0.505 | 10 |
| S12 | 0.070 | −1.208 | 0.524 | 0.184 | −0.249 | 8 |
| S13 | −0.615 | −0.866 | 0.111 | 0.289 | −0.771 | 12 |
| S14 | 2.292 | 0.271 | −1.224 | −1.179 | 2.025 | 1 |
| S15 | 1.579 | 0.014 | −0.368 | −1.280 | 1.351 | 3 |
3.3. Astaxanthin Content in PR
3.3.1. Validation of Quantitative Analytical Methods
The standard curve, peak area versus astaxanthin concentration, was plotted for linear regression analysis. The regression equation was Y = 6103X − 3.0383 (concentration range: 0.004–0.101 mg/mL, r = 0.9996).
Astaxanthin reference solution was injected continuously (6 times) for precision testing. The RSD of astaxanthin peak area is 0.76%, indicating good precision. The PR sample solution was injected for analysis at 0, 2, 4, 8, 12, and 24 h, and the RSD of astaxanthin peak area was 1.31%, indicating good stability. Six replicates of PR sample solutions were prepared and analyzed The average content of astaxanthin was 0.42%, and RSD was 1.74%, indicating that the sample preparation method had good repeatability. The sample recovery test was used to verify the accuracy of the method. The average recovery rate of astaxanthin was 101.64% and the RSD was 1.83%. The above data show that the method used in the experiment is stable and reliable.
3.3.2. Content Determination
Aastaxanthin was quantitatively evaluated in 15 PR batches samples (Table 6). The astaxanthin content varied considerably between different batches but is consistent with the amount stated on the product label, so we concluded that all products are satisfactory.
| No | Astaxanthin (%) | Quantity in label (%) |
|---|---|---|
| 1 | 0.416 | ≥ 0.4 |
| 2 | 0.613 | ≥ 0.4 |
| 3 | 0.401 | ≥ 0.4 |
| 4 | 0.404 | ≥ 0.4 |
| 5 | 0.417 | ≥ 0.4 |
| 6 | 0.405 | ≥ 0.4 |
| 7 | 0.401 | ≥ 0.4 |
| 8 | 0.514 | ≥ 0.4 |
| 9 | 0.414 | ≥ 0.4 |
| 10 | 0.425 | ≥ 0.4 |
| 11 | 0.583 | ≥ 0.4 |
| 12 | 0.660 | ≥ 0.4 |
| 13 | 0.405 | ≥ 0.4 |
| 14 | 0.867 | ≥ 0.7 |
| 15 | 0.731 | ≥ 0.7 |
3.4. Antiaging Effects
3.4.1. Life Determination
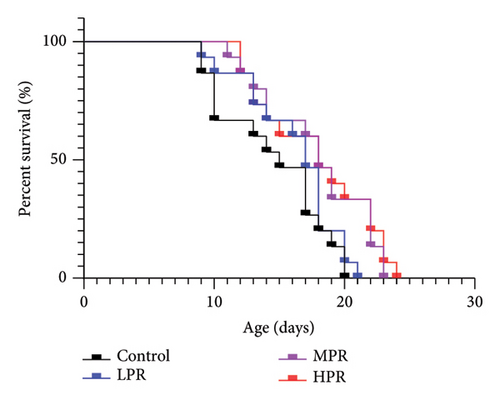
Lifespan is the most important indicator of aging in C. elegans [22]. The effect of feeding C. elegans with a feed supplemented with PR on the lifespan is shown in Table 7 and Figure 7. The average lifespan of the control group was 14.40 ± 0.23 days under normal experimental conditions, and the average lifespan increased to 15.89 ± 0.37, 16.91 ± 0.98, and 17.69 ± 0.20 days after the administration of feed supplemented with 50, 100, and 150 μg/mL PR, respectively, that is, the average lifespan increased by 10.34%. The maximum lifespan of the control group was 19.33 ± 1.15 days, but it increased to 20.33 ± 0.58, 22.00 ± 1.00 and 23.67 ± 0.58 days, respectively, after the administration of a feed with PR. That is, the maximum lifespan increased by 5.17%, 13.79%, and 22.41%, respectively. Moreover, the lifespan increased in a dose-dependent manner with the amount of PR, indicating that PR had the effect of prolonging the lifespan of adult C. elegans worms.
| Group | Average lifespan (d) | Percentage increase (%) | Maximum lifespan (d) | Percentage increase (%) |
|---|---|---|---|---|
| Control | 14.40 ± 0.23 | — | 19.33 ± 1.15 | — |
| LPR | 15.89 ± 0.37 | 10.34 | 20.33 ± 0.58 | 5.17 |
| MPR | 16.91 ± 0.98 | 17.44 | 22.00 ± 1.00 | 13.79 |
| HPR | 17.69 ± 0.20 | 22.84 | 23.67 ± 0.58 | 22.41 |
3.4.2. Reproductive Capacity
As shown in Figure 8, no significant difference (p > 0.05) was observed in the total oviposition of C. elegans worms treated with PR, as compared with the control group. Then, we assume that PR did not reduce the reproductive capability of C. elegans. Therefore, PR is not toxic to C. elegans. According to Chi Jianfeng’s study [23], the life extension in C. elegans mediated by ginseng berry saponins is a direct effect of the compounds rather than through inhibiting the reproduction of the nematode. Our experimental data are consistent with this work.

3.4.3. Athletic Ability
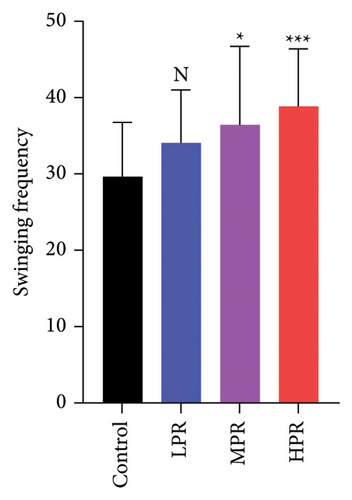
Exercise is, as a rule, healthy and can also increase life expectancy. The number of head swings of C. elegans indicates the kinesia of the nematode, and the more times it moves, the stronger the locomotor ability. The effect of PR supplementation on the number of head swings is shown in Figure 9. Each different concentration of PR tested had an effect on the number of head swings of C. elegans. Compared with the control group, there was no significative difference in C. elegans motility capacity at 50 μg/mL (p > 0.05). Nevertheless, at the two PR concentrations above 50 μg/mL (p < 0.05 or p < 0.001), a significant improvement in motility was observed as compared with the blank group, i.e., the MPR and HPR groups showed increased head swings by 22.93% and 31.03%, respectively. Consequently, our results show that PR not only has a strong effect on the motility of C. elegans but also prolongs the lifespan without harming the health of the nematode, which is consistent with the results of reproduction experiments.
3.4.4. Heat Stress Resistance
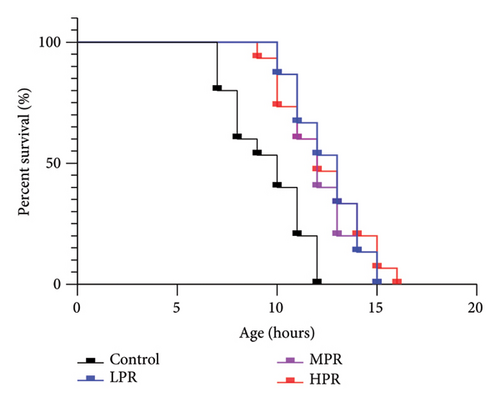
A large number of studies have shown that the higher stress resistance of C. elegans affects its lifespan [24, 25]. Therefore, the greater the ability to withstand external stress, the longer the life expectancy. Relatively high temperature (35°C) usually cause metabolic disorder in C. elegans and increase the production rate of reactive oxygen species (ROS), thus causing oxidative stress and reducing the lifespan of C. elegans. The effect of PR supplementation on the survival curves of C. elegans under heat stress is shown in Figure 10. The related survival time statistical analysis is shown in Table 8. Figure 10 shows that the survival curves of C. elegans treated with PR shifted significantly to the right under heat stress at 35°C, indicating that PR has the effect of improving the ability of C. elegans to resist heat stress. The average lifespan of the LPR, MPR, and HPR groups increased to 12.49 ± 0.20 h, 12.44 ± 0.27 h, and 12.62 ± 0.44 h, respectively, compared with the control group, i.e., 9.75 ± 0.20 h. Thereby, the average lifespan increased by 28.03% (p < 0.001), 27.57% (p < 0.001), and 29.39% (p < 0.001), respectively. Accordingly, the antiheat stress effect of PR may be related to its antioxidant ability, which may also be the reason for effectively prolonging the survival time of C. elegans.
| Group | Average lifespan (h) | Percentage increase (%) | Maximum lifespan (h) | Percentage increase (%) |
|---|---|---|---|---|
| Control | 9.75 ± 0.20 | — | 12.00 ± 0.00 | — |
| LPR | 12.49 ± 0.20 | 28.03 | 15.33 ± 0.58 | 27.78 |
| MPR | 12.44 ± 0.27 | 27.57 | 16.00 ± 1.00 | 33.33 |
| HPR | 12.62 ± 0.44 | 29.39 | 16.33 ± 0.58 | 36.11 |
3.4.5. Lipofuscin Content
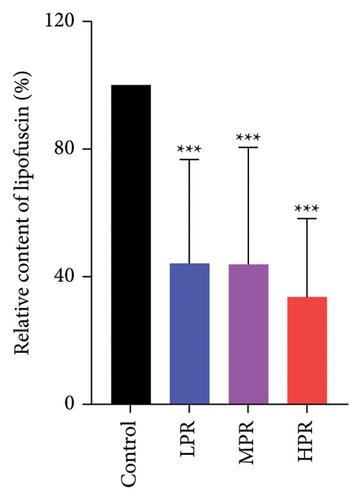
It is well known that the amount of lipofuscin in C. elegans gradually increases with age. Excessive lipofuscin precipitation can cause damage to the C. elegans worms, ultimately accelerating senescence [24]. The blue and green autofluorescence of lipofuscin in C. elegans was observed under an inverted fluorescence microscope, as shown in Figure 11. The fluorescence intensity of lipofuscin in the PR treatment groups was significantly lower compared with the control group. After 10 days, LPR, MPR, and HPR decreased by 55.87% (p < 0.001), 56.10% (p < 0.001), and 66.31% (p < 0.001), respectively, compared with the control group. Therefore, we found that PR reduced the content of lipofuscin in C. elegans.
3.4.6. MDA, SOD, CAT, and GSH Levels
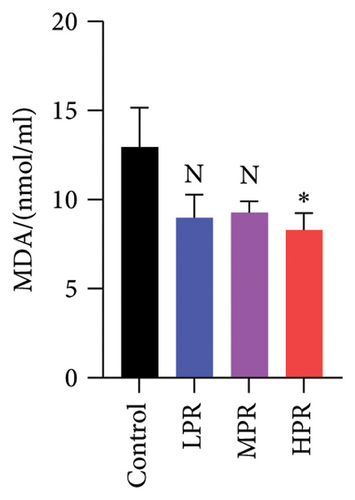
MDA is the end product of lipid peroxidation in living organisms and is widely used as a marker of oxidative damage [26]. Figure 12(a) shows no significant difference in MDA content in both the LPR and MPR groups (p > 0.05) as compared with the control group. However, the HPR group showed a significant decrease in MDA (p < 0.05), indicating that the highest PR concentration could inhibit lipid peroxidation to a certain extent.
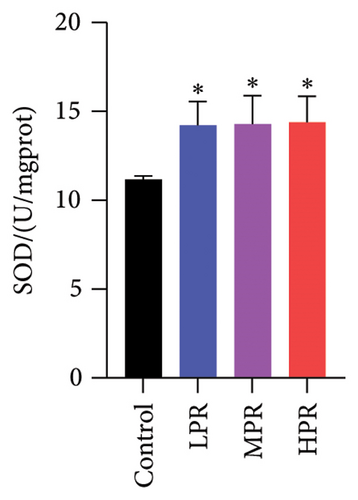
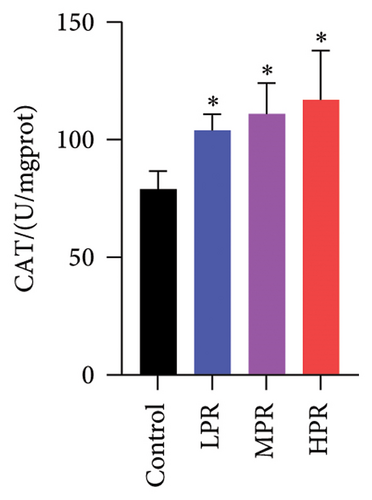
SOD and CAT are the main antioxidant enzymes of C. elegans. SOD activity catalyzes the disproportionation reaction of superoxide anions to form H2O2, while CAT activity catalyzes the transformation of H2O2 to water. These two activities of scavenging ROS protect and diminish oxidative damage of C. elegans [27]. As shown in Figures 12(b) and 12(c), feeding different quantities s of PR could significantly increase SOD and CAT enzyme activities (p < 0.05), the group fed the highest amount of PR (HPR group) has the highest SOD and CAT enzyme activities, which increased by 28.74% and 48.18%, respectively, compared with the control group.
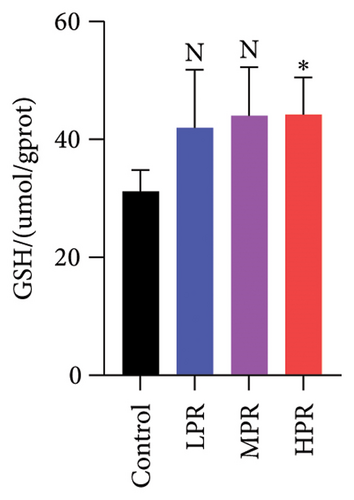
Moreover, GSH is a low-molecular-weight compound and powerful antioxidant composed of three amino acids: cysteine, glycine, and glutamic acid. Some of its primary functions include neutralizing toxins and free radicals, cellular repair, and antioxidant defense, among others. The amount of GSH is an important pointer of antioxidant activity in C. elegans [28]. As shown in Figure 12(d), feeding the different quantities of PR used in this work can increase similarly the GSH content in the nematode. The HPR group with the most significant increase is 41.81% higher than the blank group (p < 0.05). The above data indicate that the intake of PR in C. elegans could improve its antioxidant activity to a certain extent.
4. Discussion
HPLC fingerprint is a spectrum obtained through HPLC technology to characterize the chemical characteristics of complex mixtures (e.g., plant extracts used in traditional Chinese medicine). It reflects the chemical composition and content distribution of the sample by using peak retention time, peak area, and peak height data to separate and detect various chemical components in the sample. HPLC fingerprint is not a quantitative or qualitative analysis of a single component but a comprehensive characterization of multiple components in the sample. Therefore, HPLC fingerprintings are now widely used in the quality evaluation of plants used in traditional Chinese medicine, such as Echinacea purpurea (L.) Moench [29] and Poria cocos (Schw.) Wolf [30]. Its function is to comprehensively reflect the intrinsic quality of the sample and provide an important basis for the quality control, variety identification, origin tracing, and process optimization of traditional Chinese medicine. At the same time, the quality consistency and stability of the sample can be determined by comparing with the standard fingerprint. Through literature review, the HPLC fingerprint method has not been found for the quality evaluation of PR. Therefore, the fingerprints of 15 PR batches were studied by HPLC. The fingerprint of the PR samples was established, and 14 common peaks were identified. Among them, peak 8 belonged to astaxanthin and the similarity was 0.814–0.998, indicating that the composition and content of characteristic components obtained from each batch of PRs were relatively stable. Except for sample S3, the similarity of all other batches with the reference fingerprint was greater than 0.951. The relative peak area of 14 common peaks (with peak 8 as the reference peak) was used as a variable, and chemical pattern recognition (HCA and PCA) was used. The study found that although the overall similarity between different PR batches is high, differences in production processes may allow for the classification of certain batches, so the PR fingerprint can be used for the certification and quality evaluation of PR products in the future.
The content of astaxanthin in 15 batches of PR ranged from 0.401% to 0.867%. However, the content is consistent with the amount indicated on the product label, so the product is qualified. Existing PR manufacturers often use ultraviolet spectrophotometry to evaluate the astaxanthin content in PR. This method is simple and fast and does not require special equipment, but the reliability is lower than the method developed in this work, and the interference of many components cannot be avoided, which usually results in overrated measurements.
C. elegans is a model organism that has been widely used in multiple fields of scientific research to study topics such as aging, developmental biology, genetics, and neuroscience. Due to its relatively short lifespan and easy observation, the antiaging effect of active ingredients can be quickly studied on this nematode, and it is widely used in the efficacy evaluation of various natural active substances [24, 25]. In this work, we studied the effect of using a feed supplemented with PR on the lifespan and health status of C. elegans using three classical pointers used in aging research: lifespan, oviposition, and head swings rate. It was found that the use PR can prolong the lifespan of C. elegans, with an average increase ranging from 10.34% to 22.84%. After 4 days of PR treatment, the frequency of nematode head movement increased to a maximum increase of 31.03%. Lipofuscin, also known as a senile factor, is a residual substance formed by the action of lysosomes that can no longer be digested. Its accumulation increases with the age of an organism, which is one of the important markers of aging. After 10 days of PR treatment, the accumulation of lipofuscin decreased, with the most significant decrease of 66.31%. In addition, antistress is an important indicator of the ability of C. elegans to resist external stimuli during aging. PR can protect C. elegans from heat stress damage (or high temperature), as evidenced by the increased average lifespan of C. elegans, between 27.57% and 29.39%, When fed a diet supplemented with PR, the average lifespan of C. elegans was prolonged by 27.57%–29.39%. The accumulation of ROS promotes the oxidation of DNA, proteins, and lipids, thereby promoting the decline of cell function. SOD and CAT are key antioxidant enzymes that scavenge ROS and limit cell oxidative damage. MDA is an important gauge of oxidative damage, and the higher the MD content, the more severe the oxidative damage in the body. GSH is involved in intracellular free radical scavenging and maintenance of redox balance. In summary, we found that PR can diminish the MDA content and increase the activity of antioxidant enzymes SOD, CAT, and GSH levels, all of which support its potential antiaging effects. Therefore, PR supplementation in foods is a potential therapeutic strategy to delay aging that warrants further study.
5. Conclusion
In this study, we established the PR fingerprint chromatogram by HPLC. Next, the use of PCA and HCA for chemical pattern recognition analysis allowed us to preliminarily classify and distinguish the quality among different PR batches. Determination and comparison of the astaxanthin content in different batches of PR samples. In addition, the effect of PR supplementation on the antiaging activity of C. elegans was evaluated. PR extended the lifespan of C. elegans worms, kept their reproductive capacity, and improved their movement and heat stress resistance. At the same time, the use of PR diminishes the accumulation of lipofuscin in C. elegans and increased the antioxidant enzyme activities in the body.
In conclusion, we established a quality evaluation method for PR, which laid a foundation for its authenticity identification and quality control. It was found that PR had a significant antiaging effect on C. elegans. PR is rich in active components, such as astaxanthin, lipids, vitamins, proteins, and nucleic acids. Among them, astaxanthin has a definite antioxidant function [5, 6], which through scavenging ROS can reduce the oxidative damage to cells. Therefore, it may be one of the main active components of PR with potential antiaging activity.
Conflicts of Interest
The authors declare no conflicts of interest.
Author Contributions
Yalu Ji and Wenyu Han conceptualized the study; Wenyu Han and Yuan Cao proposed the methodology; Yuan Cao and Chong Chen performed analysis; Yuan Cao and Chong Chen wrote the original draft; Yalu Ji reviewed and edited the article; and Wenyu Han supervised the study. All authors have read and agreed to the published version of the manuscript. Yuan Cao and Chong Chen contributed equally to this study.
Funding
This work was financially supported through grants from the National Natural Science Foundation of China (Grant nos. 32222083 and 32072824) and the Fundamental Research Funds for the Central Universities.
Open Research
Data Availability Statement
The data used to support the findings of this study are available on request from the corresponding author.


