The In Vitro Antioxidant and Antiadipogenic Properties of Pigmented Flower Extracts of Geraniaceae and Lamiaceae Plant Families
Abstract
This study investigated the potential health-promoting properties of new sources of natural food colorants, namely pigmented flower extracts from Geraniaceae (Pelargonium grandiflorum, Pelargonium × hortorum, Pelargonium zonale hybrid) and Lamiaceae (Salvia aurea × dolomitica, Salvia dolomitica and Plectranthus zuluensis). In the Geraniaceae family, the main phenolic acids identified were hydrolysable tannins, while the main flavonoids were rutinosides of kaempferol and quercetin. In the Lamiaceae family, the main phenolic acids were caffeic acid and its derivatives, and the main flavonoids were naringin and neohesperidin. The total polyphenol content (TPC) and 2, 2-diphenyl-1-picrylhydrazyl (DPPH) radical scavenging activity were higher for Geraniaceae than for Lamiaceae species. For all extracts, oxygen radical absorption capacity (ORAC) was similar, except for P. zonale hybrid. These extracts protected Caco-2 cells against 2, 2′-azobis (2-amidinopropane) dihydrochloride (AAPH) generated oxidative damage. Similarly, all extracts, except P. zonale hybrid, effectively scavenged nitric oxide (NO) and reduced lipopolysaccharide (LPS)-induced NO formation in RAW 264.7 macrophages. Inhibition of the formation of advanced glycation end-products (AGE) was significant for P. grandiflorum and P. × hortorum. All pigmented flower extracts, except the P. zonale hybrid, reduced lipid accumulation in differentiated 3T3-L1 adipocytes. Treatment during adipocyte differentiation caused cell death, except for the P. zonale hybrid. In conclusion, related to antioxidant activity, inhibition of AGE formation and lipid accumulation in differentiated adipocytes, P. grandiflorum was the most active, while the P. zonale hybrid was the least. These differences are potentially related to the concentration, type and stability of the polyphenols found in these pigmented flower extracts. Overall, the pigmented flower extracts of Geraniaceae and Lamiaceae show a range of health-promoting properties that represent an additional benefit to their potential use as natural food colourants.
1. Introduction
Several research studies have showed possible negative health effects associated with the use of synthetic azo-based colourants in food, such as hyperactivity in children and cancer [1, 2]. These studies have driven the consumer demand for more natural ingredients, including natural colourants. South Africa has a wide variety of plant species from Geraniaceae (geranium family) and Lamiaceae (mint family), many of which are used in food and/or herbal medicine [3, 4]. The flowers from these are brightly coloured due to the presence of anthocyanins and potentially are sources of natural colourants for food applications. Furthermore, anthocyanins are also bioactive phenolic compounds and, in addition to being used as natural food colourants, potentially have further health benefits.
This is especially important as it is related to the worldwide surge in noncommunicable diseases, including diabetes mellitus type 2 (DMT2) [5]. In DMT2, reactive oxygen species (ROS) disrupt signalling and antioxidant pathways and deplete antioxidant elements, leading to ROS-mediated lipid, protein and DNA oxidation resulting in tissue damage [5]. Methyl-glyoxal (MGO) is a by-product of glycolysis and is increased in DMT2 patients, leading to the formation of AGE such as argpyrimidine and N-(carboxyethyl) lysine, also further contribute to DNA and protein damage [6]. Furthermore, there is a strong association between obesity and the development of DMT2 [7]. As such pigmented flower extracts could be used as natural dyes, and they can potentially contribute to reducing ROS, limiting the formation of MGO-induced advanced glycation end-products (AGE), and lipid accumulation.
Various studies on the bioactive properties of different plants in Geraniaceae and Lamiaceae have been conducted. Lis-Balchin and Deans [8] studied the antibacterial and antifungal properties of essential oils from Geranium species. The pharmacological properties were mainly attributed to tannins and the chemical components of essential oils [9]. Flavonoids from Pelargonium spp. have several associated health benefits such as anticarcinogenicity [10], hepatoprotection and modulation of immune and inflammatory function [11, 12]. The antioxidant and cancer cell cytotoxicity of Pelargonium graveolens (Geraniaceae) [13], as well as Thymus algeriensis, Ocimum basilicum and Salvia spp. (Salvia stenophylla, Salvia repens and Salvia runcinata) (Lamiaceae) [14] essential oil and aqueous leaf extracts [15]. Pereira et al. [10] identified that a Pelargonium sidoides tincture inhibited the proliferation and induced apoptosis in Jurkat leukaemia cells.
However, the health benefits (radical scavenging, anti-inflammatory, antiadipogenic and antiglycation activities) of the bioactive molecules in the pigment-rich flower extracts of Geraniaceae and Lamiaceae in cell lines are unknown. Therefore, this study aims to evaluate the antioxidant, NO scavenging, AGE inhibitory and antiadipogenic activities of pigmented flower extracts from Geraniaceae (Pelargonium grandiflorum, P. × hortorum, Pelargonium zonale hybrid) and Lamiaceae (Salvia aurea × dolomitica, Salvia dolomitica and Plectranthus zuluensis).
2. Materials and Methods
2.1. Samples
Vouchers of the following taxa were identified and deposited at the HGWJ Schweickerdt Herbarium (PRU), P. grandiflorum (PRU 0132964), P. × hortorum (PRU 0132965), P. zonale hybrid (PRU 127870), S. dolomitica (PRU 124381), P. zuluensis (PRU 122333) and S. aurea × dolomitica (PRU 0132966). These plants are also cultivated on various campuses (Hillcrest-25°45′09″S 28°15′26″E and Hatfield-25°45′06″S 28°13′45″E) at the University of Pretoria. The flowers were collected in March-April 2021 and December 2022.
Cell cultures (Caco-2, Raw 264.7 and 3T3-L1 cells) and all chemicals were purchased from Sigma-Aldrich (Darmstadt, Germany).
The flower samples were air-dried at 27°C in an air convection oven for 24–48 h. After drying, the dried flower petals were ground into a fine powder using a Waring hand blender. Flower powder was stored in airtight resealable bags (ziplock) at 4°C.
2.2. Preparation of Pigmented Extracts
Five hundred milligrams of flower petal powder was extracted with 10 mL of 1% formic acid: water solution by magnetic stirring for 24 h. The supernatants were then filtered through a Buchner funnel under vacuum using Munktell filter paper (8–12 μm) and washed with 10 mL of solvent. Extracts were stored in plastic tubes wrapped with aluminium foil at −20°C until use. For the TPC and 2, 2-diphenyl-1-picrylhydrazyl (DPPH) radical scavenging assays, the extracts were diluted 10 times at a concentration of 5 mg/mL.
2.3. UPLC-MS Analysis of Phenolic Compounds
Chromatographic analysis of phenolic compounds was performed as described by Stander et al. [16]. A Waters Synapt G2 Quadrupole time-of-flight (QToF) mass spectrometer (MS) connected to a Waters Acquity ultra-performance liquid chromatograph (Waters, Milford, MA, USA) was used for high-resolution UPLC-MS analysis. Electrospray ionization was used in negative mode with a cone voltage of 15 V, desolvation temperature of 275°C, desolvation gas at 650 L/h and the rest of the MS settings optimized for best resolution and sensitivity. Data were acquired by scanning from m/z 150–1500 m/z in resolution mode as well as in MSE mode. In MSE mode, two channels of MS data were acquired, one at a low collision energy (4 V) and the second using a collision energy ramp (40−100 V) to obtain fragmentation data as well. The instrument was calibrated with sodium formate. Separation was achieved on a Waters HSS T3, 2.1 × 100 mm, 1.7 μm column. An injection volume of 2 μL was used, and the mobile phase consisted of 0.1% formic acid (Solvent A) and acetonitrile containing 0.1% formic acid as Solvent B. Gradient elution was done as follows: 100% A from 0 to 0.5 min, 74% A and 26% B from 0.5 to 6 min, 56% A and 44% B from 6 to 15 min and 0% A and 100% B from 15 to 17.5 min. Ionisation was in negative mode with a capillary voltage of 3 kV and cone voltage of 15 V. Identification was done by comparing chromatograms and retention times of phenolic constituents in the extracts with external phenolic acid and flavonoid standards as well as comparison of MS/MS fragmentation data and UV spectra with those of phenolic compounds reported in the literature. Quantification was done by comparing integrated peak areas of phenolic compounds in extracts with that of standards and from generated calibration curves.
2.4. Folin–Ciocalteu Method for Total Phenolic Content
A modified form of the Folin–Ciocalteu assay for a 96-well microplate was used to determine the total polyphenol content (TPC) [17]. One hundred microliters of pigmented flower extracts (5 mg/mL) or standard catechin solutions (concentration range of 0–0.35 mg/mL) were prepared in distilled water and placed in Eppendorf tubes and then 200 μL 10% Folin–Ciocalteu reagent was added to each tube. This was followed by the addition of 800 μL, of 250 mM Na2CO3 to each tube within 8 min after the addition of the Folin–Ciocalteu reagent. The solutions were vortexed and incubated for 2 h at room temperature. After incubation, 200 μL of the reaction mixture was placed in each well of a 96-well microplate, and the absorbance was read at 750 nm using a microplate reader. TPC was expressed as milligram catechin equivalents (CE) per g dry weight (DW).
2.5. DPPH Radical Scavenging Assay
A modified version of the DPPH radical scavenging assay as described by Cheng et al. [18] was used. In a 96-well microplate, 10 μL of the pigmented flower extract (5 mg/mL) or Trolox standards (concentration range 0–500 μM) was reacted with 190 μL, 0.102 mM DPPH solution, prepared in distilled water. The mixture was incubated in the dark at room temperature for 30 min, and then the absorbance was read at 570 nm with a microplate reader. The results were expressed as mmol Trolox equivalents/g (mmol TE/g) DW.
2.6. Oxygen Radical Absorption Capacity (ORAC) Assay
The method of Ou et al. [19], modified by Serem and Bester [20], was used. Ten-times dilutions of the extracts in 0.1 M phosphate buffered saline (PBS), pH 7.4, were prepared. One hundred and sixty-five μL of an 8.8-nM disodium fluorescein solution and 25 μL, 0.24 M 2, 2′-azobis (2-amidinopropane) dihydrochloride (AAPH) were reacted with 10 μL of each diluted extract (125 μg/mL) in the wells of a 96-well microplate. The mixtures were shaken, incubated at 37°C, and the fluorescence decay was measured every minute for 2 h at an excitation wavelength (Ex) of 485 nm and an emission wavelength (Em) of 520 nm, and the net area under the fluorescence decay curves was calculated to determine the ORAC values and expressed as mmol TE/g DW.
2.7. Cytotoxicity (Crystal Violet [CV] Assay)
Cells (Caco-2, RAW 264.7 and 3T3-L-1 cells) were plated at a density of 1 × 10⁴ in a volume of 90 μL for 24 h in wells of two 96-well microplates, before treatment with 10 μL of flower extracts (125 μg/mL) for 24 and 48 h, respectively, at 37°C. After exposure, cells were fixed with 11 μL of a 20% formaldehyde solution, final concentration 2% for 30 min at 37°C. The fixing solution was then removed, and plates were dried before 100 μL of CV staining solution was added for 30 min. The staining solution was then removed, the wells were rinsed with water and the plates were dried. After incubation, the CV solution was removed from the 96-well microplate by rinsing with water, and 50 μL of acetic acid was added, and the microplate was read at 630 nm using a microplate reader. The percentage of cell viability relative to the untreated control was determined.
2.8. Cellular Antioxidant Activity in Caco-2 Cells (Dichlorofluorescein Diacetate [DCFH-DA] Assay)
Caco-2 cells were seeded in a 96-well plate at a concentration of 1 × 10⁵ cells/well in a volume of 100 μL and incubated for 24 h at 37°C to allow cells to attach. Then, 50 μL, 75 μM DCFH-DA was added to each well, a final concentration of 25 μM. After 45 min of incubation at 37°C, the DCFH-DA solution was discarded and the wells were washed once with PBS. Fifty microlitres (125 μg/mL) of pigmented flower extracts were then added in triplicate to the wells. This was followed by the addition of 50 μL of an 8-mM AAPH solution. A positive control (cells exposed to DCFH-DA and AAPH only), and a negative control (cells exposed to DCFH-DA and PBS only) were included. The change in fluorescence was measured every 2 min for 60 min at an Ex of 485 nm and an Em of 530 nm. The gradient representing the change in fluorescence was calculated, and the data were expressed as percent oxidative damage relative to 100% oxidative damage for the positive control (cells exposed only to AAPH).
2.9. Nitric Oxide (NO) Scavenging Activity, Sodium Nitroprusside (SNP) Assay
Fifty microlitres, 5 mM SNP, in distilled water was added to 50 μL of the pigmented flower extract (625 μg/mL) and then incubated for 1 h at room temperature, in the dark. One hundred microliters of Griess reagent (mixture of 1% sulphanilamide and 0.1% N-[1-napththyl-ethylenediamine]) was added and incubated for another 10 min at room temperature followed by measuring the absorbance at 570 nm. From a standard NaNO2 (0–0.1 mM) curve, the amount of NO scavenged was calculated and expressed as mM NO2 equivalents.
2.10. Nitric Oxide Scavenging Activity in RAW 264.7 Cells
The method was carried out as described by Kim et al. [21] with modifications. To RAW 264.7 cells, 1.25 × 10⁶/mL in Dulbecco’s Modified Eagle Medium (DMEM) supplemented with 10% foetal bovine serum (FBS) and 1% antibiotics (DMEM/FBS), 10 μL pigmented flower extract (125 μg/mL) + 10 μL lipopolysaccharide (LPS) were added together in each well of a 96-well plate. The final concentrations were 1.0 × 10⁶/mL cells and 0.1 μg/mL LPS. After incubation at 37°C, 5% CO2 for 24 h, to 50 μL of the supernatant, 50 μL Griess reagent was added, and the absorbance was measured at 570 nm. Results were expressed as % NO produced relative to the positive control (RAW 264.7 cells with LPS only), 100% NO produced.
2.11. Inhibition of AGE
The inhibition of AGE formation was evaluated according to the method of Siddiqui et al. [22]. A 100-μL aliquot of pigmented flower extract was added to 100 μL 40 mg/mL bovine serum albumin (BSA), 100 μL MGO and 100 μL PBS (pH7.4). The sample control contained 100 μL pigmented flower extract, 200 μL PBS and 100 μL BSA, and the positive control was 100 μL BSA with 100 μL MGO added to 200 μL PBS. All mixtures were incubated at 37°C for 1 week, and fluorescence was measured at an Ex and Em of 330 and 420 nm, respectively. The results were expressed as % of AGE formed relative to the positive control.
2.12. Cellular Antiadipogenic Activity in 3T3-L1 Cells
2.12.1. Reduction of Formed Lipid Droplets
3T3-L1 cells were plated at a concentration of 1 × 10³/100 μL in a 96-well plate and were cultured until confluent after 3 days. On the fourth day, cells were stimulated to differentiate using 100 μL differentiation Medium 1 (DMEM/FBS supplemented with final concentrations of 10 μg/mL insulin, 0.25 mM IBMX, 1 μM dexamethasone and 2 μM rosiglitazone [DM1]). DM1 was replaced every 3 days for 6 days. On the 10th day, DM1 was replaced with differentiation Medium 2 (DMEM with 10 μg/mL insulin (DM2)) for 3 days. On Day 14, DM2 was replaced only with DMEM (90 μL) only. The cells were then treated with 10 μL of pigmented flower extracts (125 μg/mL) and further incubated for 48 h at 37°C, 5% CO2. After incubation, cells were assessed microscopically for lipid droplet reduction following oil red O (ORO) staining.
2.12.2. Prevention of Lipid Droplet Accumulation
The differentiation of 3T3-L1 cells was carried out as mentioned above. To assess the prevention of lipid formation, at each change in the medium, 10 μL of pigmented flower extract was added for the duration of the differentiation process. Once the differentiation period was over, cells were microscopically evaluated for lipid droplet accumulation using ORO staining.
2.12.3. ORO Staining
The staining method was carried out according to Theerakittayakorn and Bunprasert [23] with modifications. The cells exposed were fixed with 2% formaldehyde (v/v) for 30 min at 37°C, 5% CO2. The solution was then discarded, and the plate was dried before the cells were stained for 30 min with freshly diluted ORO solution (three parts of 0.5% ORO (w/v) in 60% isopropyl alcohol and two parts water). Following staining, the stain was removed, and the wells were washed with water and the plate dried. Images of cells stained with stained lipid droplets were collected with light microscopy (Olympus, Tokyo, Japan).
2.12.4. Nile Red Staining
To quantify the amount of accumulated lipid, the method described by Theerakittayakorn and Bunprasert [23] with modifications was used. The cells exposed were fixed with 2% (v/v) formaldehyde for 30 min at 37°C, 5% CO2. After fixing, the solution was decanted, the plate was dried and the wells were washed with 300 μL PBS. The PBS was then removed and replaced with 100 μL of PBS, and then the background fluorescence was measured at an Ex of 485 nm and an Em of 590 nm. A volume of 1 μL of a 100 μM Nile Red staining solution was then added (final concentration, 1 μM) and incubated in the dark for 3 h. The plate was then washed once with 300 μL PBS, before adding a volume of 100 μL PBS to each well and measuring fluorescence again. Data were expressed as % of the lipid formed relative to the control.
3. Statistical Analyses
Triplicate experiments were conducted, and one-way analysis of variance (ANOVA) was conducted using SPSS software. Means were separated (p < 0.05) using the least significant difference (LSD), Tukey and Scheffe tests at p < 0.05.
4. Results and Discussion
4.1. Quantification of Phenolic Acids and Flavonoids in Pigmented Flower Extracts From the Geraniaceae and Lamiaceae Families
Tables 1 and 2 show the phenolic acid and flavonoid contents, respectively, of pigmented flower extracts from the Geraniaceae and Lamiaceae plant families. The main phenolic acids in the Geraniaceae species were hydrolysable tannin types (β-glucogallin [10–38 mg GAE/g], penta [1 mg GAE/g] and tetra-galloyl glucose [4 mg GAE/g]) and p-coumaric acid (14–15 mg CouE/g) and its derivative p-coumaroylglucose (5–13 mg CouE/g). The main phenolic acids in the Lamiaceae plant species were caffeic acid (1–3 mg CAE/g), rosmarinic acid (4–48 mg CAE/g) and its derivatives such as sagerinic acid (0.1–33 mg CAE/g) and salvianolic acid B (6–26 mg CAE/g). The main flavonoids in the Geraniaceae flower species were rutinosides of kaempferol (1188–1468 μg QRE/g) and quercetin (47–693 μg QRE/g), quercetin-3-O-glucoside (isoquercetin) (6–1043 μg QRE/g) and luteolin-7-O-glucoside (158–619 μg AE/g). The main flavonoids in the Lamiaceae flower species were naringin (50 μg NE/g) and neohesperidin (607 μg NE/g).
| Geraniaceae | Lamiaceae | |||||
|---|---|---|---|---|---|---|
| P. grandiflorum | P. × hortorum | P. zonale hybrid | S. aurea × dolomitica | S. dolomitica | P. zuluensis | |
| ∗∗∗ β-Glucogallin (galloyl-β-D-glucoside) | 10 ± 0 | 38 ± 0 | 28 ± 0 | 0.12 ± 0 | ND | 0.05 ± 0 |
| ∗Syringic acid | ND | ND | ND | 2 ± 0 | 1 ± 1 | ND |
| ∗Caffeoyltartaric acid | 6 ± 1 | ND | ND | ND | ND | ND |
| ∗∗ p-coumaric acid | ND | 14 ± 0 | 15 ± 0 | ND | ND | 0.2 ± 0 |
| ∗∗ p-coumaroylglucose | ND | 5 ± 0 | 13 ± 0 | ND | ||
| ∗Caffeic acid | ND | ND | ND | 1 ± 0 | 2 ± 0 | 3 ± 0 |
| ∗∗∗Tetra-O-galloyl-glucose | 4 ± 0 | ND | ND | 0.1 ± 0 | ND | ND |
| ∗∗∗Penta-O-galloyl-glucose | 1 ± 0 | ND | ND | ND | ND | ND |
| ∗Rosmarinic acid derivative | ND | ND | ND | 22 ± 2 | 12 ± 1 | ND |
| ∗Sagerinic acid | ND | ND | ND | 30 ± 1 | 33 ± 3 | 0.1 ± 0 |
| ∗Rosmarinic acid | ND | ND | ND | 44 ± 2 | 48 ± 4 | 4 ± 0 |
| ∗Salvianolic acid B | ND | ND | ND | 26 ± 2 | 6 ± 0 | ND |
| Total phenolic acids | 21 | 58 | 56 | 125 | 102 | 8 |
- ∗mg CAE/g: caffeic acid equivalents.
- ∗∗mg CouE/g: coumaric acid equivalents.
- ∗∗∗mg GAE/g: gallic acid equivalents.
| Geraniaceae | Lamiaceae | |||||
|---|---|---|---|---|---|---|
| P. grandiflorum | P. × hortorum | P. zonale hybrid | S. aurea × dolomitica | S. dolomitica | P. zuluensis | |
| ∗Quercetin-3-O-rutinoside (rutin) | 693 ± 51 | 78 ± 0 | 47 ± 0 | ND | ND | ND |
| ∗Quercetin-3-O-glucoside (isoquercetin) | 1043 ± 28 | 83 ± 8 | 6 ± 0 | ND | ND | |
| ∗Kaempferol-3-O-rutinoside | 1468 ± 79 | 1533 ± 0 | 1188 ± 0 | ND | ND | ND |
| ∗Kaempferol-3-O-glucosylgalactoside | ND | 144 ± 0 | 49 ± 0 | |||
| ∗Robinin (kaempferol-3-O-robinoside-7-O-rhamnoside) | ND | ND | 567 ± 0 | ND | ND | ND |
| ∗∗∗Apigenin-7-O-glucoside | ND | ND | ND | ND | ND | 191 ± 2 |
| ∗∗Naringin | ND | ND | ND | 50 ± 9 | ND | ND |
| ∗∗Neohesperidin | ND | ND | ND | ND | 607 ± 39 | ND |
| ∗∗∗Luteolin-7-O-glucoside | 158 ± 8 | 619 ± 95 | 326 ± 76 | ND | ND | 11 ± 0 |
| Total flavonoids | 3361 | 2458 | 2182 | 50 | 607 | 202 |
- ∗Flavonols: μg QRE/g: quercetin–rutinoside equivalents.
- ∗∗Flavanones: μg NE/g: naringin equivalents.
- ∗∗∗Flavones: μg AE/g: apigenin equivalents.
P. × hortorum contained the highest total phenolic acid content (58 mg/g) in the Geraniaceae plant family followed closely by P. zonale hybrid (56 mg/g) and P. grandiflorum (21 mg/g) while for the Lamiaceae, S. aurea × dolomitica contained the highest total phenolic acid content (125 mg/g) followed by S. dolomitica (102 mg/g) and P. zuluensis (8 mg/g). For the Geraniaceae, the P. grandiflorum extract contained the highest total flavonoids (3361 μg/g) followed by P. × hortorum (2458 μg/g) and P. zonale hybrid (2182 μg/g), while for the Lamiaceae, S. dolomitica (607 μg/g) contained the highest total flavonoids followed by P. zuluensis (202 μg/g) and S. aurea × dolomitica (50 μg/g). With the exception of P. zuluensis, the Lamiaceae extracts generally had higher total phenolic acid contents compared to the Geraniaceae by up to 6 times (Table 1). In contrast, the extracts from all the Geraniaceae species had overwhelmingly higher total flavonoid content than the Lamiaceae by up to 67 times (Table 2).
4.2. TPC and DPPH Radical Scavenging Activity
Geraniaceae pigmented flower extracts generally had significantly (p < 0.05) higher TPC and DPPH radical scavenging activity than Lamiaceae flower extracts (Table 3). The highest TPC was found for P. grandiflorum and the lowest for P. zuluenis, which translates into a corresponding six-fold higher antioxidant activity, evaluated with the DPPH assay for P. grandiflorum compared to P. zuluenis. The observed higher TPC and DPPH radical scavenging activity of Geraniaceae flower extracts compared to Lamiaceae could be related to the higher levels of phenolic compounds (particularly total flavonoids) in the Geraniaceae (Table 2). Furthermore, in a previous study, Venter et al. [24] reported that the total anthocyanin content of these Geraniaceae species was 45 times higher than that of the Lamiaceae species. In general, these observations indicate that in addition to anthocyanins, the phenolic acids (Table 1) and flavonoids (Table 2) identified in the Geraniaceae flowers (P. grandiflorum, P. × hortorum and P. zonale hybrid) and the Lamiaceae flowers (S. aurea × dolomitica, S. dolomitica and P. zuluensis) could contribute significantly to the polyphenol content and antioxidant activity.
| Sample | Total phenolic content (TPC) mg CE/g extract | DPPH radical scavenging antioxidant activity (μmol TE/g) |
|---|---|---|
| Geraniaceae | ||
| Pelargonium grandiflorum | 560f ± 3.25 | 2435f ± 1.25 |
| Pelargonium × hortorum | 338ce ± 0.38 | 1746e ± 3.57 |
| Pelargonium zonale hybrid | 311d ± 1.46 | 1208d ± 5.95 |
| Lamiaceae | ||
| Salvia aurea × dolomitica | 309c ± 0.30 | 855c ± 0.09 |
| Salvia dolomitica | 222b ± 3.60 | 622b ± 0.89 |
| Plectranthus zuluensis | 108a ± 0.16 | 369a ± 0.14 |
- Note: Values are mean ± SD. Mean values with different superscript letters (a, b, c, d, e, and f) within columns differ significantly (p ≤ 0.05).
- Abbreviations: CE, catechin equivalents; TE, Trolox equivalence.
4.3. Cytotoxicity of Pigmented Flower Extracts
No Caco-2 cell cytotoxicity was observed at the concentration of 125 μg/mL for all flower extracts after 24- (Figure 1(a)) and 48-h (Figure 1(b)) incubation. The Caco-2 cells showed a significant (p ≤ 0.05) increase in viability (compared to the cell control) after treatment with the flower extracts at a concentration of 125 μg/mL. No significant (p ≤ 0.05) difference in cell viability was observed for the 24- and 48-h treatments. For RAW 264.7 cells, no cytotoxicity was observed when the extracts were applied at a concentration of 250 μg/mL (Figure 2(a)) and also at the lower concentration of 125 μg/mL (Figure 2(b)) after the 24-h treatment. For 3T3-L1 adipocytes, there was no significant (p ≤ 0.05) reduction in cell viability for all extracts at a concentration of 250 μg/mL except for the P. grandiflorum (Geraniaceae) pigmented flower extract. The P. grandiflorum (Geraniaceae) pigmented flower extracts reduced cell viability by about 40% after 72 h (Figure 3).
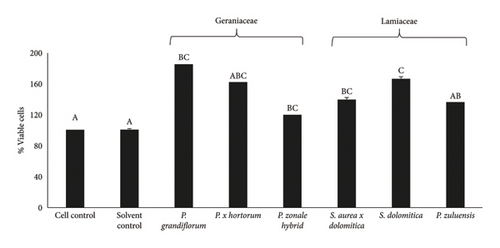
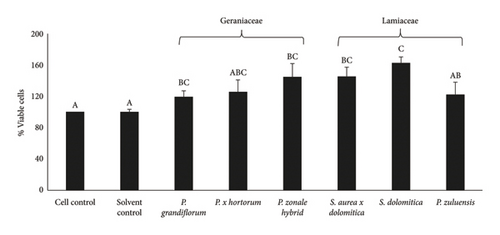
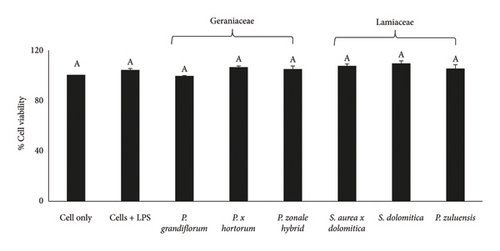
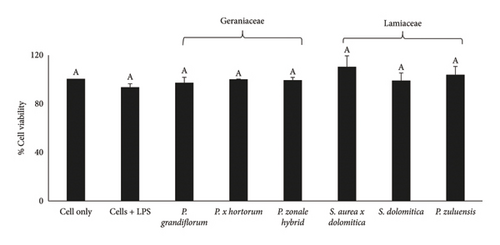
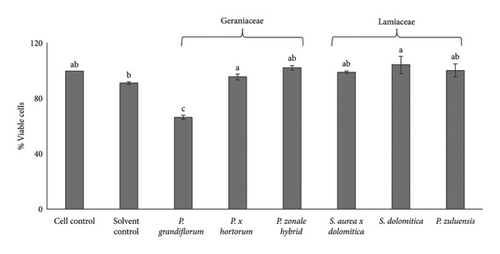
Based on the above results from the cytotoxicity studies, a nontoxic concentration of 125 μg/mL of the pigmented flower extracts was used in the Caco-2 antioxidant radical scavenging activity assays. For NO radical scavenging assays using RAW 264.7 cells and antiadipogenic assays involving 3T3-L1 adipocytes, a higher nontoxic concentration of 250 μg/mL was used.
4.4. ORAC and Cellular Antioxidant Activity
In both the ORAC and the cellular antioxidant assay, AAPH is used to generate peroxyl radicals that are physiologically relevant. The ORAC assay measures the ability of antioxidant molecules to quench the peroxyl radical through the hydrogen transfer mechanism [25], while the antioxidant effects measured in cellular models are more complex. Exposure to peroxyl radicals can lead to membrane lipid peroxidation, protein carbonylation and the activation of cellular antioxidant pathways. The antioxidant effect is complex and can involve direct extracellular and/or intracellular scavenging and/or activation of antioxidant pathways.
Figure 4(a) shows the ORAC values and the Caco-2 cellular antioxidant activity of the pigmented flower extracts of Geraniaceae and Lamiaceae. There was no significant difference (p < 0.05) in the ORAC values of all extracts. The ORAC values reported in the present study were within the range of 10–11 μmol TE/g. The differences between the antioxidant activity measured with the DPPH and ORAC assays may be related to the different reaction mechanisms. The ability of DPPH to quench hydrogen transfer is slow and the electron transfer mechanism is favoured [25], whereas, in contrast, the ORAC assay only measures hydrogen atom transfer effects.
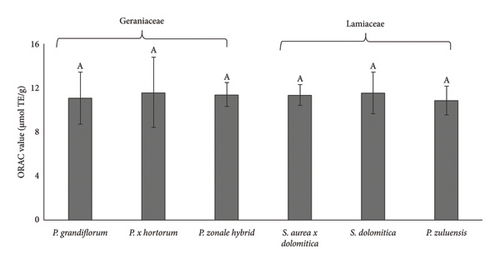
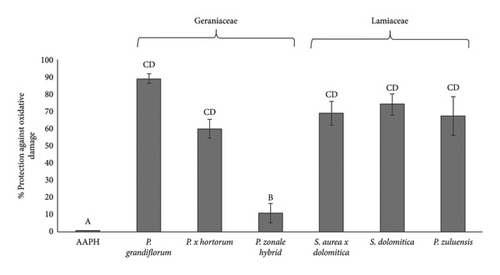
Figure 4(b) shows the Caco-2 cellular antioxidant activity of the pigmented flower extracts from the Geraniaceae and Lamiaceae plant families. For Geraniaceae species, the percentage protection against the oxidative effects of AAPH was similar for P. grandiflorum, P. × hortorum and Lamiaceae species, respectively, but was reduced for P. zonale hybrid. This could be due to the enhanced stability and antioxidant activity as a result of possible intramolecular interactions of their aromatic acylated anthocyanins and intramolecular interactions between these aromatic acylated anthocyanins (dimalonylawobanin (delphinidin-3-(6-pcoumaroylglucoside)-5-(4,6 dimalonylglucoside and malvidin-3-(6-p-coumaroylglucoside)-5-(4-malonylglucoside)) (as identified by Venter et al. [24]) and phenolic acids (rosmarinic acid and its derivatives such as sagerinic acid and salvianolic acid) as identified in this study (Table 1) in the Lamiaceae pigments. These interactions may confer stability to the anthocyanins from the Lamiaceae pigments and maintain their antioxidant activity. The cellular antioxidant activity did not necessarily follow the same trends as the TPC, DPPH (Table 3) or ORAC (Figure 4) data, and this could be related to the complexity of the reaction as indicated above and the stability of the polyphenol. Most importantly, the observed Caco-2 cellular antioxidant activity of the extracts is an indication of their potential to protect against oxidative stress.
4.5. Inhibition of AGE Formation
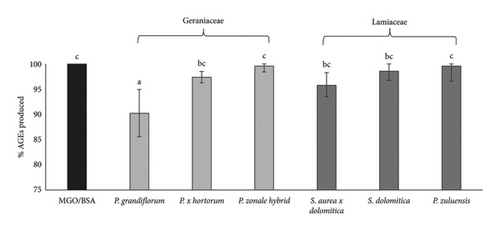
P. grandiflorum and P. × hortorum (Geraniaceae) pigmented flower extracts, at a concentration of 125 μg/mL, showed a significant (p < 0.05) reduction in AGE formation (∼9% and ∼7%, respectively) compared to the MGO/BSA control (Figure 5). A high and negative Pearson correlation (r) was obtained between TPC and AGE produced for both Geraniaceae (−0.98) and Lamiaceae (−0.95). This correlation suggests that the phenolic compounds present in the pigmented extracts could be responsible for the observed decreases in AGE formation and provide an indication of the antidiabetic properties of the extracts.
4.6. Nitric Oxide (NO) Radical Scavenging Activity
ROS generated in the body can activate several signal transduction cascades that lead to elevated levels of the superoxide radical and NO, which can react with each other, forming highly reactive peroxynitrite [26]. The scavenging of NO radical effectively reduces the levels of peroxynitrite, and this is used as an indicator of anti-inflammatory properties.
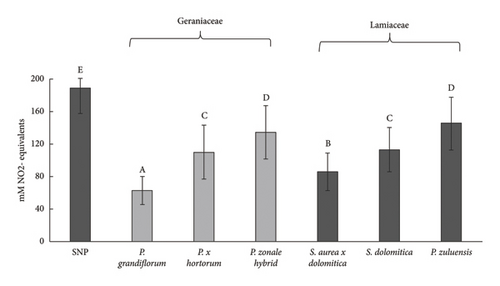
The NO scavenging activity of the pigmented flower extracts of Geraniaceae and Lamiaceae is shown in Figure 6. These extracts significantly reduced NO production compared to the SNP control (Geraniaceae: 27%–64% reduction and Lamiaceae: 22%–51% reduction). All extracts scavenged NO, with the extracts of P. grandiflorum being the most active. There was a strong positive correlation (r = 0.90 for Geraniaceae and r = 0.99 for Lamiaceae) between TPC and NO scavenging activity, indicating that the phenolic compounds in the pigmented extracts contributed significantly to the observed NO scavenging activity (Figure 6(a)). Therefore, both the peroxyl radical and the NO scavenging activity of P. grandiflorum indicate that this flower extract is most effective in preventing peroxynitrite formation and hence exerting anti-inflammatory properties.
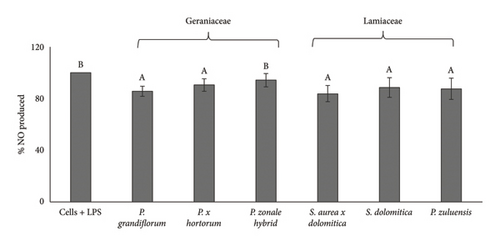
RAW 264.7 macrophages increase production of NO upon stimulation with LPS. This cell line is used extensively to study anti-inflammatory properties by determination of the NO radical scavenging activity of extracts in RAW 264.7 cells. All pigmented flower extracts of Geraniaceae and Lamiaceae, except for the P. zonale hybrid extract, significantly (p < 0.05) reduced LPS-induced NO in RAW 264.7 cells compared to control. For both cellular antioxidant activity (Figure 4(b)) and NO scavenging in RAW 264.7 cells (Figure 6(b)), the P. zonale hybrid had the lowest activity.
The NO scavenging activity of pigmented flower extract in RAW 264.7 cells were generally similar and nonsignificant (p > 0.05) between the Geraniaceae and Lamiaceae plant families despite the significantly higher TPC of the Geraniaceae pigmented extracts. The reason for the similar NO radical scavenging activity of the Lamiaceae pigmented extracts could be due to the aromatic acylated anthocyanin stability due to interactions with the phenolic acids as explained earlier.
4.7. Antiadipogenic Activity in 3T3-L1 Adipocyte Cells
As there is a strong association between obesity and the development of diseases such as type 2 diabetes [7], reducing cellular lipid accumulation (an indication of antiobesity properties) would be a beneficial health effect. At the extract concentration of 250 μg/mL, P. grandiflorum caused a significant reduction in cell viability of 40% after 24 and 48 h of exposure (Figure 7). After differentiation, lipid accumulation was observed in untreated controls (Figure 8, black circles) which were only significantly reduced after 24 h of exposure to extract of P. grandiflorum. Although some cytotoxicity was observed with the CV assay, the morphology of the differentiated 3T3-L1 cells was similar to the untreated control.
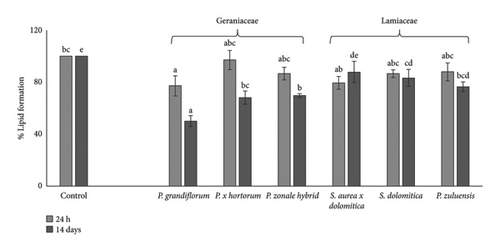
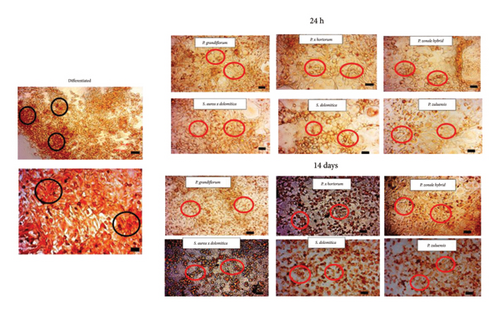
Treatment of 3T3-L1 cells for 14 days showed a significant decrease in lipid accumulation for all flower extracts except S. aurea × dolomitica which produced the highest lipid accumulation. Repeated exposure during differentiation resulted in cells with a condensed morphology (Figure 8), a hallmark of cell death. This was not observed for P. zonale hybrid flower extract. Kern et al. [27] reported that in cell culture medium, the degradation of delphinidin was associated with an increase in hydrogen peroxide levels from 15 to 45 min of treatment that was reduced after 24 h levels. Repeated treatment with the pigmented flower extracts potentially increases (although transitionally) hydrogen peroxide levels leading to a pro-oxidant effect, cellular toxicity and eventually cell death. Likewise, several phenolic acids and flavonoids also degrade in cell culture medium, leading to the formation of hydrogen peroxide [28]. On the contrary, the effect of a single exposure (which was used to determine cell viability and inhibition of lipid accumulation in differentiated adipocytes) did not lead to cell death.
The loss of cell viability may explain the percentage reduction in lipid accumulation after 14 days for all flower extracts, except the P. zonale hybrid. Although this flower extract has lower TPC, DPPH radical scavenging activity and Caco-2 cellular antioxidant activity, it reduces lipid accumulation during differentiation of 3T3 L1 cells to adipocytes.
5. Conclusions
The TPC and DPPH radical scavenging activity of the pigmented flower extracts was higher for Geraniaceae than for Lamiaceae most likely due to the significantly higher levels of total flavonoids in the Geraniaceae extracts. For all pigmented flower extracts, the antioxidant activity evaluated with the ORAC assay was similar. This translated (except for P. zonale hybrid) into the ability to protect Caco-2 cells against AAPH-generated oxidative damage. All extracts effectively scavenged NO in the chemical assay and in RAW 264.7 macrophages, expect P. zonale hybrid. The formation of AGE was significant for P. grandiflorum and P. × hortorum. These findings indicate that pigmented flower extracts contained high levels of polyphenols, with antioxidant activity, including relevant peroxyl scavenging activity. All pigment flower extracts except the P. zonale hybrid reduced lipid accumulation. Several treatments during the differentiation process caused cell death, except for the P. zonale hybrid. In conclusion, the pigmented flower extracts from Geraniaceae and Lamiaceae showed potential health-promoting properties in terms of protection against oxidative stress, anti-inflammatory, antidiabetic and antiobesity properties, and these are related to their content of bioactive phenolics.
Conflicts of Interest
The authors declare no conflicts of interest.
Funding
This research was funded by the South African DSI-NRF Centre of Excellence in Food Security, Grant number 21201.
Acknowledgements
The authors thank Randall Josephs and the HGWJ Schweickerdt Herbarium (PRU) for preparing and logging the herbarium vouchers.
Open Research
Data Availability Statement
The data are available on request from the authors.


