Computer Methods for the Antimicrobial Efficacy of Metal Nanoparticles Against MDR Microbes
Abstract
The current high mortality rate associated with infectious diseases is an alarming issue worldwide. The emergence of multidrug-resistant bacterial strains has led to the development of new ailments and the resurgence of old pathogenic infections. To address this issue, metal and metal oxide nanoparticles have emerged as potent nanoantimicrobial agents, offering an alternative to clinically used conventional antibiotics. This study employs support vector machine learning classification algorithms to identify the key attributes of inorganic nanoparticles that influence their antimicrobial efficacy. Key attributes such as type, size, and concentration of nanoparticles, along with transient analysis factors such as exposition time and bactericidal potency evaluation methods, are thoroughly analyzed and documented. The nonlinearity in this time-dependent data and the complexity of the potent size and concentration of these nano-antibiotics are simplified through a stepwise machine learning classification process involving encoding and decoding, supported by smart optimization of classifiers. These classifiers help identify the best attributes of nanoparticles to achieve the highest in vitro antimicrobial efficacy of unknown metallic nanoparticles in a robust and cost-efficient manner. The integration of machine learning techniques in nanomaterial research enhances the understanding and development of smart materials, and thus, the research in this domain can achieve noticeable milestones.
1. Introduction
Multidrug-resistant bacteria (MDR) have become a global challenge as it has rendered the treatment of drug-resistant infections with antibiotics very hard. As per the reports, almost all the pathogens, especially superbugs (multi- and pan-resistant bacteria), are now highly resistant to available antibiotics [1] as a consequence of improper and periodic use of antibiotics along with poor hygiene and sanitary conditions, climate changes, environmental factors, and unsafe drinking water. The extensive and misguided use of antibiotics in the COVID-19 pandemic has further raised the question regarding the microbial tolerance of antibiotics. This strong negative impact on clinical outcomes has resulted in increased morbidity and mortality rates worldwide. As per the WHO report, 0.7 million deaths are reported each year worldwide due to MDR bacterial infections, while treatment costs of superbug infections have reached up to US$20 billion annually only in the United States of America [2, 3]. According to the Global Antibiotic Research and Development Partnership (GARDP), every 6 s a person loses its life due to microbial resistance. This prevailing condition is a threat to “One Health” approach as humans, animals, and the environment of the ecosystem are all connected to contribute to global health security [4].
Antibiotic resistance, common in planktonic free-floating bacteria such as Pseudomonas aeruginosa, Staphylococcus aureus, and Streptococcus pneumonia, is due to the production of extracellular polymeric substances (EPS) that act as a barrier against traditional antibiotics [5]. The bacterial biofilm production further aggravates this situation. Altered phenotypes of biofilms with chemical heterogeneities and the presence of persister cells contribute to drug resistance and complicate treatment by primary antibiotics [6, 7]. The last resort to such a situation is the extensive use of high doses of antibiotics that results in unfavorable toxic side effects.
This scenario necessitates the development of novel antibiotic agents as a long-term therapeutic solution to combat drug resistance. Researchers have reported various novel antimicrobial agents such as bacteriocins, essential oils (EOs), antibodies, bacteriophages, and quorum-sensing inhibitors (QSI) as an alternative approach [8, 9]. Recently, the use of nanotechnology has offered a novel treatment strategy against MDR superbugs. Literature shows that metal and metal oxide nanoparticles (M/MO-NPs) such as Ag, Cu, ZnO, TiO2, and Fe3O4 have demonstrated attractive level of antibacterial potential against planktonic and biofilm infections [10, 11].
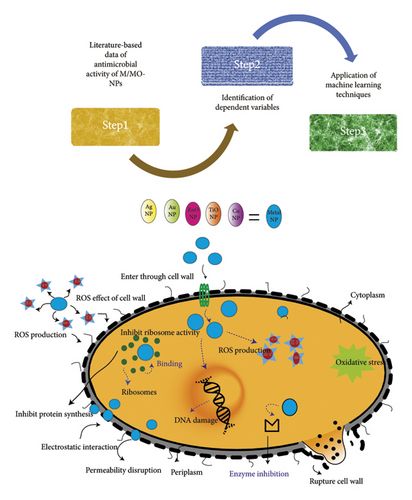
In contrast to standard antibiotics, nanoparticles provide a multipronged antibacterial action causing synchronized mechanical, physical, and chemical damages to microbial cells. Physicochemical properties of M/MO-NPs are dependent on their size, concentration, and morphology and play a key role in initiating several nanoparticle–microbe interactions such as hydrophobic interactions and receptor–ligand binding, electrostatic attraction, and van der Waals forces [12]. This results in targeting multiple cellular structures simultaneously instigating disruption of bacterial cell wall and membrane, generation of oxidative stress, and disturbance in vital cell functions [13]. A schematic antimicrobial action of M/MO-NPs is provided in Figure 1. Also, compared to antibiotics, M/MO-NPs are more stable at high temperature and pressure, thus offer better service life [14]. Being extrinsically stimulus-responsive materials, M/MO-NPs can be further manipulated to generate toxic substances or environment for MDR microbes killing. It is assumed that complexity of the antimicrobial action of NPs lowers the likelihood of bacterial resistance development as it is challenging for them to produce adaptive defenses [15]. As the antimicrobial potential of M/MO-NPs depends upon the size, concentration, and time of interaction and varies with the bacterial species, it is important to model their bactericidal efficacy against these factors in a view to harness the maximum bactericidal potential of nanomaterial-based antimicrobial agents. In the present work, different classification models are built to study the antibacterial potential of M/MO-NPs on common MDR bacteria using machine learning. Various M/MO-NPs are tested, and different variables such as size, concentration, time of exposition of NPs to bacteria, and method of in vitro antibacterial evaluation are studied. To the best of our knowledge, this work is the first report of a machine learning approach on this topic.
2. Materials and Methods
2.1. Materials
2.1.1. Collection of Data
Gram-negative bacteria, such as E. coli, K. pneumonia, and P. aeruginosa, are the most difficult to treat due to resistance against most current clinical antibiotic treatments. The data of in vitro antibacterial activity of M/MO-NPs against most common MDR bacteria, such as Bacillus subtilis, Escherichia coli, Klebsiella pneumonia, P. aeruginosa, S. aureus, Staphylococcus epidermidis, and Streptococcus mutans, were collected from the peer-reviewed published literature. Reported M/MO-NPs were synthesized by bottom-up approaches like wet chemical synthesis, sol gel, precipitation, microwave irradiation, and commercial methods. For biogenic synthesis, microorganisms such as fungi, bacteria, and viruses as well as plants were employed as natural reducing agents. The in vitro antimicrobial efficacy was evaluated by various standard protocols, that is, dilution, diffusion, and colony forming units (CFUs).
The different parameters such as size, concentration, exposure time, and antibacterial evaluation method of Ag, Au, Cu, Ag2O, Al2O3, CuO, CaO, MgO, TiO2, and ZnO NPs were used as dependent variables. The data were processed in a conventional manner by data assimilation for the development and validation of the model under study.
2.1.2. Quasi-SMILES
The term “quasi-SMILES” in machine learning refers to an expanded version of the standard Simplified Molecular-Input Line Entry System (SMILES) used to represent molecular activity or structures. It is a tool to represent the eclectic data available from the experimental results [16]. This enables more accurate predictions in quantitative structure–activity relationship (QSAR) modeling, especially when working with nanomaterials or complex experimental setups. Additional symbols are added to capture experimental conditions or other pertinent factors. Machine learning models can create more precise predictions of molecular activities or properties under various experimental settings by adding extra information through quasi-SMILES.
Quasi-SMILES is simply a string of codes describing the physicochemical properties and/or experimental conditions as an expansion of traditional SMILES. Quasi-SMILES used in the current study is type of M/MO-NPs, their concentration (mM), size (nm), time exposition (h), and in vitro antimicrobial evaluation method. An alphabet or number was employed to create the quasi-SMILES. Letters from T to Z are utilized to specify the drug-resistant bacteria; numbers 9, 6, 8, and 7 symbolized diffusion, dilution, CFU, and other assays, that is, PCR, plate count, agar overlay bioassay, and bioluminescence assay, respectively; letters a, b, and c were employed for time exposition of 12, 24, and 48 h, respectively; Latin numerals i–v were specified to define the NP concentration (mM); numbers from 1 to 5 were utilized to determine NP size, and letters H–Q were used for metallic NPs. A few examples of quasi-SMILES are mentioned in Table A2.
Applying this formula to our dataset, we obtained normalized values in the range (0.013, 1), ensuring all sizes were proportionally adjusted while preserving their relative differences.
By transforming the data into this bounded range, we simplified the subsequent coding process. The normalized values were then categorized into five discrete groups (e.g., 1, 2, 3, 4, and 5), which was significantly easier than directly coding the raw NPs sizes. The original data spanned a wide numerical range (2–300 nm), making it challenging to categorize effectively. In contrast, the normalized values allowed for a more uniform and structured classification, improving the model’s ability to detect size-dependent patterns efficiently.
2.2. Method Classifiers
An important domain of machine learning is the classification learner, and to date, several classifiers have been reported and are serving in the domain of science and engineering successfully [18, 19]. Routinely used classifiers have specific advantages and disadvantages when compared to other methods [20].
2.2.1. Support Vector Machines (SVM)
The SVM algorithm is a supervised solution of classification and regression and is a frequently used tool among other artificial intelligence tools for data handling.
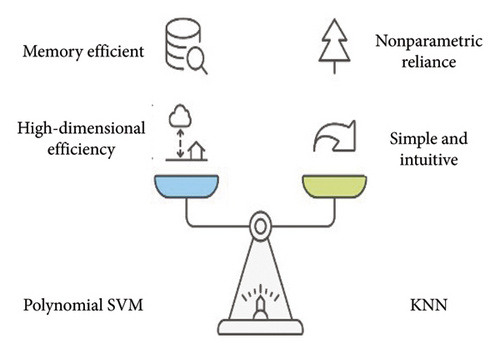
For example, the linear SVM is fast when trained, but it has a linear decision boundary and cannot be used for complex nonlinear data. However, polynomial SVM has a nonlinear decision boundary and can deal with the data with noise to a certain level but is computationally expensive and is sensitive to a slight alteration in hyperparameters. The key hyperparameters of polynomial SVM and its features are depicted in Figure 2.
On the other hand, radial basis function support vector machine (RBF-SVM) not only is high in accuracy, but is versatile; however, it takes a longer time to be trained and sometimes overfits. Gaussian SVMs are created with Gaussian kernel functions, which allows the separation of nonlinear data, by mapping the input data to Hilbert space.
2.2.2. K-Nearest Neighbors (KNN)
KNN is an option while classifying complex nonlinear datasets.
This method relies on the principle that data points with similar features are likely to belong to the same class. KNN is nonparametric; therefore, it does not assume any underlying data distribution.
The most important hyperparameter of KNN is the number of nearest neighbors and is represented in practice as k. A list of its key hyperparameters and features is provided in Figure 2.
In the context of the Minkowski and Chebyshev distance equations, P and Q represent two points in an n-dimensional space. Specifically, P is defined as (p1, p2, …, pn), where pi represents the ith component of the vector P. Similarly, Q is defined as (q1, q2, …, qn), where qi represents the ith component of the vector Q.
Additionally, KNN may involve other hyperparameters such as the weighting scheme for neighbors (uniform or distance-based weights) and optional preprocessing steps, for example, normalization and standardization.
When optimized via hyperparameter tuning techniques such as grid search, random search, or Bayesian optimization, KNN can perform better for several reasons. Firstly, finding the optimal value of “k” can lead to a more balanced trade-off between bias and variance, improving the algorithm’s generalization performance. Secondly, selecting the appropriate distance metric can better capture the underlying data patterns, leading to more accurate predictions. Thirdly, optimizing other hyperparameters and preprocessing steps can further enhance the algorithm’s performance and speed.
Overall, hyperparameter optimization can help all classifiers achieve better performance by fine-tuning their hyperparameters to the specific characteristics of the dataset. This optimization process can lead to improved accuracy, faster computation times, and better scalability, making the classifiers more effective for a wide range of machine learning tasks.
2.3. Bayesian Optimization
For Bayesian optimization of hyperparameters, the objective function is modeled with the aid of a Gaussian process (GP). The GP provides a probabilistic surrogate model of the objective function, to plan where to sample the next set of hyperparameters. A comprehensive illustration of this process is provided by Frazier et al. [22].
Here, the objective is to improve the hyperparameters, and thus, the focus is on the expected improvement (EI) achieved by Bayesian optimization.
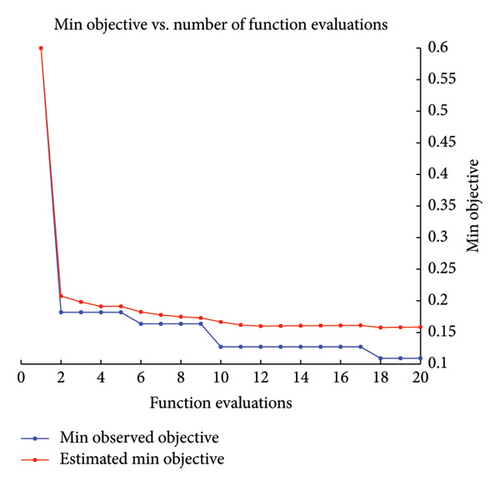
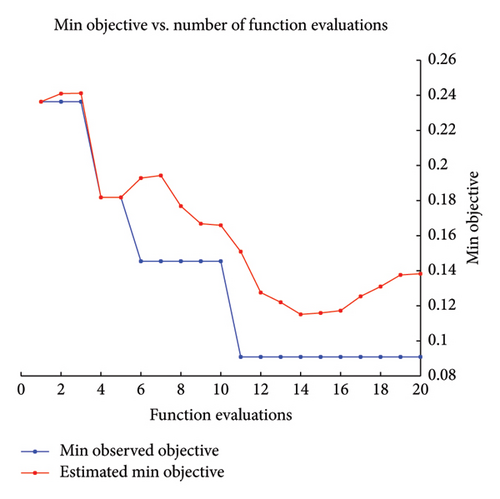
During this research, the Bayesian optimization (BayesOpt) was used to optimize the hyperparameters. The optimization and hyperparameter tuning process is shown schematically in Figure 3. Although all the numerical results are discussed in the next section, to highlight the feasibility of the BayesOpt, let us explore Figure 4(b). The Bayesian optimization process for the KNN classifier iterated through various values of “NumNeighbors” before settling on one as the optimal value. This dynamic selection process demonstrates the adaptability of the algorithm to explore different configurations and identify the most suitable model complexity for the dataset at hand.

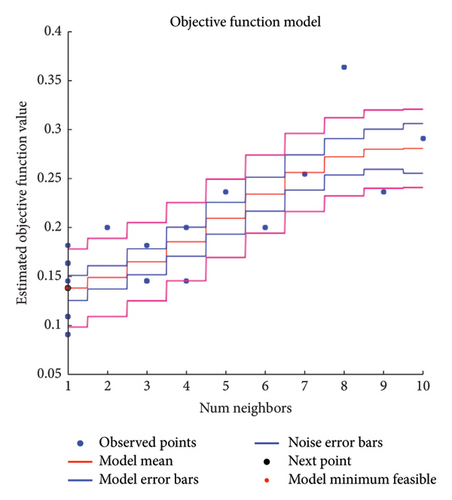
Categorizing predictors also influence the choice of optimal hyperparameters. By transforming predictors into categorical variables, the distance metric used in KNN calculations was altered. This change likely led the algorithm to favor a simpler model with “NumNeighbors = 1,” as it was more effective in capturing the underlying patterns in the data with the transformed predictors.
3. Results and Discussion
- •
Models were trained and structures were developed, leading to an encoded understanding of the data. Subsequently, conclusions were drawn for each class: time, concentration, size, and method.
- •
The results obtained by data decoding are listed in Table 1.
- •
The data directly represent NPs with specific attributes, including size, concentration, bacteria type against which they were used, and the time taken. This transformation enables a more direct analysis of the relationship between NPs and their effects on bacteria.
| Conc. | Size | Bacteria | Time | Method |
|---|---|---|---|---|
| 1 | 2 | Staphylococcus epidermidis, Streptococcus mutans | 24 or 48 h | 6, 9 |
| 1 | 3 | Bacillus subtilis, Escherichia coli, Klebsiellapneumoniae, Staphylococcus epidermidis, Streptococcus mutans | 24 or 48 h | 6, 8 |
| 1 | 5 | Escherichia coli, Klebsiellapneumoniae, Staphylococcus aureus, Streptococcus mutans | 24 h | 6, 9 |
| 2 | 2 | Escherichia coli, Staphylococcus aureus | 24 h | 8, 9 |
| 2 | 3 | Escherichia coli | 24 h | 6 |
| 2 | 4 | Staphylococcus aureus | 24 h | 9 |
| 3 | 1 | Bacillus subtilis, Escherichia coli, Staphylococcus aureus | 24 h | 9 |
| 3 | 2 | Escherichia coli, Pseudomonasaeruginosa, Staphylococcus aureus | 12 h | 7 |
| 3 | 3 | Bacillus subtilis, Klebsiellapneumoniae, Pseudomonas aeruginosa, Staphylococcusaureus | 24 h | 7 |
| 3 | 4 | Escherichia coli, Pseudomonasaeruginosa | 24 h | 7 |
In Step 1, the size, concentration, time, and method were studied. In Step 2, after learning pathways from these encoded data, bacteria responses to each categorical NPs based on their size and concentration were examined. In Step 3, the NPs were further decoded to their names and their effectiveness in killing bacteria, taking into account size and concentration as additional features, was studied. The process of encoding and decoding was essential in identifying potent combinations of NPs and bacteria, which would have been challenging to discern from the raw data due to the numerous possible combinations. By encoding the data initially, the NPs were categorized based on size, concentration, time, and method, allowing for a structured analysis. This structured approach helped to understand the relationships between these variables. After drawing conclusions from the encoded data, the information was decoded to directly represent NPs with specific attributes, such as size, concentration, and the bacteria they were effective against. This decoding process enabled a more direct analysis of the relationship between NPs and their effects on bacteria, ultimately leading to the identification of potent combinations that may have been overlooked in the raw data.
The details of these steps are provided in the following section.
3.1. Step 1
During this step, the data were studied for time as a response, and then, the response feature was changed to concentration and size. The summary of the obtained results is provided in the appendix. In this section, only the case when time was taken as a response is discussed for the demonstration of the method as the work is for data inference.
To simplify the analysis, the focus is on three key experiments categorized by time intervals a = 12, 24, or 48 h, and two outcomes: time = a or time ≠ a. Using these data, a machine learning model was trained to classify the data into these two categories based on time intervals.
Upon evaluating the model’s performance, the focus was solely on the combinations for which the trained model accurately classified the data. This led one to conclude that the specific combinations of nanoparticles and bacteria, along with their method and size selections, were optimal choices for the experimental work.
To summarize the best pairs, some results are presented here. When the classifiers were trained (both SVM and KNN) for a = 24 (these experiments were repeated for a = 12, 24, and 48, but for the sake of demonstration, only the case for a = 24 is presented here), the focus was on classifying the data for several features, with the selected method and nanoparticle size in this experiment as key predictors.
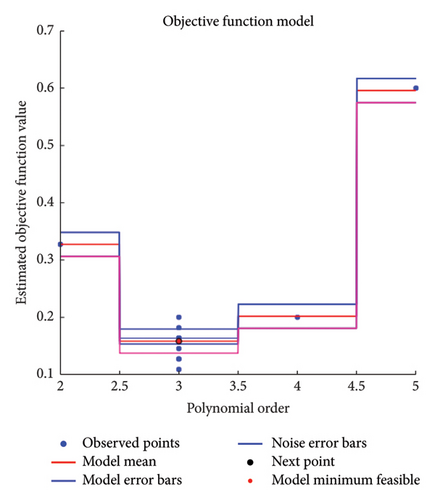
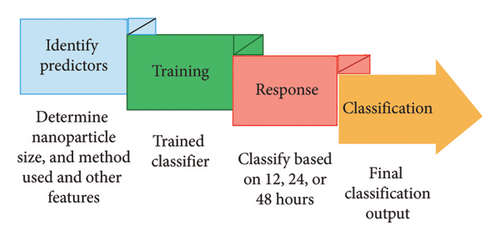
In Figure 4, the results of the hyperparameter optimization process are shown. For the SVM model, the polynomial order was the hyperparameter, Figure 4(a), and its best value was then used to train the final classifier. For the KNN model, the main hyperparameter is the number of neighbors. Bayesian optimization selects the optimal NumNeighbors value by exploring different values within a specified range as shown in Figure 4(b). Figure 5 presents the stepwise procedure of classification and Figure 6 (left SVM, right KNN) presents the classification outcome respectively. Note that each node is mapped on a group of datapoints. The details of iterative processes are provided in Figure 7 respectively.
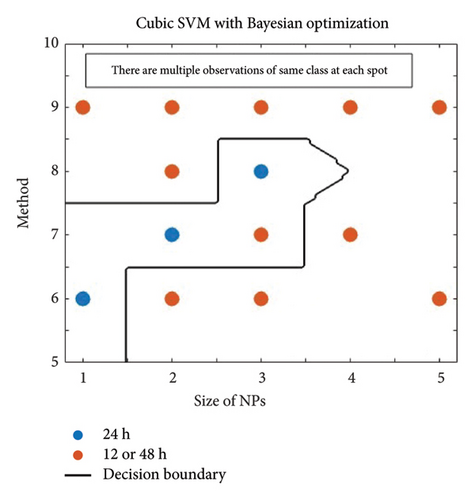
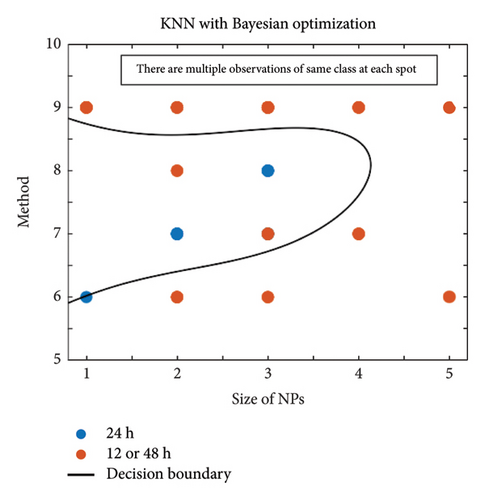
On the x-axis, one has the size of the nanoparticle as a predictor, categorized into five categories: 1, 2, 3, 4, and 5, as in Table A1. On the other hand, the predictor is along the y-axis as the method used, according to unique codes: 6, 7, 8, and 9. This way, different nanoparticles were grouped against different methods. For example, the blue Spots 2 and 7 represent all nanoparticles studied with size category 2 and method 7.
The classification results showed that nanoparticles with sizes and method categorized as 1 and 6 were effective in killing the bacteria B. subtilis, S. aureus, and S. epidermidis, within 24 h with method 6 (dilution), of size 1 (1–10 nm).
We evaluated for all the models, the performance check using various statistical metrics, including accuracy that ranged through (90%–92.5%), precision (87%–89.8%), recall (87%–90.2%), F1 score (85%–90.0%), and specificity (90%–93.4%), to comprehensively assess its classification ability. Additionally, we analyzed the area under the curve (AUC) for ROC, which achieved a value of 0.94, indicating strong discrimination between classes. The obtained results demonstrated reasonable values across these metrics, ensuring the model’s reliability and robustness in predicting outcomes. These evaluations provide confidence in the model’s utility for nanoparticle-based antibacterial strategies.
3.2. Step 2
- 1.
The bacterium E. coli was found to be susceptible to a majority of the tested concentrations, indicating that its susceptibility to NP treatments is relatively high. In contrast, S. aureus was only affected by a limited number of concentrations, suggesting that it may be more resistant to NP treatments compared to E. coli. Additionally, B. subtilis was predominantly killed by specific NP sizes, highlighting the importance of NP size in determining their effectiveness against different bacteria strains. These findings underscore the complex interplay between NP characteristics and bacterial susceptibility, which is crucial in developing effective NP-based antibacterial strategies.
- 2.
The results from the trained model provided valuable insights into this challenging task. One could conclude that the ideal concentration and NP size to effectively kill various bacteria strains differ significantly. For instance, the findings suggest that for S. aureus, a bacterium known to be antimicrobial drug-resistant, NP size 5, and concentration one were particularly effective. Conversely, for E. coli, which is also often drug-resistant, size 5 NPs at concentration one showed promising results. These results can be instrumental in guiding experimentalists toward selecting the most effective NPs for improving drug efficacy against drug-resistant bacteria strains.
- 3.
Intriguingly, the performed analysis revealed that lower concentrations and smaller NP sizes were effective against several bacteria strains. For example, S. epidermidis and S. mutans were efficiently targeted by size 2 NPs at concentration 1, corroborating findings in the literature that suggest these bacteria are more susceptible to NPs based on antimicrobial treatments compared to others. This aligns with the notion that lower concentrations and smaller sizes can enhance the efficacy of antimicrobial agents, potentially due to increased surface area and more efficient interaction with bacterial cells. Additionally, the obtained results highlight the importance of considering specific bacteria characteristics, such as drug resistance patterns, when designing NP-based antimicrobial strategies.
- 4.
The role of time in NP-mediated bacterial killing is also noteworthy. The performed analysis demonstrated that the duration of exposure varied across bacteria strains and NP sizes, suggesting a nuanced relationship between time and efficacy. For instance, E. coli exhibited sensitivity to shorter exposure times, with method 6 at concentration 1 and size 2 NPs showing efficacy within 24 h. In contrast, S. aureus required longer exposure times, as indicated by method 9 at concentration 1 and size 5 NPs, which showed effectiveness over 24 h. These findings underscore the importance of considering time as a critical factor in NP-based antimicrobial strategies, as different bacteria strains may require varying durations of exposure for optimal efficacy.
3.3. Step 3
- 1.
For the lowest concentration and medium size of NPs, AgNP effectively eradicated S. epidermidis and S. mutans within 24 h.
- 2.
For the lowest concentration and largest size, NPs (ZnO, TiO2) were effective against S. mutans, S. aureus, and Klebsiella pneumoniae within 24 h. This suggests that larger NPs may have better efficacy against certain bacteria, potentially due to their increased surface area and ability to release more ROS.
- 3.
Concentration 2, size 2 NPs, TiO2, ZnO, and MgO, showed effectiveness against B. subtilis and E. coli within 12 and 24 h. This indicates that moderate concentrations with smaller NPs can be effective against a range of bacteria.
- 4.
The highest concentration and lowest size NPs, CuNP and AgNP, were effective against B. subtilis, E. coli, and S. aureus within 24 h. This suggests that high concentrations of small NPs can be particularly potent against these bacteria.
- 5.
Concentration 3, size 2 NPs, ZnO and TiO2, showed effectiveness against S. aureus in 12 and 24 h.
- 6.
Concentration 3, size 3 NPs, CuO, AgNP, MgO, and ZnO, were effective against B. subtilis, E. coli, and Klebsiella pneumoniae in various durations.
- 7.
Concentration 3, size 5 NPs, CuO and AgNP, were effective against S. aureus in 12 and 24 h.
- 8.
Concentration 4, size 5 NPs, Ag2O, ZnO, and TiO2, were effective against S. aureus in 24 h.

Our findings, suggesting that the M/MO-NPs particularly Ag and TiO2 NPs might be an effective new class of nano-antibiotics for combating MDR bacteria, are in the line with reported literature [23–28]. In vitro experimental work of Liao et al. against clinical isolates of MDR P. aeruginosa demonstrated high bactericidal potency of AgNPs with minimum bactericidal concentration (MBC) in the range of 2.813–5.625 μg/mL [29]. Similarly, TiO2 NPs have shown strong antibacterial activity in in vitro analysis against E. coli and B. subtilis [30]. Data from the model indicated that physiochemical features such as dimensions and size, concentration, and the reaction time are crucial attributes for the optimum antibacterial efficacy of M/MO-NPs against targeted bacteria. Reports of many experimental results show that small-sized NPs are more reactive antimicrobial agents due to their large surface-to-volume ratio, which ensures increased interaction with the bacterial surface [31–36].
Results in Table 2 show that M/MO-NPs have excellent broad-spectrum antimicrobial potential and are capable of targeting both Gram-negative and Gram-positive bacteria. It is hypothesized that the negatively charged cell wall of both classes attracts the positively charged NPs, thus influencing their interaction. Our model indicates that Ag and CuO NPs are the most effective against Gram-negative MDR bacteria, particularly E. coli, K. pneumoniae, and P. aeruginosa, while Ag and TiO2 NPs are significantly bactericidal against Gram-positive bacteria, such as the highly resistant S. aureus. These results are supported by reported in vitro and in vivo studies [37–44]. Experimental findings by Al-Dhabi et al. showed excellent antimicrobial potential of AgNPs against P. aeruginosa (ZOI: 12 mm) and K. pneumoniae (ZOI: 10 mm), with moderate activity against S. aureus (ZOI: 9 mm) [45]. P. aeruginosa is a highly resistant microbe, so a 12-mm zone indicates the strong bactericidal potential of AgNPs. Another study by this group reported good efficacy of AgNPs against Gram-negative K. pneumoniae (ZOI: 17 mm) and S. aureus (ZOI: 29 mm) [46]. It is suggested that AgNPs attach to bacterial membranes, disrupt respiration and replication, and induce ROS production which damages key cellular components. Li et al. demonstrated that NPs have distinct photo-generated ROS kinetics. Though ROS have a very short half-life, that is, 10−9 to 10−3 s, they generate immense oxidative potential via radicals such as singlet oxygen (1O2), hydroxyl radicals (OH·), superoxide radicals (O−), and hydrogen peroxide (H2O2). An excess of these radicals is highly toxic and leads to bacterial cell death by altering vital organelles such as the membrane, electron transport chain, and DNA, together with metabolic pathways required for normal physiological and morphological functions (Figure 1) [47]. Additionally, the small size and high specific surface area of AgNPs enhance their binding and further increase toxicity [46]. TiO2 NPs exhibited profound antibiofilm activity experimentally with 31.25 μg/mL minimum inhibitory concentration (MIC) against P. aeruginosa. Furthermore, a dose-dependent bactericidal effect was observed, with the ZOI increasing to 14 mm at 150 μg/mL from 11 mm at 100 μg/mL, which highlights the enhanced antibacterial performance with higher NP concentrations [48]. The research group also studied ZnO and CuO NPs, with sizes ranging from 2 to 3, which effectively targeted both Gram-positive and Gram-negative MDR bacteria, aligning well with our in silico results [49, 50].
| Concentration | Size | Bacteria | Time | M/MO-NPs |
|---|---|---|---|---|
| 1 | 3 | Staphylococcus epidermidis | 24 h | AgNP |
| 1 | 3 | Streptococcus mutans | 24 h | AgNP |
| 1 | 5 | Streptococcus mutans | 24 h | ZnO |
| 1 | 5 | Staphylococcus aureus | 24 h | TiO2 |
| 1 | 5 | Klebsiella pneumoniae | 24 h | TiO2 |
| 1 | 5 | Escherichia coli | 24 h | TiO2 |
| 2 | 2 | Bacillus subtilis | 12 h | TiO2 |
| 2 | 2 | Escherichia coli | 12 h | TiO2 |
| 2 | 2 | Escherichia coli | 24 h | ZnO |
| 2 | 2 | Escherichia coli | 24 h | MgO |
| 2 | 3 | Escherichia coli | 24 h | CuO |
| 2 | 3 | Escherichia coli | 24 & 48 h | AgNP |
| 2 | 3 | Escherichia coli | 24 h | ZnO |
| 2 | 5 | Escherichia coli | 24 h | TiO2 |
| 2 | 5 | Staphylococcus aureus | 24 h | Ag2O, ZnO, TiO2 |
| 3 | 1 | Bacillus subtilis | 24 h | CuNP, AgNP |
| 3 | 1 | Escherichia coli | 24 h | CuNP, AgNP |
| 3 | 1 | Staphylococcus aureus | 24 h | CuNP, AgNP |
| 3 | 2 | Staphylococcus aureus | 12 & 24 h | ZnO |
| 3 | 2 | Staphylococcus aureus | 12 h | TiO2 |
| 3 | 3 | Bacillus subtilis | 24 h | CuO, AgNP, MgO |
| 3 | 3 | Escherichia coli | 24 h | CuO, AgNP, ZnO |
| 3 | 3 | Klebsiella pneumoniae | 12 h | CuO, AgNP |
| 3 | 3 | Klebsiella pneumoniae | 48 h | AgNP |
| 3 | 3 | Klebsiella pneumoniae | 12 & 24 h | ZnO |
| 3 | 3 | Pseudomonas aeruginosa | 24 h | CuO |
| 3 | 3 | Pseudomonas aeruginosa | 24 h | AgNP |
| 3 | 5 | Staphylococcus aureus | 12 & 24 h | CuO |
| 3 | 5 | Staphylococcus aureus | 24 h | AgNP |
Among all the MDR bacteria, E. coli was found to be the most susceptible microbe and was eradicated by the lowest dose of nearly all the NPs. Studies have shown that the bacterial cell wall of E. coli, a Gram-negative bacterium, is made up of a thin layer of lipopolysaccharide and a top peptidoglycan layer. It is suggested that this architecture allows the entrance of released metal ions into the cell, making it the most susceptible to NPs. On the contrary, the cell wall of Gram-positive bacteria such as S. aureus is thicker, consisting of a profuse layer of peptidoglycans. Thus, Gram-positive bacteria are more resistant to the attack of antibiotics. Gouyau et al. found no bactericidal activity of citrate-capped AgNPs on S. aureus but demonstrated a high dose-dependent antibacterial activity against E. coli, with a MIC of 128 μmol/L under same conditions [51].
As per our in silico results, AgNPs were found to be the most outstanding antibiotic among the selected M/MO-NPs in this study, showing strong bactericidal action against almost all the microbes. This comprehensive response of our model aligns with experimental reports demands extensive investigation of the antimicrobial potential of AgNPs against a large array of microbes [32, 52–55].
Some MO-NPs such as Al2O3, AgO, and CaO, at different sizes and dose ranges, do not elicit antimicrobial action. This finding highlights the importance of tailored approaches to save time and resources and to predict the most feasible M/MO-NP-based antibiotic with specific parameters.
4. Future Prospects
In the era of deep learning, machine learning has emerged as a powerful tool for the robust design of new drugs. This article presents a comprehensive approach to classifying a broad spectrum of metallic nanoparticles against MDR bacteria using optimized SVM classifiers. The step-by-step strategy of these classifiers, along with encoded and decoded data, has proven effective for analyzing the biocidal potential of M/MO-NPs against MDR bacteria. M/MO-NPs are extensively studied as a new class of nano-antibiotics to combat microbial drug resistance. Based on the obtained results, it can be concluded that Ag and CuO NPs are most effective against MDR strains of E. coli, P. aeruginosa, and K. pneumonia. It was found that their antimicrobial action is highest in the size range of 26–99 nm with 24-h exposition time. Ag and TiO2 NPs were found to be the most effective against Gram-positive microbes when they are exposed to pathogens for 24 h. AgNPs were found to be very effective against all types of microbes, and low dose such as 0.02–1.2 nM was adequate to elicit strong antibiotic action. The proposed system was found to be most proficient toward S. aureus, and the least response was obtained against S. mutans. The model overall demonstrated a significantly good accuracy of 89% with the actual figures. Based on these results, one can say that the strategic application of SVM classifiers enhanced with Bayesian optimization could be a useful tool for gauging the antimicrobial potential of NPs.
The integration of machine learning with NP research marks a transformative step in the field of smart materials, fostering innovation at the intersection of nanotechnology, adaptive materials, and intelligent systems. Future research could explore the development of smart antimicrobial materials that respond to specific stimuli, enhancing their effectiveness against MDR bacteria. This could involve the creation of composite materials that combine M/MO-NPs with shape-memory alloys, electroactive polymers, or magnetorheological materials to achieve targeted and adaptive antimicrobial responses. Investigations could also focus on the use of machine learning algorithms to optimize the design and application of 3D and 4D printed smart materials for antimicrobial applications. By leveraging physical intelligence and smart control systems, researchers can develop materials that dynamically adjust their properties in response to microbial threats, improving both efficacy and safety. Additionally, exploring the potential of smart biomaterials and bioinspired systems for medical devices can lead to innovative solutions for infection control in clinical settings.
Energy applications, such as smart grid technologies and energy harvesting materials, could benefit from incorporating antimicrobial smart materials to ensure longevity and functionality in diverse environments. The study of auxetic and metamaterials, particularly those with programmable and tunable properties, may also yield new insights into creating robust and versatile antimicrobial surfaces and coatings.
Overall, the integration of machine learning with the design and optimization of smart materials offers promising avenues for future research, particularly in developing advanced antimicrobial strategies to combat MDR bacteria. This approach aligns with the journal’s focus on innovative and multidisciplinary research in materials and structures, from nano- to macroscales.
Conflicts of Interest
The authors declare no conflicts of interest.
Author Contributions
All the authors equally contributed to the manuscript.
Funding
PSK was supported by an Australian Research Council Discovery Project (DP230100485). Open access publishing was facilitated by the University of Sydney, as part of the Wiley—The University of Sydney agreement via the Council of Australian University Librarians.
Acknowledgments
Statement of Usage of Artificial Intelligence. We have not used AI to generate the manuscript.
Appendix A
| Feature | Value | Code |
|---|---|---|
| Drug-resistant bacteria | Bacillus subtilis | T |
| Escherichia coli | U | |
| Klebsiella pneumoniae | V | |
| Pseudomonas aeruginosa | W | |
| Staphylococcus aureus | X | |
| Staphylococcus epidermidis | Y | |
| Streptococcus mutans | Z | |
| Method | Diffusion | 9 |
| CFU | 8 | |
| Others | 7 | |
| Dilution | 6 | |
| Time exposition (h) | 12 | a |
| 24 | b | |
| 48 | c | |
| Metallic nanoparticles | Ag | H |
| Ag2O | I | |
| Al2O3 | J | |
| Au | K | |
| CaO | L | |
| CuO | M | |
| Cu | N | |
| MgO | O | |
| TiO2 | P | |
| ZnO | Q | |
| Size of nanoparticles (nm) | 1–10 | 1 |
| 11–25 | 2 | |
| 26–99 | 3 | |
| 100–200 | 4 | |
| More than 200 | 5 | |
| Concentration of nanoparticles (mM) | 0.02–1.2 | i |
| 1.21–12.5 | ii | |
| 12.51–200 | iii | |
| Bacteria | Method | Time (h) | M/MO-NPs | Size of NPs (nm) | Conc. of NPs (mM) | Quasi-SMILES |
|---|---|---|---|---|---|---|
| B. subtilis | Diffusion | 24 | Ag | 3 | 45 | T9bH1iii |
| E. coli | Other | 12 | TiO2 | 20 | 125 | U7aP2v |
| K. pneumoniae | Other | 12 | CuO | 58 | 12.5 | V7aM3ii |
| S. aureus | Dilution | 24 | ZnO | 23 | 1.2 | X6bQ2ii |
| S. aureus | Diffusion | 48 | TiO2 | 150 | 0.5 | X9cP4i |
| E. coli | CFU | 48 | Ag2O | 35 | 0.2 | U8cI3i |
Open Research
Data Availability Statement
Data sources are provided in detail below: https://www.cdc.gov/drugresistance/biggest-threats; https://www.cdc.gov/antimicrobial-resistance/data-research/threats/?CDC_AAref_Val; https://www.who.int/europe/news/item/26-01-2022-who-ecdc-report-antimicrobial-resistance-re; https://gardp.org/.


