Elemental Composition Analysis of Air-Side Fouling of a Unitary Room Air Conditioning System Using FESEM With EDX
Abstract
With an emphasis on both indoor and outdoor settings, this study examines the elemental composition of fouling material collected from air conditioners in Cebu City, Philippines. Key elements were found using an energy-dispersive X-ray spectroscopy (EDX) study, including calcium (Ca), iron (Fe), potassium (K), silicon (Si), and aluminum (Al). Al (3.3 wt. %) and Si (7.3 wt. %) were more abundant in indoor samples, but Ca (6.9 wt. %) and Mg (4.9 wt. %) were more abundant in outdoor samples. Significant regional differences in K, Ca, and Fe concentrations were found by statistical analysis using ANOVA (p < 0.05), highlighting the impact of operational and environmental factors on fouling formation. The findings shed light on how local environmental factors affect the buildup of fouling material. Additionally, as part of the goal of this study, the elemental composition of dust determined serves as a basis for creating standard test dust for assessing prospect fouling-resistant coatings for heat exchangers of an air conditioning system. This work can contribute to AC maintenance optimization and advance coating technology, especially in tropical climates with high fouling issues.
1. Introduction
Air conditioners (ACs) are needed to give thermal comfort and a healthy indoor environment both in residential and commercial buildings as global temperature increases. However, during its operation, a phenomenon occurs that significantly affects its efficiency which is known as heat exchanger air-side fouling. Air-side fouling is the accumulation of undesired deposits on the external heat transfer surfaces [1]. To address this problem, several researchers conducted a study to characterize air-side fouling to develop air-side fouling mitigation strategies.
Kathleen Hess-Kosa defines environmental dust as fine particles of solid substance. It is composed of particles in the atmosphere that come from a variety of sources, including wind-lifted soil (aeolian process), volcanic eruptions, and pollutants. Dust in homes is made up of 20%–50% dead skin cells. The remainder, and in offices and other human spaces, is formed of small amounts of plant pollen, human hairs, animal fur, textile threads, paper fibers, minerals from outdoor soil, charred meteorite particles, and many other elements that may be found in the local environment [2].
Ahn and Lee conducted a study that involves different window-type ACs from three different locations, particularly, office, restaurant, and seaside inn in Pusan, South Korea. Using scanning electron microscope (SEM) imaging, the morphology of foulants inside the AC was revealed. Based on the SEM images, the evaporator foulants mainly contain particulates and fibers while in the condenser are only particulates without fibers. The author concluded that most of the particulates are created indoors and are primarily induced by dust from outside sources, such as skin flakes, tobacco dust, and combustion particles from a kitchen, while fibers can be easily produced from clothes, bedding, paper, pet fur, and hair. In addition, using energy-dispersive spectroscopy (EDX), the elemental composition of the fouling material was determined. Based on their EDX results, it was found that O, Al, Si, Ca, and Fe are the common elements found in the foulants inside AC in every location where the AC is installed. In general, certain elements can be found in one location but not in another. Like sulfur, it is not present in the office but present in the restaurant due to charcoal burning gases for meat roasting. And Na and Cl were identified in the condenser in the seaside inn but not in the office or restaurant due to the resolved salts in the seawater [3].
Another study that involved air-side fouling investigation is the study conducted by Ali and Ismail. Their study focuses on the evaporator unit of a window-type room AC which was installed in a university in Assiut, Egypt. The collected fouling specimens came from the front face and rear face of the evaporator of the AC. The author also used SEM with EDX to analyze fouling specimens. The chemical compositions of the nonorganic solid components in the fouling specimens were determined using EDX analysis, and the fouling specimens were imaged with a SEM. Based on the SEM images, the fouling specimen at the front face of the evaporator is a combination of fibers and dust particles in nonuniform distribution. Additionally, a visual inspection of the coil shows that the dust was uniformly distributed over the fins on the rear face, while fouling gradually reduced from the front face to the first tube row. The result of EDX performed by the author shows that the composition of the fouling specimen according to weight percent on the front face mainly contains Si, Ca, Fe, Al, S, Cu, P, Zn, K, Ti, and Mn while on the rear face Ca, S, Si, Fe, Al, K, Cu, Zn, Ti, P, and Mn [4].
Another study that investigates air-side fouling is the study conducted by Yuill and Hu Their study investigates the air-side fouling of split type—AC which is installed in two of the US regions, particularly, Omaha and Vegas. Although the author only uses SEM imaging without EDX, this study could be utilized to compare data from previous studies to the current study. Based on the SEM image of the fouling material, it can be described as a combination of fibers and particulates. The author discussed that the airborne particulate in the air seems to flow through the coil without adhering to its surface. But when fibers accumulate and bridge the fin gaps, the particulate debris does adhere to the fibers [5].
While current studies from other places provide a broad understanding of air-side fouling, they may not be immediately applicable to Cebu City, Philippines. Based on the conclusion from other researchers, it is probable that the fouling material not adequately represents other geographic regions, which may have different airborne fouling materials [5]. A local investigation is needed to reveal any distinctive fouling components or patterns relevant to the installation location. This recommendation by other studies can be supported by data on total suspended particles (TSPs) for a specific region. For example, in Region 7 in the Philippines where Cebu City belongs, the TSP annual value was around 94 μg/Ncm during 2015 [6]; in Pusan, South Korea, the TSP was around 15 μg/m3 in 2015 [7]; and in Omaha, USA, the TSP was around 9.5 μg/m3 in 2020 [8].
To mitigate air-side fouling, an air filter is utilized. However, high-efficiency filters typically have a higher pressure drop and are thought to incur significant energy costs [9]. The minimum efficiency reporting value (MERV) rating of an air filter indicates its effectiveness. Filters with higher MERV ratings can collect smaller particles, but the airflow is more limited. Because not all particles are caught, particularly with lower MERV filters, small particles might still reach the air conditioning system. Thus, a different method is required to address this issue.
The primary goal of this research is to identify the components of dust that penetrate and adhere to the external heat transfer surfaces of a window-type room AC that has been used in the University of San Carlos located in Cebu City, Philippines, using field emission scanning electron microscopy (FESEM) and EDX spectroscopy. SEM is a popular analytical technique for evaluating a specimen’s surface. An electron microscope has several advantages over a traditional optical microscope, including high magnification, significant depth of focus, outstanding resolution, and ease of sample preparation and observation [10]. This study is critical and a stepping stone toward designing foul-resistant heat exchangers by utilizing the identified foulant as feed dust in the dust injection system of the wind tunnel. The testbench design is used to investigate the performance of foulant-resistant coating and whether the dust will repel or adhere to AC’s heat transfer surfaces.
2. Materials and Methods
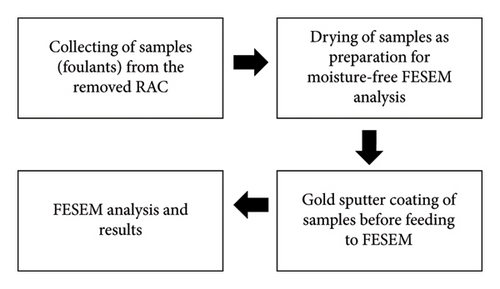
The process flow for determining the elemental composition of foulants that are deposited on the heat exchanger’s external surfaces is shown in Figure 1.
2.1. Sample Preparation
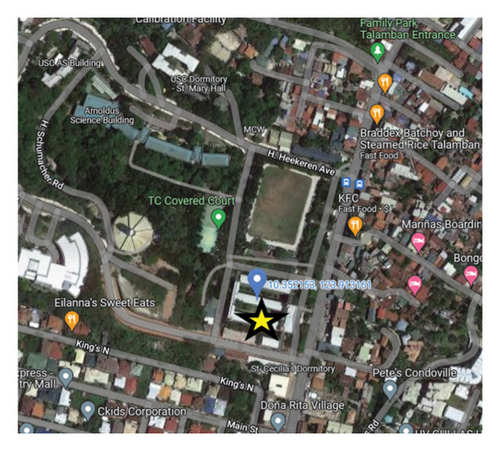
Figures 2 and 3 depict a thorough description of the site where the room–AC was installed, and the samples were collected. The RAC was installed in one of the offices of the Lawrence Bunzel Building at the University of San Carlos Technology Center in Cebu City, Philippines.
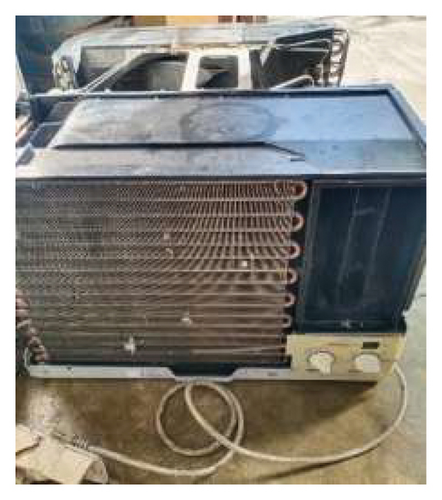
During the collection of the foulant samples, nitrile gloves which are lint-free were worn, and a new, clean, and soft toothbrush was used to scrape it from the external surface of cooling fins on both evaporator and condenser of the RAC which being contained in a sealable plastic container immediately to avoid contamination. Then, it was placed inside a borosilicate glass dish for drying and put inside the laboratory oven.
FESEM sample requirements must be followed as stated:
The sample should be no larger than 12.0 mm × 12.0 mm × 10 mm (height), with the side opposite the side of interest flat (to facilitate sample mounting). Smaller sample heights are preferred. Samples should be dry and able to withstand high vacuums after primary fixation and dehydration. To achieve the best results, the samples’ surfaces should be clean and free of impurities. Wet biological samples cannot be evaluated using FESEM since the equipment is moisture-free. Drying the sample is necessary because FESEM requires a moisture-free sample; otherwise, if significant moisture content is detected, the FESEM would stop working. The drying process takes place in the Mechanical Engineering Laboratory of the University of San Carlos Technology Center. The drying process was carried out using instruments such as a Thelco laboratory oven, crucible tong, glass crucible, and digital weighing scale, as seen in Figure 4.

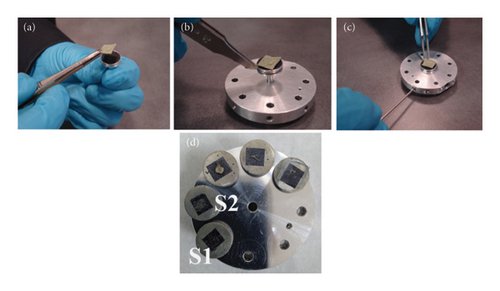
The dried samples were taken to the FESEM laboratory to be examined for elemental composition. Lint-free gloves were used for handling the specimen sample and the sample holder to prevent contamination from fingerprints. Figure 5 shows the procedures for preparing the sample for placement on the sample holder which was thoroughly discussed [11].
- 1.
Use carbon tape, sticky metal, or conductive carbon to attach the specimen to the stub. Ensure that the stub and the specimen region to be examined are properly in contact.
- 2.
The stub should be placed into the sample holder using tweezers.
- 3.
Assemble the stub correctly on the sample holder. To tighten the placement screw, use a 1.5-mm hexagonal key.
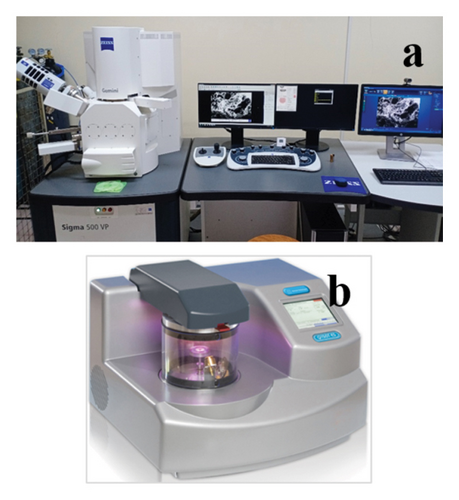
Samples of all types, including ceramics, metals and alloys, semiconductors, polymers, biological samples, and much more, can be imaged using FESEMs that can be seen in Figure 6(a). To obtain high-quality data, some sample types are more difficult to work with and call for an additional stage in the preparation process. This additional step is applying a thin layer of a conductive substance, such as gold, silver, platinum, or chromium, to your sample that is around 10 nm in thickness [12]. In this case, the samples were put into the sputter coater to be coated with a conductive material, gold (Au) that can be seen in Figure 6(b). For normal SEM applications, gold is a great and often utilized coating material to coat nonconductive materials. It coats very efficiently because of its low work function, and sample surface heating is minimal when thin layers and cool sputter coaters are used. With contemporary SEMs, the grain size is apparent at high magnifications. The foulant samples were coated with 8-nm gold to prevent surface charging using the arc deposition process. An excellent SEM image was obtained by using this method.
3. Results and Discussion
3.1. Image Analysis
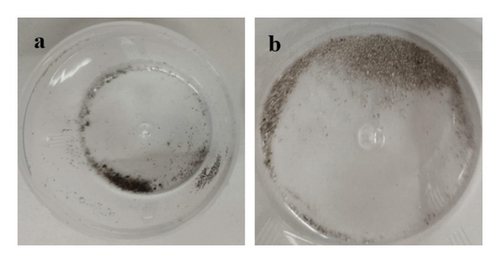
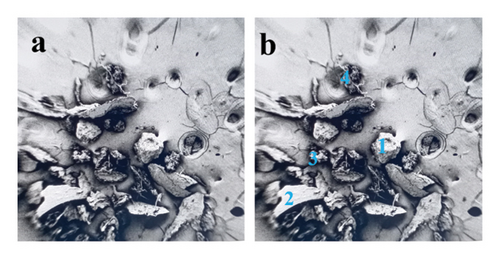
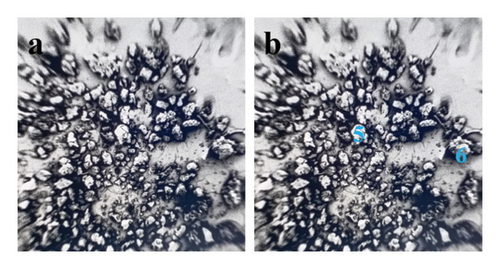
The samples were identified as specimens from the evaporator and condenser, designated S1 and S2, respectively. The sizes and textures of the grains vary among samples. Experimental microscopic images from the collected foulants on the air conditioning coils were given in this contribution. Figure 7 shows the 32-megapixel images from an Android smartphone. The condenser sample exhibits a blend of lustrous grayish-white and black shade, while the evaporator sample (S1) displays compact small grain and a black tint. The tiny black granules that resembled flakes and were detected in the S1 were similar to dried soot. Additionally, the grains in the S2 resembled dry silt, dirt, or sand. Figure 8 displays a thirty-fold magnified FESEM image for the purpose of choosing the spectra for analysis. As can be seen in Figure 9, the S2 samples appear to have tighter grain sizes and almost identical shapes, whereas the S1 samples were found to have inconsistent grain sizes and shapes in Figure 8.
Particulate pollution can impact items in existing buildings due to sources such as gas and oil heaters, workrooms, and air conditioning systems that are not properly maintained or equipped with filters [13].
3.2. Elemental Composition Analysis
This step involved the analysis of various spectra for various samples. The cost of the FESEM with EDX analysis limits the number of spectra that may be obtained for each sample. As seen in Figure 8(b) and Figure 9(b), distinct areas were focused on for each sample during the EDX measurement and labeled with numbers. These areas will be referred to as Electron Images 1, 2, 3, 4 for evaporator samples (S1), while Electron Images 5 and 6 for condenser samples. To easily visualize the FESEM images and its corresponding EDX results, the FESEM images are displayed and followed by its corresponding EDX result. These were arranged accordingly, which can be seen in Figures 10, 11, 12, 13, 14, 15, 16, 17, 18, 19, 20, and 21. Peaks on an EDX spectrum often correlate to energy levels for which the greatest number of X-rays have been received. Since each of these peaks is specific to an atom, they all relate to one element.
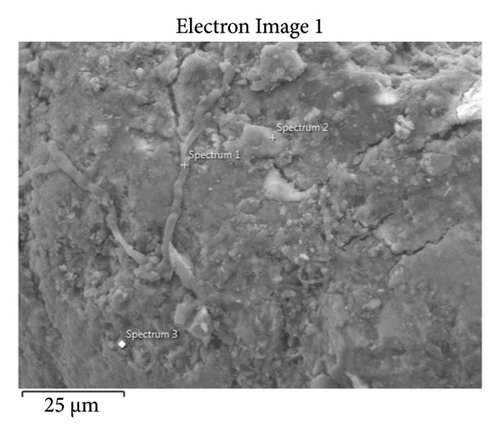
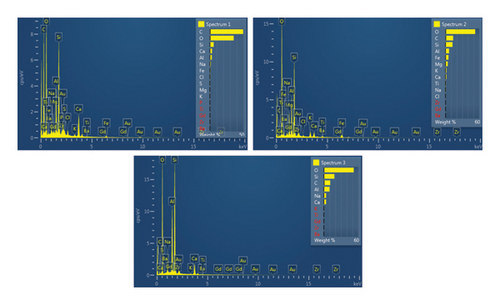
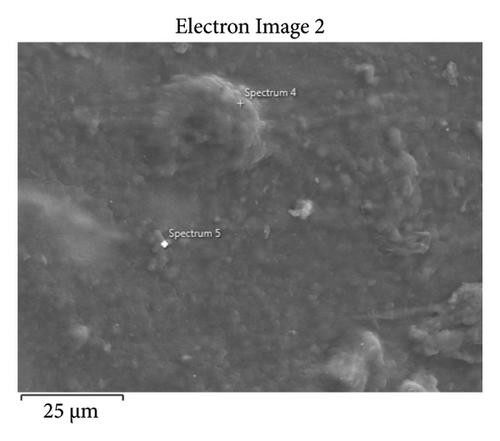
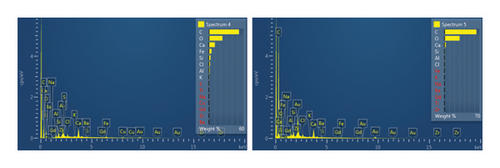
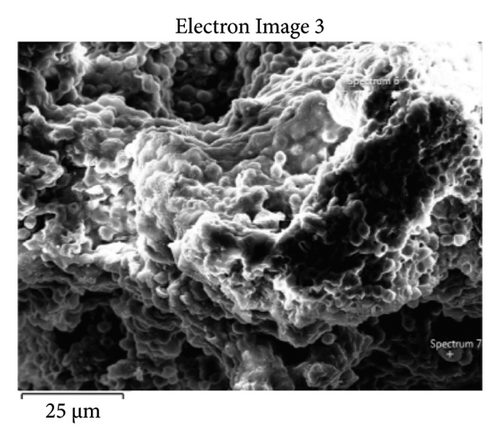
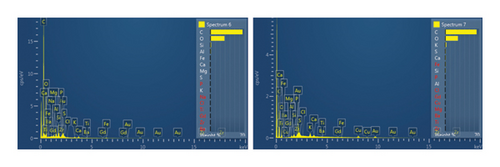
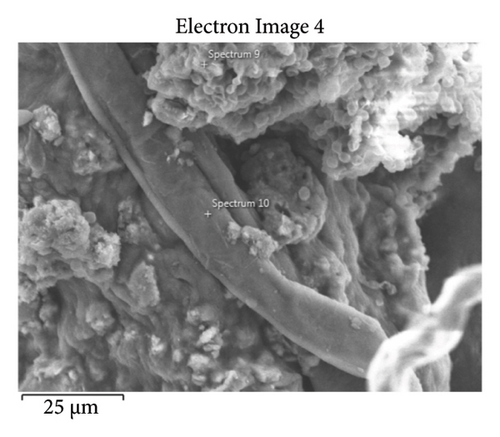
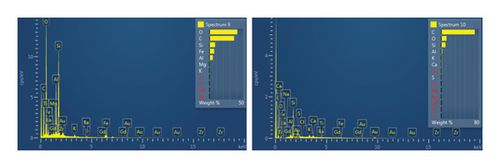
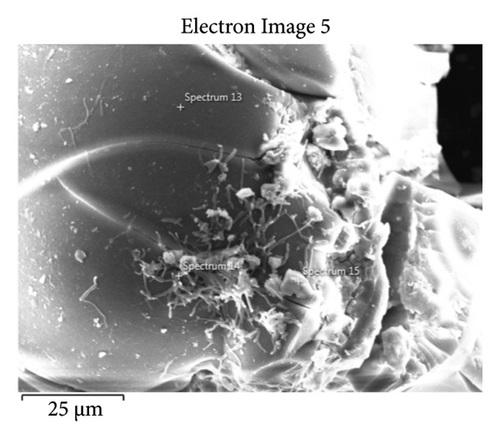
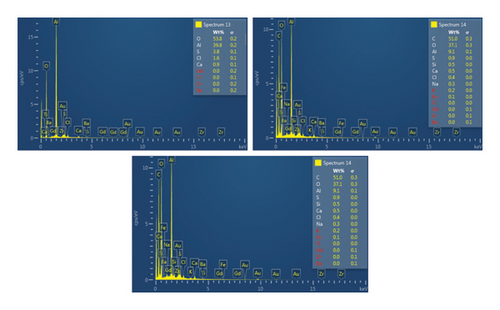
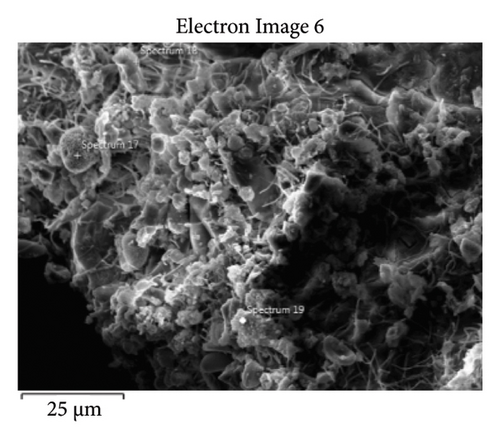
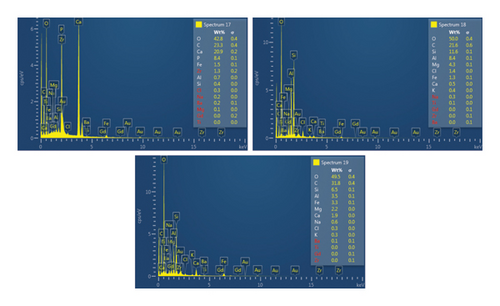
A spectrum’s highest peak indicates how concentrated an element is in the sample [14]. Elemental mapping, which is the process of obtaining more precise data on an element’s composition, suggests that a greater spectrum be used. Two FESEM analyses were performed: one for the samples from the evaporator (S1) and the other for the condenser (S2). The magnification was increased to 1000x to examine the topography of each sample with a distinct spectrum and identify the elements that are present.
Table 1 displays a summary of the EDX spectroscopy results for each spectrum of the concentrated area of evaporator samples from the electron images. A histogram of all the EDX spectroscopy data for each spectrum of the targeted area of the evaporator sample was created for simple result viewing which can be seen in Figure 22. Fergusson and Kim, claim that street dust and house dust are mostly composed of dirt, although certain elements are more abundant in one form than the other. These are Au, Cl, Br, Zn, Cu, Cd, As, Sb, Cr, Ca, Na, and Zn. Their origins can be traced back to several sources of pollution. House dust contains some elements that are created within the house, including Cu, Co, As, Sb, Zn, Cd, Au, C1, C, and Pb [15]. Nevertheless, Fergusson and Kim’s conclusions are contradicted by the EDX spectroscopy results of evaporator samples, which are similarly thought of as dust that is deposited onto the heat transfer surfaces of the evaporator coil and fins. The emission spectra, as depicted in Figure 22, mostly include C, O, Si, Ca, Al, and Fe with different weight percentages, along with minor quantities of Na, Cl, K, Mg, and S. In addition, it shows that the evaporator sample contains a high concentration of O and C which can be seen in Figure 23, in terms of average weight percentage per element. It can be suggested that SiO2 (silica) and CO (black carbon or soot) might be presented as the main compounds in the evaporator samples since Si and C have an average percentage of 7.3% and 47.8%, respectively. Since the sources of these substances can be found anywhere on Earth, they cannot be avoided. Over the course of millions of years, silicon dioxide crystallizes. Silicates (minerals containing silica) make up 30 percent of all minerals and geologists believe they may make up as much as 90 percent of the earth’s crust. Common silica-containing materials include limestone, coal, ore, cement, concrete, brick, mortar, stone, aggregate/rock, and soil. As a result, silica dust is prevalent everywhere and is easily carried by wind [16]. Additionally, some carbon is not entirely oxidized during incomplete combustion, which results in the production of soot and carbon monoxide (CO). Given the building’s proximity to the road and the sample collection location, there is a good chance that wind will carry these COs inside the offices and classrooms [17]. According to Hess-Kosa, the various dust sources in the area correlate to the various element’s compositions [2].
| Spectrum no. | Weight percentage (%) | ||||||||||
|---|---|---|---|---|---|---|---|---|---|---|---|
| C | O | Si | Ca | Al | Fe | Na | Cl | K | Mg | S | |
| Sp1 | 50.0 | 34.0 | 7.0 | 4.0 | 3.0 | 0.5 | 1.0 | 0.5 | — | — | — |
| Sp2 | 14.0 | 54.0 | 13.0 | 1.8 | 8.0 | 7.0 | 0.2 | 0.5 | — | — | — |
| Sp3 | 12.0 | 53.0 | 19.0 | 3.0 | 10.0 | — | 3.0 | — | — | — | — |
| Sp4 | 52.0 | 23.0 | 4.0 | 11.0 | 2.0 | 5.0 | — | 2.5 | 0.5 | — | — |
| Sp5 | 64.0 | 31.0 | 0.7 | 3.0 | 0.7 | — | — | 0.6 | — | — | — |
| Sp6 | 67.5 | 29.0 | 2.0 | 1.0 | 0.2 | — | 0.1 | — | 0.1 | 0.1 | — |
| Sp7 | 62.0 | 35.0 | 0.8 | 0.5 | 0.1 | — | — | — | — | — | 1.6 |
| Sp9 | 36.5 | 41.8 | 9.0 | — | 4.0 | 8.5 | — | — | 0.1 | — | — |
| Sp10 | 72.3 | 11.5 | 9.8 | 1.8 | 2.0 | — | — | 0.5 | 1.7 | — | — |
| Ave | 47.8 | 34.7 | 7.3 | 2.9 | 3.3 | 5.3 | 0.9 | 0.9 | 0.6 | 0.1 | 1.6 |
- Note: — means that the element is not detected during energy-dispersive spectroscopy (EDX).
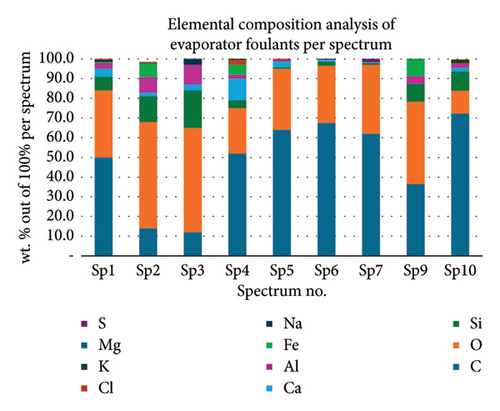
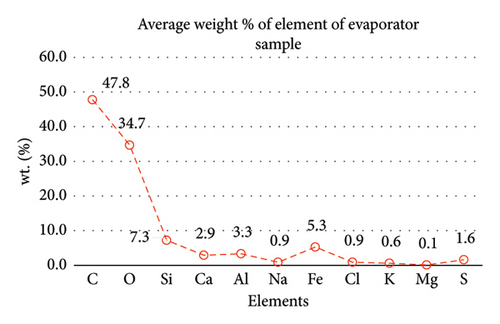
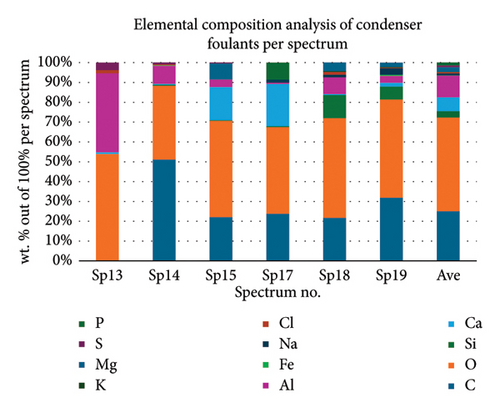
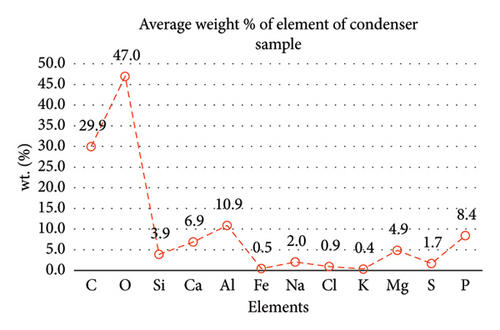
Table 2 presents a summary of the EDX spectroscopy data obtained from the electron images for each spectrum of the focused area of the condenser samples. Figure 24 shows a histogram of all the EDX spectroscopy data for each spectrum on the focused region in the condenser sample, which was created to make the results easier to observe. As can be seen in Figure 24, the emission spectra are mostly composed of different weight percentages of C, O, Si, Ca, Al, and Mg, with lesser amounts of Fe, Na, Cl, S, and P. Nevertheless, there is a significant concentration of O and C in the condenser sample. The amount of Al and Ca, at 10.9% and 6.9%, respectively, is greater than the quantity of Si, at 3.9% only, according to the average weight percentage per element displayed in Figure 25. It is possible that the primary constituents in the condenser samples are SiO2 (silica), CO (black carbon or soot), and CaO (calcium oxide or quicklime). Although it is present in many common minerals (such as calcite, aragonite, limestone, and marble), calcium oxide is not found in nature in a pure form. The EDX spectroscopy result confirms the presence of CaO as the cause of the lustrous grayish-white color seen in the image analysis of the condenser samples shown in Figure 7(b). The forms of calcium oxide include granular powder, white or grayish-white lumps, and odorless crystals [18]. According to the EDX spectroscopy data obtained from the evaporator and condenser samples, several components that differ in weight percentage were found in the condenser sample but not in the evaporator sample. The adhesion qualities of these foulants are impacted by environmental factors, particularly the surrounding temperature. The van der Waals, liquid bridge, and interface reaction of diffusive and electrostatic forces are the three subtypes of adhesive forces [19]. As per Berbner and Löffler as the particles get smaller, F/G increases if the particle weight grows with the third power of the diameter. Therefore, even though large particles often have a stronger absolute adhesive force, small particles adhere more firmly than large ones [19].
| Spectrum no | Weight percentage, % | |||||||||||
|---|---|---|---|---|---|---|---|---|---|---|---|---|
| C | O | Si | Ca | Al | Fe | Na | Cl | K | Mg | S | P | |
| Sp13 | — | 53.8 | — | 0.9 | 39.8 | — | — | 1.6 | — | — | 3.8 | — |
| Sp14 | 51.0 | 37.1 | 0.5 | 0.5 | 9.1 | 0.3 | — | 0.4 | — | — | 0.9 | — |
| Sp15 | 22.0 | 48.5 | 0.3 | 16.7 | 3.8 | — | — | — | — | 8.1 | 0.4 | — |
| Sp17 | 23.3 | 42.8 | 0.4 | 20.9 | 0.7 | — | 1.5 | — | — | — | — | 8.4 |
| Sp18 | 21.6 | 50.0 | 11.6 | 0.5 | 8.4 | — | 1.3 | 1.4 | 0.4 | 4.3 | — | — |
| Sp19 | 31.8 | 49.5 | 6.5 | 1.9 | 3.5 | 0.6 | 3.3 | 0.3 | 0.3 | 2.2 | — | — |
| Ave | 29.9 | 47.0 | 3.9 | 6.9 | 10.9 | 0.5 | 2.0 | 0.9 | 0.4 | 4.9 | 1.7 | 8.4 |
- Note: — means that the element is not detected during energy-dispersive spectroscopy (EDX).
3.3. Comparison of Results From Other Studies
The fouling materials obtained from ACs in Cebu City, Philippines, were examined using FESEM and EDX spectroscopy to determine their morphology and chemical composition. These findings are compared to those from similar research in Pusan, South Korea, conducted by Ahn and Lee [3] and Assiut, Egypt, by [4] to highlight differences caused by regional environmental conditions which can be seen in Table 3. The study focuses on differences in surface features, and elemental composition, offering insights into how climate, air quality, and installation conditions influence fouling characteristics. This work underscores the importance of region-specific assessments, as the environmental conditions in Cebu City have high humidity and pollution common in tropical metropolitan settings. The results may not be found in desert or subtropical regions.
| Elements | Installation location of air conditioning unit | |||||||
|---|---|---|---|---|---|---|---|---|
| Cebu City, Philippines | Pusan, South Korea | Assiut, Egypt | ||||||
| Indoor unit, wt. (%) | Outdoor unit, wt. (%) | Indoor unit (office), wt. (%) | Indoor unit (restaurant), wt. (%) | Indoor unit (seaside inn), wt. (%) | Outdoor unit (seaside inn), wt. (%) | Indoor unit (frontal face), wt. (%) | Indoor unit (rear face), wt. (%) | |
| O | 34.7 | 47.0 | 64.29 | 44.59 | 52.40 | 46.37 | — | — |
| Al | 3.3 | 10.9 | 10.58 | 11.67 | 11.11 | 19.25 | 9.79 | 6.00 |
| Si | 7.3 | 3.9 | 13.36 | 21.42 | 21.41 | 8.58 | 28.14 | 20.09 |
| K | 0.6 | 0.4 | 2.16 | 1.91 | 3.40 | 1.13 | 3.51 | 2.89 |
| S | 1.6 | 1.7 | — | 2.80 | — | 3.70 | 7.96 | 20.63 |
| Na | 0.9 | 2.0 | — | — | — | 2.97 | — | — |
| Cl | 0.9 | 0.9 | — | — | — | 1.83 | — | — |
| Ca | 2.9 | 6.9 | 3.05 | 4.06 | 1.50 | 3.90 | 18.74 | 33.46 |
| Fe | 5.3 | 0.5 | 6.56 | 13.54 | 10.14 | 6.55 | 18.25 | 11.02 |
| Zn | — | — | — | — | — | 5.72 | 3.65 | 1.62 |
| Mg | 0.1 | 4.9 | — | — | — | — | — | — |
| Ti | — | — | — | — | — | — | 0.90 | 1.06 |
| C | 47.8 | 29.9 | — | — | — | — | — | — |
| P | — | 8.4 | — | — | — | — | 4.21 | 0.34 |
| Mn | — | — | — | — | — | — | 0.11 | 0.34 |
| Cu | — | — | — | — | — | — | 4.75 | 2.56 |
| Total | 100 | 100 | 100 | 100 | 100 | 100 | 100 | 100 |
- Note: — means that the element is not detected during energy-dispersive spectroscopy (EDX).
While some elements, such as aluminum (Al), silicon (Si), potassium (K), calcium (Ca), and iron (Fe), are found in all three regions, others are unique to a specific location as can be seen in Table 3. For example, elements such as magnesium (Mg) and chlorine (Cl) were found in Cebu City, Philippines, but not in samples from Assiut, Egypt. Similarly, sulfur (S) was abundant in Pusan, South Korea, but was not consistently present in other areas. These findings show geographical variations in fouling material composition, which could be caused by variances in environmental conditions, industrial activity, or operational factors specific to each area where the samples are taken. In addition, throughout the year, the humidity of Cebu City, Pusan, and Assiut is 81% [20], 64% [21], and 38% [22], respectively, which shows that Cebu City has the highest humidity among the three regions. While this study did not include specific hygroscopicity measurement or compound identification, the observed changes in elemental composition indicate that humidity may have an impact on dust deposition and composition. As expected, Cebu City, which has the highest humidity, has a greater concentration of several elements with hygroscopic characteristics such as Cl and Na. Cebu City’s indoor samples had higher amounts of Cl (0.9%) and Na (0.9%), respectively, while the outdoor unit in Pusan located on the coast has higher Na and Cl concentrations than the outdoor unit in Cebu City, which is further inland. This is likely due to the influence of marine aerosols carried by onshore winds, which cause a larger deposition of sea salt Pusan outdoor unit. This finding is consistent with the knowledge that higher humidity might encourage water molecules to adhere to the surface of hygroscopic particles, potentially affecting their depositional behavior. For other hygroscopic elements including K and Ca, the trend is less clear. In comparison with Pusan and Assiut, Cebu City has lower K and Ca concentrations despite having higher humidity. This suggests that their abundance in the dust samples may be influenced by variables other than basic hygroscopicity, such as source variations, particle size distribution, and atmospheric transport. For instance, higher K and Ca concentrations in Assiut could be caused by agricultural activities, desert dust, or biomass burning, whereas industrial emissions and coal combustion might be the major sources of K in Pusan [23, 24].
The ANOVA results in Table 4 show significant regional variations in the concentrations of some elements. Iron (Fe), calcium (Ca), and potassium (K) showed statistically significant differences across the three regions (p < 0.05), suggesting that these elements are not uniformly distributed in the fouling material, while silicon (Si) and aluminum (Al) did not show significant differences (p > 0.05), suggesting a relatively consistent concentration of these elements regardless of location.
| Elements | Sum of squares (between) | Sum of squares (within) | df | Mean square (between) | Mean square (within) | F value | Sig. (p value) |
|---|---|---|---|---|---|---|---|
| Al | 62.69 | 84.29 | 2 | 31.34 | 16.86 | 1.86 | 0.249 |
| Si | 349.76 | 163.37 | 2 | 174.88 | 32.67 | 5.35 | 0.057 |
| K | 9.27 | 2.86 | 2 | 4.63 | 0.57 | 8.09 | 0.027 |
| Ca | 753.41 | 119.72 | 2 | 376.71 | 23.94 | 15.73 | 0.007 |
| Fe | 180.41 | 62.7 | 2 | 90.21 | 12.54 | 7.19 | 0.034 |
The relative consistency of silicon and aluminum concentrations throughout the multiple sites could be attributed to their widespread presence in the environment, stability, and possibly their interaction with larger, less mobile particles. Si and Al are major constituents of the Earth’s crust, and their compounds are abundant in soil and dust. These elements are naturally occurring in the environment and can be carried by wind, water, and human activities, resulting in extensive distribution [23]. Silicate and aluminosilicate minerals are also resistant to the weathering process, which means they are less prone to degrade or dissolve in the presence of water or air pollution. This enhances their stability and consistent presence in the surroundings [25]. Si and Al are frequently associated with larger dust particles which have reduced mobility in the environment. They settle out of the air more quickly, resulting in a more consistent distribution across different regions [26]. Of the elements analyzed, calcium had the highest F value (F = 15.73, p = 0.007), highlighting pronounced variability in its concentration between regions. This suggests that calcium deposition is especially sensitive to local environmental conditions or operation factors, such as air or water quality, or variations in the AC system’s exposure to external contaminants. Significant regional variations in an airborne particulate matter dust chemical composition, and operating parameters like temperature and humidity may all be connected to the notable variability seen for potassium (K) and iron (Fe). These findings highlight the significance of understanding site-specific circumstances to optimize maintenance techniques and fouling mitigation for AC systems.
The demand for ACs rises as the global temperature keeps on rising. According to a report presented by the International Energy Agency (IEA) that one of the primary drivers of global power demand will be the rising usage of ACs in homes and offices around the world, approximately 37% of energy goes to power AC units, highlighting the urgent need to improve cooling efficiency [27]. Additionally, fouling of ACU can reduce efficiency leading to an increase in energy demand and greenhouse gas emissions. The study supports the growth of sustainable solutions in different kinds of fields, including material science and engineering like what Raja et al. conducted. Raja et al. emphasized the development of palm-fiber boron carbide epoxy composites with improved mechanical and thermal stability [28]. Similarly, our research contributes to the development of sustainable solutions by giving insights into the compositions of ACU foulants, which can help future researchers develop more efficient and ecologically friendly AC systems like for instance developing a foulant-resistant coating on heat exchangers.
The concentration of several elements varied significantly among the three regions according to the Tukey HSD test shown in Table 5. The notable variation was seen in calcium (Ca), with values in Cebu City being much lower than those in Assiut (mean difference = −27.93, p < 0.05) and Pusan (−22.31, p < 0.05), indicating significant regional environmental differences. Cebu City had considerably higher potassium (K) concentrations than Assiut (mean difference = 1.63, p < 0.05), whereas Assiut had significantly higher iron (Fe) concentrations than Cebu City (−9.05, p < 0.05).
| Elements | Pairs | Mean difference | Sig. (p value) |
|---|---|---|---|
| Al | Cebu City versus Pusan | −5.9 | 0.307 |
| Cebu City versus Assiut | −0.64 | 0.987 | |
| Pusan versus Cebu City | 5.9 | 0.307 | |
| Pusan versus Assiut | 5.26 | 0.375 | |
| Assiut versus Cebu City | 0.64 | 0.987 | |
| Assiut versus Pusan | −526 | 0.375 | |
| Si | Cebu City versus Pusan | −10.68 | 0.173 |
| Cebu City versus Assiut | −18.6 | 0.05 | |
| Pusan versus Cebu City | 10.68 | 0.173 | |
| Pusan versus Assiut | −7.92 | 0.328 | |
| Assiut versus Cebu City | 18.6 | 0.05 | |
| Assiut versus Pusan | 7.9 | 0.328 | |
| K | Cebu City versus Pusan | −1.93 | 0.07 |
| Cebu City versus Assiut | −2.98 | 0.025 | |
| Pusan versus Cebu City | 1.96 | 0.07 | |
| Pusan versus Assiut | −1.05 | 0.327 | |
| Assiut versus Cebu City | 2.98 | 0.025 | |
| Assiut versus Pusan | 1.05 | 0.327 | |
| Ca | Cebu City versus Pusan | 1.9 | 0.898 |
| Cebu City versus Assiut | −21.08 | 0.017 | |
| Pusan versus Cebu City | −1.9 | 0.898 | |
| Pusan versus Assiut | −22.97 | 0.007 | |
| Assiut versus Cebu City | 21.08 | 0.017 | |
| Assiut versus Pusan | 22.97 | 0.007 | |
| Fe | Cebu City versus Pusan | −7.88 | 0.107 |
| Cebu City versus Assiut | −13.32 | 0.03 | |
| Pusan versus Cebu City | 7.88 | 0.107 | |
| Pusan versus Assiut | −5.44 | 0.269 | |
| Assiut versus Cebu City | 13.32 | 0.03 | |
| Assiut versus Pusan | 5.44 | 0.269 | |
4. Conclusion
The elemental composition of fouling materials taken from ACs in Cebu City, Pusan, and Assiut varied by installation location according to the study. Significant regional variations were observed for essential elements like potassium (K), calcium (Ca), and iron (Fe), indicating that operational and environmental conditions have a major impact on their deposition. Elements such as silicon (Si) and aluminum (Al), on the other hand, showed more consistent concentrations, suggesting less variation throughout the regions. These results emphasize the significance of local environmental factors in fouling composition and the necessity of taking regional factors into account when developing coatings for heat exchangers that are resistant to fouling. Furthermore, standard test dusts for assessing prospect fouling-resistant technology in an air conditioning system can be developed using the indicated composition as basis.
Conflicts of Interest
The authors declare no conflicts of interest.
Funding
This work was supported by the Engineering Research and Development for Technology Scholarship by the Department of Science and Technology under the Line-Item Budget-Research Dissemination Grant. This effort is receiving significant support from the University of San Carlos′ Department of Mechanical and Manufacturing Engineering.
Acknowledgments
This effort is receiving significant support from the University of San Carlos’ Department of Mechanical and Manufacturing Engineering. By granting permission to utilize any laboratory instruments and equipment required to finish this work, the author would want to express gratitude to a person who chooses to remain anonymous for their support.
The use of a free version of Grammarly, accessible at https://www.grammarly.com/paraphrasing-tool?msockid%3d;06e2c99b384f668a0c63c67a39d26757, is acknowledged by the author as the writing assistant to rephrase and refine sentences in order to improve the clarity and technical proficiency of this manuscript, especially in the introduction, findings discussion, and conclusion.
Open Research
Data Availability Statement
The article includes both quantitative and qualitative data used to support the findings of this study.


