Nano-Boosted Oils: A New Frontline Against Biofilm Resistance
Abstract
Staphylococcus aureus biofilms are particularly challenging to eradicate due to their protective niche, which increases bacterial resistance. This has encouraged the scientific community to explore new perspectives of control. Polymeric nanotechnology and the use of natural compounds have been emerging as promising tools for treating antimicrobial resistance and preventing biofilms because the nanosize permits the disruption of biofilms, reducing the dose and decreasing the biomolecules’ limitations such as high volatility and low solubility, enhancing their antimicrobial properties. Our research developed nineteen unique formulations, each loaded with a specific Mexican natural compound with antibacterial and antioxidant properties: rosemary essential oil, p-cymene, oregano essential oil, and carvacrol, all encapsulated within poly(lactic-co-glycolic acid) nanoparticles (NPs) and coated with mannitol. The nanosystems were characterized by physicochemical techniques showing an evident spherical morphology and an average size of around 200 nm, enhancing the oils’ stability within the polymeric matrix. Notably, the interaction of phytochemicals, unloaded and loaded NPs with MRSA (in sessile form and mature biofilm conformation), and fibroblast cells was analyzed. The antimicrobial activity of the natural molecules against MRSA was significantly enhanced up to 20 times higher when encapsulated in the nanosystems, with minimum inhibitory concentrations (MICs) observed as low as 0.443 mg/mL for carvacrol-loaded NPs. A synergistic effect was observed between the materials and the encapsulated natural compounds, resulting in potent antimicrobial properties and reduced bacterial growth and biofilm integrity (biofilm disruption > 50% for the better formulations). The cytotoxicity toward fibroblasts was reduced from 60% to 10% with the formulations showing safe profiles. This is the first study evaluating the effect of these NPs and the mannitol coating on mature MRSA biofilms, demonstrating promising results. Although simple in their approach, the novel nanomaterials proposed here represent multifunctional and comprehensive advancements in enhancing therapeutic efficacy and addressing the global challenge of resistant microorganisms.
1. Introduction
Nosocomial infections and microbial colonization on medical materials represent pressing challenges in contemporary medicine [1]. These concerns stem from the remarkable adhesive properties of bacteria on diverse surfaces and on their rapid reproductive rates and adaptation to various antibacterial agents [2, 3]. Compounding this issue is the capacity of pathogens to organize themselves into biofilms, intricate architectures that render them remarkably resilient—up to 1000 times more resistant to bactericidal agents [4]. Biofilms, constructed from a self-generated extracellular matrix rich in polysaccharides, proteins, lipids, and nucleic acids, facilitate microbial adhesion, impede the efficacy of antimicrobial drugs, and provide an ideal environment for evolution and adaptation [3, 5, 6].
Among the pathogens of concern, Staphylococcus aureus stands out due to its notorious ability to form robust biofilms on both biotic and abiotic surfaces [7]. This characteristic makes it a formidable adversary in clinical settings, contributing significantly to the persistence and recurrence of infections [8]. S. aureus biofilms are particularly challenging to eradicate because they provide a protective niche for bacterial cells, enhancing their resistance to immune responses and antimicrobial treatments [9]. The ability of this pathogen to cause a range of conditions, from minor skin infections to life-threatening diseases such as endocarditis and sepsis, underscores the urgency of developing effective strategies to combat its biofilm-related infections [10, 11].
Addressing the escalating challenge of antimicrobial resistance, researchers currently delve into new bactericidal molecules and novel materials to impede biofilm formation [12, 13]. Despite significant advances [14, 15], limitations arise as not all surfaces can be effectively coated, and patients may harbor biofilm infections upon hospital arrival. Seeking alternative solutions, a return to traditional medicine has spotlighted the potent antimicrobial properties of natural oils [16, 17]. In this context, it is reported that rosemary (Rosmarinus officinalis L.) oil presents antimicrobial activity, causing lysis by disrupting cell membranes due to terpenes, such as p-cymene (CY) [18], in its composition [19, 20]. On the other hand, oregano (Lippia graveolens Kunth) oil is rich in polyphenols, like carvacrol (CV), which is related to the oil’s antibacterial properties [21]. CV generates alterations in the cell membrane, disrupting nucleic acid synthesis and functionality and interfering with quorum sensing to prevent biofilm spread and disposition [22].
Nonetheless, in practice, natural oils are difficult to apply due to their degradation at ambient conditions, as they decompose due to light exposure, room temperature, and oxygen. These instabilities, along with their known allergenic potential, hinder the direct application of natural oils for treating bacterial infections [23, 24].
This study introduces a novel approach to overcome the limitations of using essential oils in treating bacterial infections by encapsulating phytochemicals from rosemary oil and oregano oil within poly(lactic-co-glycolic acid) (PLGA) nanoparticles (NPs). PLGA, widely recognized for its role in drug delivery, provides a highly functionalized platform capable of producing NPs approximately 200 nm in size, which is optimal for antimicrobial applications. This encapsulation process serves as a protective shield, enhancing the pharmacological activity of the natural oils and significantly reducing cytotoxicity.
This research uniquely evaluates the bactericidal effects of these encapsulated oils against methicillin-resistant Staphylococcus aureus (MRSA) biofilms, correlating their antimicrobial efficacy with their distinct chemical compositions. Our findings include the observation of minimum inhibitory concentrations (MICs) for loaded NPs, demonstrating the potent antimicrobial potential of these formulations. The study paves the way for the clinical development of novel, effective treatments for biofilm-related infections, addressing a critical gap in current medical therapies and providing a promising solution to the growing issue of antimicrobial resistance.
2. Materials and Methods
2.1. Materials
PLGA (50%-50%) terminal acid, poly(vinyl alcohol) (PVA), mannitol, Mueller–Hinton culture medium, methanol, CV, CY, crystal violet, and 2,2-diphenyl-1-picrylhydrazyl were obtained from Merck (USA). Ethyl alcohol and acetone, both of technical grade and exceeding 99% purity, were supplied by Química Barsa SA de CV (Mexico). Bacteriological preparations were fixed using sodium cacodylate and formaldehyde sourced from Merck (USA). The oregano and rosemary essential oils (RMEO and OEO) were acquired from Arenas, an authorized distributor certified by the Mexican Ministry of Agriculture and Rural Development (SAGARPA), ensuring the procurement of products meeting stringent quality standards.
2.2. NP Synthesis
Polymeric NPs were synthesized adapting the methodology reported by Caballero-Florán [25], by preparing an organic phase with a concentration of 16 mgmL−1 of PLGA in acetone, followed by a controlled drip at a rate of 0.33 mLmin−1 into a 3% w/v aqueous solution of PVA, maintaining constant agitation at 1300 rpm. For the encapsulation of essential oils from rosemary and oregano, along with CV and CY, the same procedure was employed, incorporating varying proportions of these active principles (17%, 50%, and 100% w/w relative to PLGA) into the organic phase. Acetone was removed through overnight magnetic stirring at 200 rpm, followed by purification by washing with distilled water and centrifugation (8000 rpm, 40 min). Once purified, the NPs were resuspended in 1 mL of water and subjected to lyophilization (−49°C, 0.07 mBar, Labconco) with different proportions of mannitol (0%, 5%, and 10% w/v) for preservation. Table 1 illustrates the design of experiments for obtaining the NPs.
Phytochemical ∗ % w/w relative to PLGA |
Mannitol % w/v relative to NPs |
|---|---|
| 17 | 0 |
| 5 | |
| 10 | |
| 50 | 0 |
| 5 | |
| 10 | |
| 100 | 0 |
| 5 | |
| 10 | |
- ∗OEO, RMEO, carvacrol, and p-cymene.
2.3. Size, z-Potential, and Morphological Characterization
The size and polydispersity index (PDI) of the NPs were determined through dynamic light scattering (DLS), and the z-potential was measured using electrophoretic light scattering, both conducted on a Zetasizer Nano ZS 90 instrument (Malvern, UK). These measurements were performed on fresh samples, as well as on samples stored in a lyophilized form at 25°C for three and six months, to assess the stability of the NPs over time. Scanning electron microscopy (SEM) studies were conducted using a JSM-7600F Schottky Field Emission Scanning Electron Microscope (Jeol, USA) operating at 5 kV. Samples of NPs were deposited on pin stubs of aluminum and sputter coated with a thin layer of gold.
2.4. Physicochemical Characterization
Fourier transform infrared spectroscopy (FTIR) spectra were acquired on a Perkin-Elmer (USA) ATR-FTIR Spectrum Two IR spectrophotometer. Calorimetric data were obtained by DSC with a DSC 2910 (Modulated TA Instruments, New Castle, DE, USA) equipped with a refrigeration cooling system (RCS) operating from 0°C to 300°C. Experiments were conducted under a flow of dry nitrogen with a sample weight of approximately 5 mg and calibration was performed with indium. Heating and cooling runs were performed at 10°C/min, respectively. Thermal degradation was studied at a heating rate of 20°C min−1 in a Hi-Res TGA 2950 Thermogravimeter Analyzer (TA Instruments, USA) of TA Instruments with ranged test temperatures from 0°C to 300°C.
2.5. Radical Scavenging Studies
2.6. Antimicrobial Activity
Staphylococcus aureus bacteria strain (MRSA-ATCC 25923, USA) was selected to evaluate the antimicrobial effect of RMEO, OEO, CV, CY, and loaded NPs. The strain was previously grown aerobically to exponential phase in Mueller–Hinton broth culture. Growth experiments were performed in sterile 96-well dishes. 100 μL of different concentrations of RMEO, OEO, CV, and CY-loaded NPs prepared in culture medium was added to each well. Then, 100 μL of broth of bacteria with turbidity equivalent to 0.5 McFarland standard (1 × 10⁸ colony-forming units per mL) was seeded into the wells. Cultures were incubated at 37°C, and after 24 and 48 h, absorbance was measured at 620 nm in a microplate reader (Agilent, EPOCHH-SN, USA). Turbidity was directly related to bacterial growth. All assays were conducted in three replicates and the values were averaged. Bacterial growth was quantified relative to the positive control, which consisted of a healthy, untreated bacterial culture. This approach ensures that all results are normalized against the baseline growth of the bacteria under standard conditions, allowing for a clear comparison of the effects of the treatments applied.
2.7. Antibiofilm Activity
The MRSA-ATCC 25923 strain of Staphylococcus aureus was selected as a model organism to assess the antimicrobial efficacy of both phytochemicals and NPs. This strain exhibits virulence factors such as methicillin resistance, coagulase positivity, and expression of adhesins and hemolysins, rendering it an ideal candidate for evaluating formulations developed as alternatives to conventional antibiotics in combating multidrug-resistant bacteria.
S. aureus was previously grown aerobically to exponential phase in Mueller–Hinton broth culture. Growth experiments were performed in sterile 96-well-treated dishes. 100 μL of broth of bacteria with turbidity equivalent to 0.5 McFarland standard (1 × 10⁵ colony-forming units per mL) was seeded into the wells. Cultures were incubated at 37°C for 24 h to ensure the biofilm attachment.
Following a 24-hour incubation period, the bacterial cultures were washed twice with phosphate-buffered saline (PBS) (pH = 7.2). Subsequently, 100 mL of varying doses of RMEO, OEO, CV, CY, and their respective NPs, along with 100 mL of Mueller–Hinton culture medium, was added. The cultures were then incubated for 24 and 48 h to assess their biofilm disruption capacity. The results are presented relative to the positive controls, which consist of healthy cultures grown under identical conditions without any treatment. To ensure consistency, the control biofilms were also subjected to washing every 24 h, matching the experimental protocol used for the other treatment groups. This approach allows for a fair comparison of biofilm disruption across all conditions.
After the designated incubation periods, the cultures underwent two washes with PBS and were fixed with 200 μL of methanol for 5 min. Following methanol removal, the cultures were allowed to air dry. Subsequently, 200 μL of a 0.1 M ethanolic solution of crystal violet was added, staining for 3 h. After dye removal, the plates underwent three washes with PBS to eliminate excess dye and pure ethanol was added to release the crystal violet. The bacteria and relative biomass in the cultures were quantified by measuring absorbance at 600 and 550 nm. All assays were conducted in quadruplicate, and the results were averaged for accuracy and reliability.
To assess the impact of biofilm disruption, observations were conducted under an optical microscope (Iroscope SI-PH).
2.8. Cell Viability
Cells like fibroblast were cultured in Dulbecco’s Modified Eagle’s Medium (DMEM) supplemented with 10% fetal bovine serum and 1% penicillin/streptomycin at 37°C in a humidified atmosphere with 5% CO2 and 95% air [26]. The culture medium was changed every two days, and, for subculture, cell monolayers were rinsed with PBS and detached by incubation with trypsin EDTA (0.25%) at 37°C for 2–5 min. Cell concentration was determined by counting the number of cells with a Neubauer chamber and employing 4% trypan blue as a vital dye. Detached cells with viability > 95% were used for cell culture assays. To determine the cytotoxic concentration (LD50) of phytochemicals and the NPs, the viability and cell death (mortality) were determined from different concentrations of the samples prepared by dilution in culture medium. The cytotoxicity was determined from 200 μL aliquots containing 104 cells seeded in each well in a 96-well culture plate and cultured for 24 h to allow cell attachment to the plate. Afterward, the medium was aspired and new samples were prepared in half dilution by adding fresh culture medium. Cellular viability was evaluated after another 24 h of incubation and determined by the MTT assay (3-(4,5-dimethylthiazol-2-yl)-2,5-diphenyltetrazolium; 5 mgmL−1). The relative viability was calculated for each sample as the percentage quotient between the viability of the sample and the control (medium without sample). Cytotoxicity was evaluated using five replicates, and the results were averaged and graphically represented.
3. Results
3.1. Size, z-Potential, and Morphology Analysis
The formulations were obtained as was mentioned in the methodology, and the nanoprecipitation process employed three mass/mass ratios between the phytochemicals and the PLGA biopolymer. Each system was supplemented with mannitol as a cryoprotectant before lyophilization to ensure stability during freezing and dehydration.
Furthermore, all size formulations, z-potential, and PDI were determined. The NPs demonstrated a PDI of less than 0.2, and z-potential values consistently fall below −10 mV (Table 2). Post-lyophilization, the NPs were stored at room temperature and shielded from light. After three and six months, their resuspension in an aqueous medium was tested, revealing an effortless process without the formation of NP clusters. Subsequent measurements of size, PDI, and z-potential reiterated the preserved properties, suggesting prolonged shelf life (Table 2).
| Sample | Sample ∗ | Mannitol (%) | Freshly made | Three months later | Six months later | ||||||
|---|---|---|---|---|---|---|---|---|---|---|---|
| Size (nm) | PDI | z-Potential (mV) | Size (nm) | PDI | z-Potential (mV) | Size (nm) | PDI | z-Potential (mV) | |||
| PLGA | PLGAa | 0 | 194.7 ± 1.2 | 0.047 ± 0.01 | −13.3 ± 1.1 | 205.1 ± 2.0 | 0.087 ± 0.02 | −10.3 ± 1.1 | 212.65 ± 2.79 | 0.05 ± 0.01 | −15.23 ± 1.03 |
| PLGAb | 5 | 208.5 ± 1.3 | 0.15 ± 0.02 | −5.29 ± 0.5 | 199.5 ± 3.6 | 0.12 ± 0.02 | −7.29 ± 0.2 | 204.51 ± 1.23 | 0.16 ± 0.03 | −8.12 ± 1.23 | |
| PLGAc | 10 | 209.6 ± 1.0 | 0.08 ± 0.03 | −6.5 ± 0.3 | 198.2 ± 1.0 | 0.16 ± 0.03 | −8.6 ± 0.4 | 223.49 ± 2.31 | 0.20 ± 0.05 | −8.40 ± 2.30 | |
| PLGA, 17% REO | REO17a | 0 | 183.7 ± 0.8 | 0.075 ± 0.02 | −13.4 ± 0.83 | 204.7 ± 0.8 | 0.23 ± 0.09 | −10.4 ± 1.63 | 201.9 ± 1.84 | 0.05 ± 0.06 | −8.93 ± 0.71 |
| REO17b | 5 | 210.6 ± 2.3 | 0.12 ± 0.02 | −13.0 ± 0.35 | 202.3 ± 4.3 | 0.20 ± 0.002 | −10.0 ± 0.42 | 203.01 ± 2.36 | 0.23 ± 0.06 | −12.56 ± 0.89 | |
| REO17c | 10 | 205.3 ± 1.3 | 0.09 ± 0.04 | −12.8 ± 0.59 | 198.3 ± 3.2 | 0.16 ± 0.04 | −9.8 ± 0.59 | 185.16 ± 3.26 | 0.24 ± 0.02 | −11.56 ± 2.45 | |
| PLGA, 50% REO | REO50a | 0 | 185.6 ± 1.4 | 0.096 ± 0.01 | −14.8 ± 0.9 | 193.6 ± 4.1 | 0.29 ± 0.01 | −8.8 ± 0.3 | 192.16 ± 0.03 | 0.06 ± 0.03 | −10.74 ± 0.84 |
| REO50b | 5 | 295.6 ± 3.6 | 0.12 ± 0.07 | −7.91 ± 1.1 | 276.3 ± 2.56 | 0.15 ± 0.2 | −7.51 ± 2.3 | 305.59 ± 5.26 | 0.15 ± 0.06 | −7.26 ± 0.16 | |
| REO50c | 10 | 193.4 ± 2.5 | 0.15 ± 0.08 | −9.26 ± 0.41 | 189.1 ± 1.6 | 0.2 ± 0.08 | −10.16 ± 0.26 | 193.65 ± 2.36 | 0.23 ± 0.16 | −12.56 ± 2.31 | |
| PLGA, 100% REO | REO100a | 0 | 186.5 ± 0.33 | 0.086 ± 0.03 | −10.4 ± 0.36 | 206 ± 0.36 | 0.36 ± 0.03 | −8.4 ± 0.23 | 265.5 ± 0.03 | 0.14 ± 0.03 | −14.5 ± 2.69 |
| REO100b | 5 | 213.1 ± 2.3 | 0.17 ± 0.02 | −13.2 ± 1.2 | 222.0 ± 3.6 | 0.24 ± 0.01 | −12.1 ± 1.6 | 241.25 ± 3.21 | 0.16 ± 0.01 | −16.45 ± 1.78 | |
| REO100c | 10 | 213.6 ± 1.2 | 0.174 ± 0.03 | −10.6 ± 0.64 | 206.4 ± 1.2 | 0.21 ± 0.03 | −9.6 ± 0.64 | 235.98 ± 2.36 | 0.31 ± 0.12 | −11.48 ± 1.25 | |
| PLGA, 17% OEO | OEO17a | 0 | 188.1 ± 0.56 | 0.027 + 0.06 | −18.7 ± 0.88 | 180.6 ± 0.89 | 0.04 + 0.02 | −22.5 ± 0.56 | 206.33 ± 0.02 | 0.15 ± 0.02 | −11.8 ± 0.28 |
| OEO17b | 5 | 208 ± 1.36 | 0.18 ± 0.04 | −10.6 ± 0.79 | 203 ± 2.61 | 0.21 ± 0.05 | −11.4 ± 0.12 | 206.89 ± 0.23 | 0.14 ± 0.06 | −12.0 ± 0.66 | |
| OEO17c | 10 | 205.4 ± 2.36 | 0.2 ± 0.02 | −8.56 ± 0.23 | 217.3 ± 2.89 | 0.18 ± 0.03 | −7.88 ± 0.16 | 209.59 ± 0.47 | 0.17 ± 0.04 | −9.26 ± 0.14 | |
| PLGA, 50% OEO | OEO50a | 0 | 178.6 ± 0.16 | 0.03 ± 0.001 | −14.1 ± 0.13 | 181.3 ± 0.14 | 0.07 ± 0.02 | −11.6 ± 0.18 | 180.0 ± 3.40 | 0.06 ± 0.03 | −21.76 ± 0.40 |
| OEO50b | 5 | 196.2 ± 1.26 | 0.15 ± 0.02 | −10.6 ± 0.59 | 209.6 ± 2.61 | 0.19 ± 0.04 | −9.5 ± 0.15 | 200.56 ± 2.18 | 0.12 ± 0.04 | −10.2 ± 1.20 | |
| OEO50c | 10 | 205.46 ± 2.3 | 0.23 ± 0.05 | −8.59 ± 0.23 | 201.16 ± 3.9 | 0.26 ± 0.01 | −8.12 ± 0.45 | 204.58 ± 3.26 | 0.14 ± 0.04 | −8.56 ± 0.79 | |
| PLGA, 100% OEO | OEO100a | 0 | 185.9 ± 2.3 | 0.138 ± 0.02 | −15.5 ± 0.69 | 192.3 ± 0.37 | 0.21 ± 0.03 | −20.36 ± 0.87 | 172.83 ± 2.6 | 0.12 ± 0.02 | −29.63 ± 1.68 |
| OEO100b | 5 | 206.56 ± 4.36 | 0.15 ± 0.05 | −13.1 ± 0.89 | 200.29 ± 3.32 | 0.23 ± 0.01 | −16.32 ± 0.16 | 189.45 ± 2.36 | 0.14 ± 0.06 | −20.56 ± 3.25 | |
| OEO100c | 10 | 204.56 ± 2.56 | 0.14 ± 0.03 | −10.4 ± 0.36 | 209.79 ± 4.56 | 0.17 ± 0.03 | −8.6 ± 0.52 | 196.2 ± 1.89 | 0.11 ± 0.02 | −10.56 ± 1.03 | |
| PLGA, 17% CY | CY17a | 0 | 172.4 ± 2.23 | 0.112 ± 0.03 | −14.4 ± 0.21 | 165.1 ± 3.69 | 0.10 ± 0.06 | −16.2 ± 0.32 | 200.46 ± 3.47 | 0.07 ± 0.02 | −9.19 ± 0.41 |
| CY17b | 5 | 194.5 ± 3.56 | 0.11 ± 0.02 | −12.65 ± 0.46 | 178.9 ± 2.56 | 0.15 ± 0.02 | −13.01 ± 0.61 | 165.12 ± 5.69 | 0.23 ± 0.08 | −14.23 ± 0.56 | |
| CY17c | 10 | 205 ± 4.2 | 0.24 ± 0.06 | −11.23 ± 0.2 | 189.56 ± 1.59 | 0.21 ± 0.09 | −10.11 ± 0.41 | 195.23 ± 3.88 | 0.16 ± 0.06 | −10.59 ± 0.87 | |
| PLGA, 50% CY | CY50a | 0 | 190.1 ± 3.2 | 0.18 ± 0.003 | −16.1 ± 1.18 | 195.31 ± 2.8 | 0.26 ± 0.04 | −13.45 ± 3.57 | 206.76 ± 4.16 | 0.08 ± 0.04 | −8.54 ± 0.47 |
| CY50b | 5 | 201.4 ± 2.56 | 0.16 ± 0.04 | −12.65 ± 2.3 | 206.23 ± 1.46 | 0.22 ± 0.07 | −6.19 ± 0.41 | 208.16 ± 6.56 | 0.12 ± 0.01 | −5.79 ± 0.23 | |
| CY50c | 10 | 203.56 ± 3.65 | 0.21 ± 0.03 | −10.56 ± 1.12 | 209.13 ± 4.12 | 0.26 ± 0.01 | −13.06 ± 0.10 | 212.89 ± 1.23 | 0.15 ± 0.09 | −16.45 ± 2.12 | |
| PLGA, 100% CY | CY100a | 0 | 203.5 ± 1.3 | 0.090 ± 0.02 | −10.4 ± 2.3 | 197.1 ± 0.3 | 0.16 ± 0.03 | −14.69 ± 0.7 | 205.53 ± 6.63 | 0.07 ± 0.02 | −5.83 ± 0.41 |
| CY100b | 5 | 223.23 ± 3.26 | 0.14 ± 0.03 | −8.26 ± 1.23 | 206.8 ± 4.03 | 0.14 ± 0.01 | −8.43 ± 2.66 | 216.56 ± 5.26 | 0.11 ± 0.09 | −8.56 ± 2.32 | |
| CY100c | 10 | 231.23 ± 4.2 | 0.21 ± 0.05 | −7.56 ± 0.56 | 209.19 ± 2.0 | 0.16 ± 0.05 | −9.06 ± 0.49 | 226.23 ± 2.34 | 0.16 ± 0.04 | −8.03 ± 1.11 | |
| PLGA, 17% CV | CV17a | 0 | 178.1 ± 0.65 | 0.047 + 0.05 | −22.7 ± 0.6 | 181.6 ± 0.49 | 0.09 + 0.04 | −24.1 ± 0.33 | 177.26 ± 5.0 | 0.09 ± 0.03 | −30.8 ± 3.62 |
| CV17b | 5 | 198 ± 2.56 | 0.14 ± 0.03 | −16.65 ± 0.45 | 186.1 ± 2.3 | 0.11 ± 0.06 | −13.74 ± 0.37 | 190.36 ± 4.13 | 0.12 ± 0.05 | −11.26 ± 2.36 | |
| CV17c | 10 | 195.4 ± 0.19 | 0.19 ± 0.03 | −9.3 ± 0.30 | 204.9 ± 0.33 | 0.21 ± 0.006 | −8.6 ± 0.21 | 198.65 ± 3.59 | 0.09 ± 0.04 | −8.02 ± 1.26 | |
| PLGA, 50% CV | CV50a | 0 | 172.6 ± 0.68 | 0.07 ± 0.011 | −18 ± 0.26 | 199.7 ± 0.42 | 0.12 ± 0.03 | −20.7 ± 0.6 | 175.4 ± 7.48 | 0.14 ± 0.03 | −25.17 ± 0.77 |
| CV50b | 5 | 208.2 ± 3.25 | 0.13 ± 0.06 | −12.6 ± 0.21 | 200.3 ± 1.03 | 0.18 ± 0.09 | −13.9 ± 0.16 | 199.2 ± 3.85 | 0.11 ± 0.02 | −7.66 ± 1.65 | |
| CV50c | 10 | 185.74 ± 3.58 | 0.12 ± 0.03 | −7.6 ± 0.45 | 203.6 ± 4.1 | 0.20 ± 0.05 | −6.3 ± 0.21 | 200.41 ± 4.65 | 0.14 ± 0.03 | −6.48 ± 1.30 | |
| PLGA, 100% CV | CV100a | 0 | 192.2 ± 1.26 | 0.129 ± 0.09 | −15.5 ± 0.69 | 175.6 ± 1.45 | 0.16 ± 0.04 | −16.4 ± 0.41 | 166.36 ± 2.47 | 0.12 ± 0.01 | −19.13 ± 4.24 |
| CV100b | 5 | 210.32 ± 1.62 | 0.08 ± 0.07 | −11.2 ± 1.6 | 213.15 ± 0.89 | 0.07 ± 0.03 | −10.3 ± 0.3 | 210.65 ± 4.32 | 0.13 ± 0.02 | −8.23 ± 2.16 | |
| CV100c | 10 | 212.23 ± 3.89 | 0.16 ± 0.05 | −8.4 ± 0.68 | 222.9 ± 1.1 | 0.17 ± 0.01 | −12.3 ± 0.57 | 221.26 ± 3.65 | 0.11 ± 0.03 | −10.98 ± 1.63 | |
- ∗a = 0%, b = 5%, and c = 10% of mannitol.
3.2. Chemical Characterization
The synthesized NPs underwent a detailed physicochemical characterization. As depicted in Figure 1(a), SEM observations confirm the successful formation of PLGA NPs loaded with the four different phytochemicals. Immediately after nanoprecipitation synthesis, the NPs were deposited and allowed to dry under standard pressure and temperature conditions to control the drying rate, thereby preserving the morphology of the NPs. Following this, the NPs were coated with a thin gold film to improve imaging quality during SEM analysis. These NPs exhibit a spherical and symmetrical morphology without deformation or agglomeration. Their observed size is lower than 200 nm, which aligns with hydrodynamic volume measurements obtained using the z-sizer (Table 2).
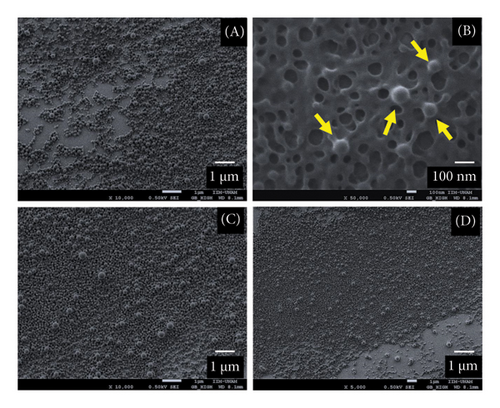
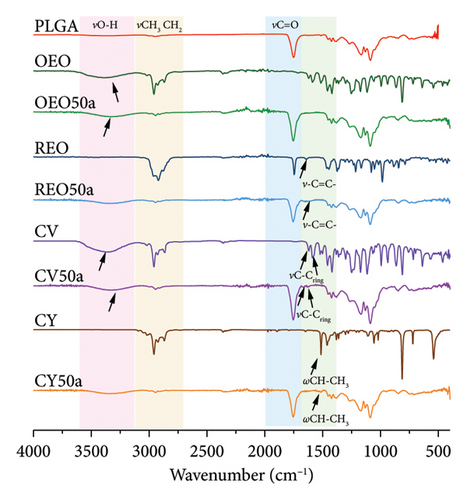
Figure 1(b) presents the infrared spectra of NPs loaded with 50% oil and without mannitol, serving as representative samples for the study. Initially, the spectrum of uncharged PLGA NPs reveals notable peaks, including the vibration νC=O of the ester carbonyl group and the vibrations νs and νas between 2950 and 3000 cm−1 corresponding to the CH2 and CH3 groups of PLGA.
Moving to oregano oil (Figure 1(b)-OEO) and its respective NPs (Figure 1(b)-OEO50a), distinct signals attributed to the stretching vibrations of the hydroxyl group νO-H are evident. Given the predominant polyphenolic composition of the oil, the abundance of these signals is expected in both spectra.
For rosemary oil (Figure 1(b)-RMEO) and its NPs (Figure 1(b)-RMEO50a), bands associated with the vibration of the C=C bond are observed, inherent to the oil’s terpene-rich nature [27]. CV and its NPs (Figure 1(b)-CV) exhibit signals corresponding to the vibrations of the C-C bonds in the aromatic ring [28].
In the case of CY (Figure 1(b)-CY) and its NPs (Figure 1(b)-CY50a), distinct vibrations of the CH-CH3 bond are noted. Notably, a band at 1750 cm−1 displays a shoulder in the spectra of NPs loaded with phytochemicals, indicating the presence of both ester carbonyl groups and carboxylic acid.
3.3. Thermal Behavior and Encapsulation Efficiency
Figure 2(a) presents the thermogravimetric analysis of a subset of the NPs (without mannitol), providing valuable insights into the enhanced stability of the encapsulated oils within the PLGA matrix. Notably, the thermal degradation patterns reveal a substantial increase (three folds) in the stability of the oils when encapsulated.
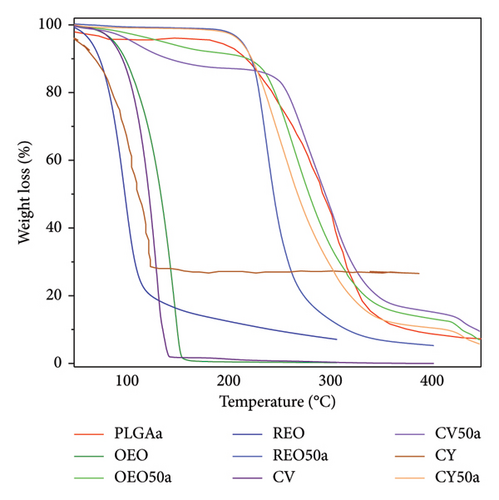
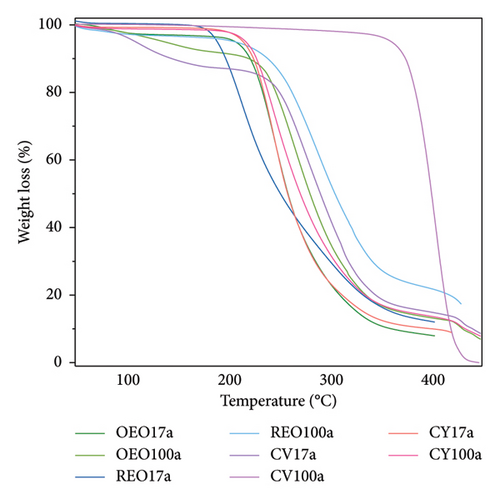
It is particularly noteworthy that both the oils, CV and CY, exhibit initiation of degradation at approximately 100°C. However, upon encapsulation, this degradation is effectively mitigated, and stability is maintained up to approximately 250°C. This observed resilience to higher temperatures underscores a key advantage of these nanoparticulate systems—they offer robust protection against the thermal and oxidative processes associated with combustion and degradation [29, 30]. The findings from this analysis serve as compelling evidence of the temperature stability conferred by the formulations, reinforcing their suitability for diverse applications.
Both the oils, CV and CY, initiate degradation at approximately 100°C. However, upon encapsulation, this degradation is effectively mitigated, and stability is maintained up to approximately 250°C.
The CV50a NPs (Figure 2(a)) exhibit a striking enhancement in thermal resistance, surpassing even the thermal stability of PLGAa. This observation hints at the possibility of high-energy electrostatic interactions between the phytochemical and the polymer, forming a highly stable molecular aggregate. The TGA data for the remaining samples are provided in Figure 2(b).
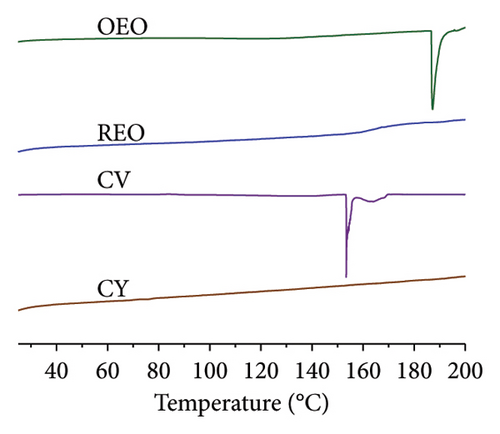
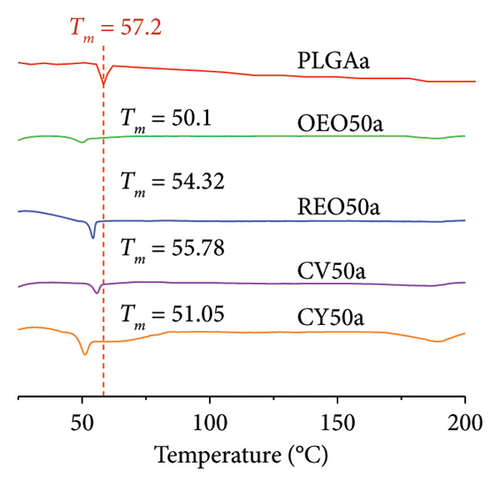
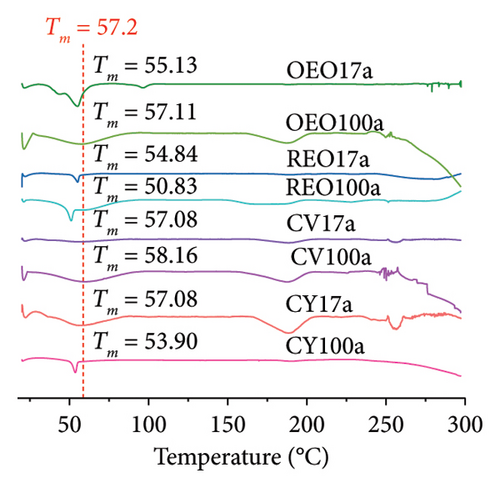
The data of DSC analysis for pure essential oils and phytochemicals are included in Figure 2(c). The results for representative samples are shown in Figure 2(d), along with additional sample results in Figure 2(e). In Figure 2(d), a distinct endothermic peak is observed for PLGAa NPs at 57.2°C, indicating their melting. Notably, for NPs loaded with both essential oils and phytochemicals, a noticeable shift in this characteristic peak is observed, with shifts ranging between 2°C and 7°C.
It is well established that impurities cause a downward displacement of the glass transition temperature (Tg) to lower temperatures, observed across all presented cases. Notably, for the OEO 17a formulation, the appearance of two peaks is observed, characteristic of eutectic mixtures with a higher content of impurities [31]. The application of equation (1) along with the parameters and trapping data depicted in Table 3 facilitates the estimation of the encapsulation percentage of the NPs.
| Sample | (K) | Tm (K) | Sample mass (g × 104) | Ximp | moil (mg) | moil (theoretical) (mg) | Encapsulation (%) |
|---|---|---|---|---|---|---|---|
| OEO 17a | 331.5 | 328.28 | 19.68 | 10 | 0.07 | 1.11 | 2.72 |
| OEO 50a | 331.5 | 323.02 | 13.59 | 4.9 | 0.26 | 4.12 | 8 |
| OEO 100a | 331.5 | 328.15 | 106.37 | 29.5 | 0.13 | 2.12 | 16 |
| RMEO 17a | 331.5 | 327.99 | 8.31 | 4 | 0.08 | 1.28 | 2.72 |
| RMEO 50a | 331.5 | 327.47 | 15.03 | 4.2 | 0.16 | 2.53 | 8 |
| RMEO 100a | 331.5 | 323.98 | 30.21 | 11.5 | 0.22 | 3.46 | 16 |
| CV 17a | 331.5 | 328.9 | 37.13 | 118 | 0.01 | 0.14 | 2.72 |
| CV 50a | 331.5 | 330.98 | 347.00 | 5.4 | 0.37 | 5.85 | 8 |
| CV 100a | 331.5 | 329.31 | 36.75 | 16.3 | 0.05 | 0.86 | 16 |
| CY 17a | 331.5 | 330.23 | 51.47 | 12.1 | 0.06 | 0.95 | 2.72 |
| CY 50a | 331.5 | 324.2 | 32.91 | 10.8 | 0.24 | 3.90 | 8 |
| CY 100a | 331.5 | 326.88 | 44.77 | 8.6 | 0.26 | 4.21 | 16 |
3.4. Comparative Analysis of the Antimicrobial Activity of Phytochemical and Essential Oil Nanoparticles Against Sessile Bacteria
3.4.1. Phytochemicals and Essential Oils’ Antimicrobial Capacities
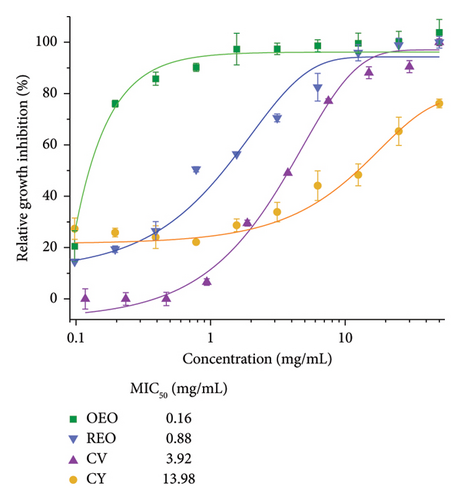
Figure 3(a) illustrates the antimicrobial activity of the EOs and phytochemicals utilized in the study, and their values are shown in Table 4.
| Sample∗ | Maximum dose (mgmL−1) | MIC50 (mgmL−1) | Growth inhibition (%) at maximum dose | ||
|---|---|---|---|---|---|
| 24 h | 48 h | 72 h | |||
| OEO | 25 | 0.16 | 100.86 ± 4.02 | Full inhibition | Full inhibition |
| RMEO | 25 | 0.88 | 100 ± 2.29 | Full inhibition | Full inhibition |
| CV | 25 | 3.92 | 100.0 ± 1.36 | Full inhibition | Full inhibition |
| CY | 25 | 13.98 | 76.156 ± 1.68 | Full inhibition | Full inhibition |
| PLGAa | 4.85 | Not reached | 12.695 ± 1.323 | 10.956 ± 1.989 | 6.656 ± 1.323 |
| PLGAb | 15 | Not reached | 37.711 ± 2.352 | 26.720 ± 3.955 | 18.403 ± 5.118 |
| PLGAc | 15 | Not reached | 26.223 ± 1.956 | 12.956 ± 1.985 | 10.956 ± 2.912 |
| RMEO17a | 4.85 | Not reached | 20.213 ± 4.449 | 37.323 ± 2.085 | 44.207 ± 5.688 |
| RMEO17b | 15 | Not reached | 40.012 ± 4.202 | 62.225 ± 3.314 | 36.249 ± 5.851 |
| RMEO17c | 15 | Not reached | 20.781 ± 6.403 | 40.289 ± 1.862 | 19.485 ± 3.184 |
| RMEO50a | 5 | Not reached | 29.936 ± 3.249 | 59.180 ± 2.927 | 42.535 ± 3.149 |
| RMEO50b | 15 | 15.291 ± 0.233 | 51.344 ± 4.236 | 61.588 ± 0.634 | 59.918 ± 1.236 |
| RMEO50c | 15 | Not reached | 42.049 ± 5.912 | 64.454 ± 2.545 | 67.597 ± 1.697 |
| RMEO100a | 5 | 0.64 ± 0.322 | 54.453 ± 4.701 | 60.201 ± 1.569 | 57.967 ± 1.229 |
| RMEO100b | 15 | 3.274 ± 0.655 | 54.189 ± 5.573 | 53.855 ± 2.354 | 54.298 ± 6.497 |
| RMEO100c | 15 | 2.038 ± 0.565 | 53.798 ± 1.837 | 62.285 ± 1.755 | 62.707 ± 1.724 |
| OEO17a | 5 | Not reached | 33.333 ± 1.450 | 46.643 ± 1.550 | 58.413 ± 1.075 |
| OEO17b | 15 | 3.052 ± 0.062 | 56.032 ± 3.141 | 62.073 ± 2.356 | 47.269 ± 1.887 |
| OEO17c | 15 | Not reached | 24.03 ± 1.930 | 48.163 ± 2.449 | 50.256 ± 3.074 |
| OEO50a | 5 | 0.645 ± 0.023 | 80.327 ± 0.275 | 90.104 ± 0.7 | 80.002 ± 0.003 |
| OEO50b | 15 | 4.793 ± 0.092 | 66.559 ± 2.993 | 66.742 ± 2.0 | 71.795 ± 2.216 |
| OEO50c | 15 | Not reached | 45.677 ± 1.550 | 52.890 ± 2.400 | 54.422 ± 1.900 |
| OEO100a | 5 | 0.703 ± 0.025 | 60.765 ± 2.125 | 68.173 ± 2.850 | 69.406 ± 2.725 |
| OEO100b | 15 | Not reached | 33.333 ± 1.456 | 46.643 ± 1.550 | 58.414 ± 1.075 |
| OEO100c | 15 | Not reached | 19.403 ± 2.103 | 33.043 ± 1.125 | 37.868 ± 1.658 |
| CY17a | 5 | Not reached | 30.454 ± 2.658 | 36.755 ± 2.481 | 33.812 ± 1.655 |
| CY17b | 15 | 14.321 ± 0.323 | 52.743 ± 1.537 | 61.994 ± 1.402 | 57.149 ± 1.599 |
| CY17c | 15 | Not reached | 34.569 ± 1.084 | 39.345 ± 2.326 | 40.029 ± 1.348 |
| CY50a | 5 | 0.492 ± 0.012 | 55.721 ± 2.175 | 68.404 ± 2.985 | 54.766 ± 2.025 |
| CY50b | 15 | 1.005 ± 0.132 | 60.501 ± 2.102 | 59.586 ± 1.602 | 16.219 ± 0.875 |
| CY50c | 15 | Not reached | 38.958 ± 0.329 | 58.393 ± 0.624 | 48.338 ± 0.852 |
| CY100a | 5 | 2.019 ± 0.026 | 51.272 ± 0.627 | 55.702 ± 0.494 | 61.776 ± 0.653 |
| CY100b | 15 | 2.464 ± 0.232 | 55.675 ± 1.625 | 69.432 ± 2.375 | 53.346 ± 1.602 |
| CY100c | 15 | Not reached | 48.589 ± 2.275 | 73.635 ± 2.150 | 66.577 ± 2.108 |
| CV17a | 5 | Not reached | Not reached | 58.477 ± 0.698 | 45.766 ± 0.946 |
| CV17b | 15 | Not reached | 25.00 ± 2.309 | 16.1303 ± 2.881 | 45.536 ± 3.237 |
| CV17c | 15 | Not reached | 34.115 ± 3.256 | 45.253 ± 3.996 | 52.462 ± 2.808 |
| CV50a | 5 | 0.443 ± 0.023 | 68.036 ± 4.654 | 48.598 ± 2.956 | 70.462 ± 2.599 |
| CV50b | 15 | 6.128 ± 0.655 | 55.222 ± 1.634 | 46.611 ± 2.311 | 58.043 ± 1.744 |
| CV50c | 15 | Not reached | 21.707 ± 1.791 | 73.158 ± 1.186 | 53.578 ± 1.357 |
| CV100a | 5 | Not resuspending | |||
| CV100b | 15 | Not reached | 31.552 ± 0579 | 60.370 ± 2.808 | 54.084 ± 2.509 |
| CV100c | 15 | Not reached | 39.876 ± 2.239 | 58.112 ± 3.018 | 60.041 ± 3.094 |
- Note: The formulations with the best inhibition results have been bolded. The best-performing groups from each oil/phytochemical were selected for further experimental steps (bolded in the table).
- ∗a = 0%, b = 5%, and c = 10% of mannitol.
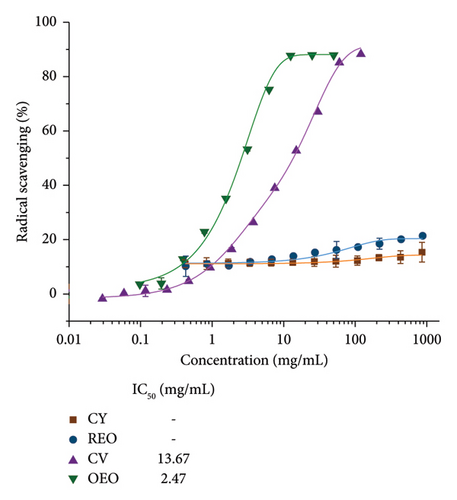
The concentrations required to inhibit 50% of the bacteria (MIC50) for the oregano and rosemary oils are 0.16 and 0.88 mg/mL, respectively. In contrast, the values of phytochemicals are significantly higher. On the other hand, the IC50 values (Figure 3(b)) of CV and oregano oil are 13.76 and 2.47 mg/mL; meanwhile, for rosemary oil and CY, the value is not achieved even at higher concentrations.
3.4.2. Loaded NPs’ Antimicrobial Performance
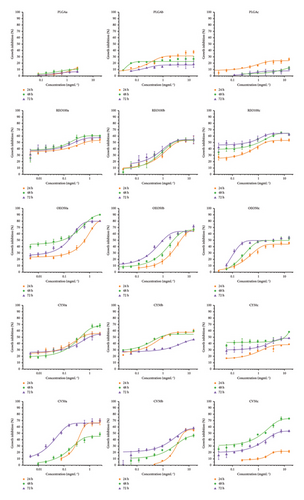
Figure 4 shows the MIC50 determination for the most representative samples, and the supporting information (Figures S1 to S5) contains graphs depicting the MIC50 determination and growth inhibition after 48 and 72 h for the 39 different formulations listed in Table 1. Representative values are provided in Table 4 for reference.
3.4.3. Antibiofilm Properties
Figure 5 shows the effect of NPs and the pure active ingredients on biofilm disruption at 24 h (Figures 5(a) and 5(b)) and 48 h (Figures 5(c) and 5(d)) at a concentration of 15 mg/mL, to observe the concentration-dependent variation in biofilm disruption (Figures S6 and S7). At 24 h, there is an approximate 80% reduction in bacterial population and a 50% reduction in extracellular matrix for PLGA NPs loaded with REO, CY, and the pure mannitol control.
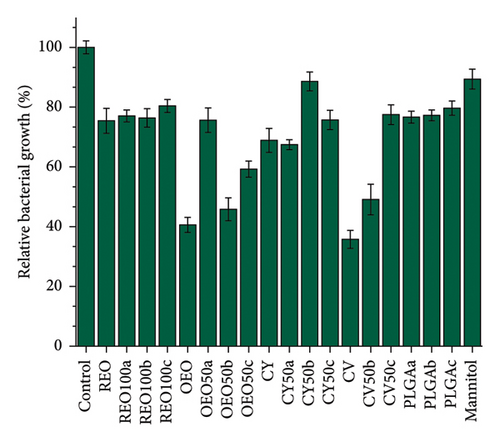
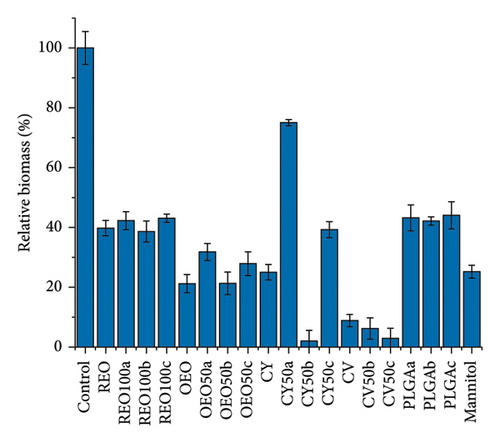
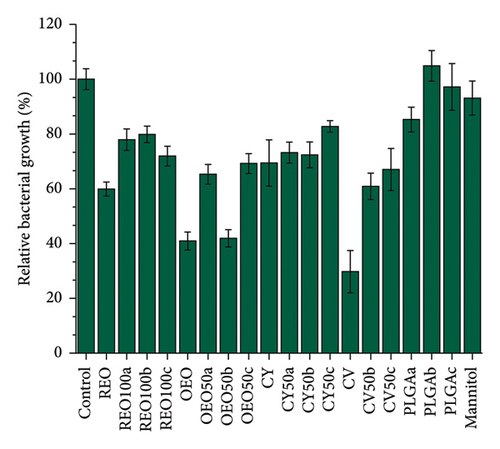
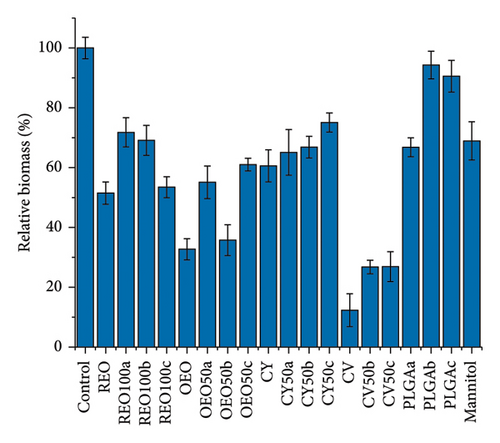
In contrast, formulations with pure oregano oil, CV, and their respective NPs show more potent effects, with about 50% growth inhibition and 80% reduction in extracellular matrix production. This effect persists after 48 h, indicating a controlled release and prolonged impact.
Notably, after 48 h, the effects of the PLGA NPs and mannitol control diminished, showing no significant impact compared to the control (untreated biofilm). However, all other formulations continue to reduce bacterial growth and biofilm presence. The OEO 50b formulation stands out with approximately 50% elimination of the bacterial population and over 70% reduction extracellular matrix.
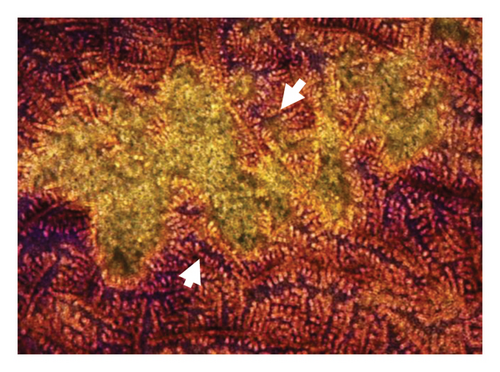
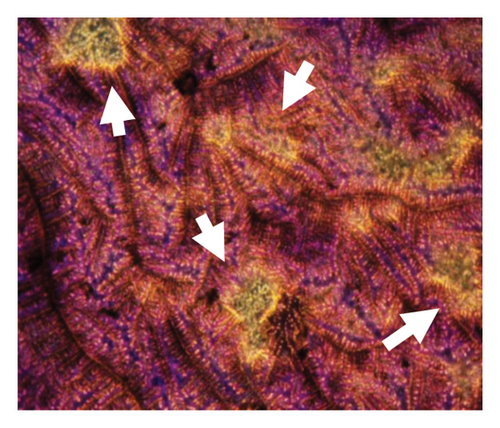
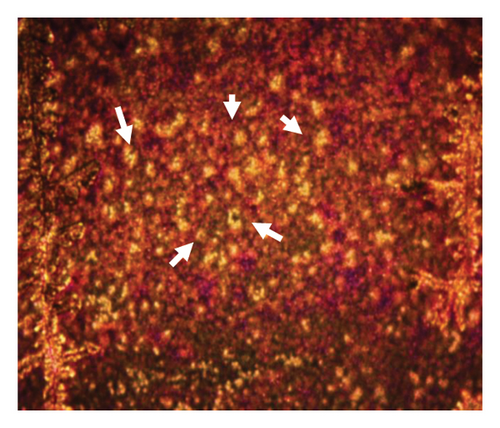
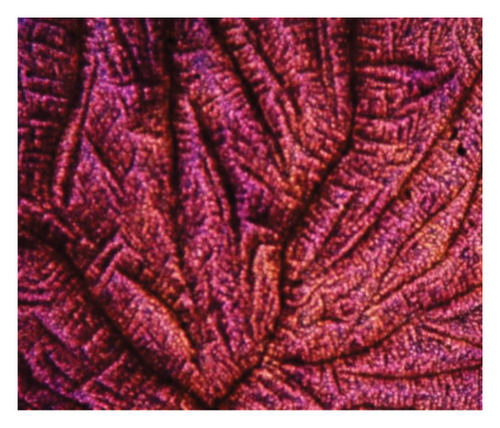
Figure 6 presents optical micrographs of biofilms treated with NPs for 48 h, stained with crystal violet. Differences are evident in comparing the untreated (healthy) biofilm to those treated with NPs. The treated biofilms show holes of varying sizes, with the most significant disruptions observed in the samples treated with oregano-loaded NPs. For the CY-loaded NPs, although the holes are smaller, the biofilm exhibits a marked loss of organization.

3.5. Cellular Viability of Phytochemical and Essential Oil Nanoparticles
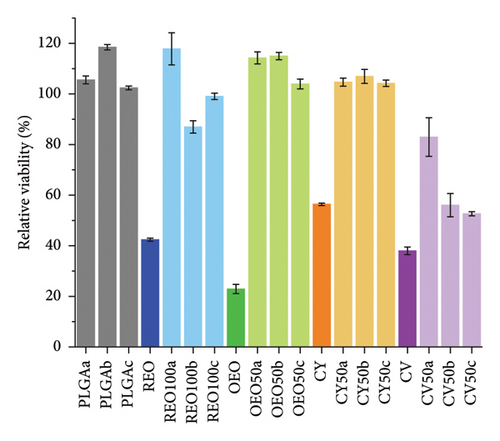
We tested the formulations’ cytotoxicity on BJ fibroblasts. Figure 7 presents the results, showing the variation of cytotoxicity with concentration. For detailed data on the cytotoxicity of the pure components and the 39 formulations listed in Table 2, please refer to the supporting information (Figures S8 and S9). As observed, the cytotoxicity of pure phytochemicals decreases by at least 40% when they are encapsulated.
4. Discussion
In this study, we developed 4 nanoformulations based on PLGA entrapping OEO, RMEO, CV, and CY. The nanosystems presented a spherical shape and an average size of 200 nm. This would enhance the dispersion of particles across mucosal layers in anatomical sites, including the respiratory tract, sinuses, eyes, and gastrointestinal tract—areas often susceptible to biofilm infections [32, 33]. This size range not only helps mitigate the problem of coalescence but also enhances the interaction with bacterial membranes, thereby potentially increasing the antimicrobial effect.
A narrow size distribution and a low mean hydrodynamic diameter were indicated by PDI values below 0.2. The z-potential values of the NPs consistently fall below −10 mV, a characteristic attributed to the chemical composition of PLGA. In aqueous environments, the carboxyl functional groups on the surface of PLGA undergo ionization, generating carboxylate ions with a negative charge. This ionization contributes to the negative surface charge observed in the NPs. As the quantity of PLGA in the NPs increases, so does the number of carboxyl groups, resulting in a greater abundance of ions and an intensified negative charge.
In the case of RMEO, predominantly composed of terpenes like CY that are generally resistant to ionization in aqueous media, it is assumed that their incorporation into the NPs has a negligible effect on the z-potential [34, 35]. Conversely, OEO, rich in phenolic acids such as CV, presents the potential for further negative modification of the NPs due to the conceivable deprotonation of hydroxyl groups [36]. These anticipated behaviors align with the results obtained (Table 2), particularly when comparing the z-potential values of NPs without incorporated mannitol.
Interestingly, mannitol appears to neutralize or mitigate certain ionization effects, as evidenced by the increased z-potential for NPs with mannitol incorporation [37]. This suggests that mannitol may act as a stabilizing factor, counteracting some of the surface charge alterations associated with PLGA, RMEO, and OEO, thereby influencing the overall electrostatic properties of the NPs.
FTIR, TGA, and DSC techniques confirmed the encapsulation of phytochemicals within the NPs. For example, the changes in degradation temperatures in the thermal analysis suggest the protection of oils and phytochemicals within the polymeric matrix. This observed resilience to higher temperatures underscores a key advantage of these nanoparticulate systems—they offer robust protection against the thermal and oxidative processes associated with combustion and degradation [29, 30]. The findings from this analysis serve as compelling evidence of the temperature stability conferred by the formulations, reinforcing their suitability for diverse applications. Furthermore, the DSC profile shows a shift in endothermic peak in the loaded NPs. This shift suggests that the oils and other compounds are entrapped within the NPs in an amorphous or disordered crystalline phase, forming a molecular dispersion or a solid solution state within the PLGA matrix [38, 39].
This behavior is particularly evident in the case of oregano oil and CV. Their respective transition peaks at 187°C and 153°C (Figure 2(c)) are absent in the calorimetric profiles of their formulations, indicating that they were in an amorphous state before being incorporated into the polymer matrix and are now dispersed within the PLGA [40].
Based on DSC results, the encapsulation percentages were calculated using the Van’t Hoff equation. The parameters governing the loading capacity and encapsulation efficiency of NPs play a pivotal role in developing effective nanoformulations, highlighting the importance of understanding them. As depicted in Table 3, a prevailing trend is observed wherein a higher amount of essential oil or phytochemical is encapsulated when employed in a 0.5:1 ratio with respect to the polymer in the experimental setup. This aligns with prior studies indicating that increasing the oil-to-polymer ratio reduces the percent encapsulation efficiency (%EE), likely due to saturation of the oil/polymer phase [41, 42].
In the case of antimicrobial properties, it is evident that the concentration required to inhibit 50% of the bacteria (MIC50) is lower for the essential oils compared to their individual main components. This observation underscores the notion that using pure substances does not necessarily yield superior effects and reinforces the idea that essential oils possess enhanced synergistic effects [43, 44]. This phenomenon mirrors the behavior observed in the antioxidant capacity, as depicted in Figure 2(b).
The antibacterial activity of PLGA NPs was evaluated as a control to isolate the effects of the components (PLGA, PVA, and mannitol) and clearly observe the contribution of essential oils and pure phytochemicals to the antimicrobial activity of the loaded NPs. The results in Figure 3, the supporting information graphs (S1–S5), and Table 4 demonstrate that all loaded NPs exhibit significantly enhanced antimicrobial activity compared to the PLGA NP controls, whose activity was reported previously [45].
Comparing the antimicrobial capacity of the NPs to that of the pure oil, even assuming complete release at 24 h and regarding the encapsulation percentage, the MIC50 values for the best nanoformulations (bolded in Table 4) showed an increase in until 6 times the activity for RMEO, 100 times for CY, and 20 times for CV. In the case of OEO, the encapsulation does not quantitatively improve the MIC compared to pure oil (0.16 mg/mL). However, as shown in Figure 3 and Table 4, the inhibition percentages of these formulations are higher than those found in other systems, with inhibitions approaching 100% and maintaining this level for up to 72 h. All these findings supported the idea that encapsulating molecules in NPs enhances their therapeutic efficacy. In the antibiofilm evaluation, the treatments were administrated and left in contact for 24 and 48 h with mature biofilms (Figure 5), which few research papers have reported. The findings demonstrated that OEO and CV were the best treatments (in NPs and free form), decreasing the extracellular matrix, which is crucial in all biofilms to facilitate the adhesion and aggregation of planktonic cells, contributing to antimicrobial resistance [46, 47]. This behavior is also endorsed by that observed in Figure 6. In this context, the systems generated with a negative z-potential could offer significant advantages in disrupting S. aureus biofilms. Due to electrostatic attraction, these negatively charged particles will likely be drawn to the biofilm surface, enhancing their adhesion and potential permeation. Furthermore, releasing essential oils from these NPs could exert bactericidal effects and alter the biofilm’s matrix, “plasticizing” the polysaccharide matrices [48, 49], promoting the integration of NPs into the biofilm’s three-dimensional structure, thereby overcoming a major obstacle in biofilm disintegration [50]. Additionally, these systems can interfere with bacterial quorum sensing, imperative for biofilm maintenance and virulence. Quorum sensing disruption by phytochemicals and essential oils is attributed to their multifunctional chemical structures, which allow various interactions such as hydrogen bonding, dipole-dipole interactions, metal chelation, and hydrophobic interactions [51, 52].
A key aspect of this research is that the antibiofilm effect is not aimed at preventing biofilm formation mechanism (Figure 5(a)) by using NPs as a coating. Instead, the focus is on treating mature biofilms cultured for 24 h, which few research papers have reported. After the biofilm monolayer was established, various treatments were administered and left in contact for 24 and 48 h. Subsequently, the composition of the biofilms was evaluated.
This experimental approach aims to verify whether these treatments could benefit in treating infected wounds, where biofilm presence is a major limitation compared to the few existing treatments. It is generally preferable to prevent biofilm formation rather than treat it; however, there is a high incidence of biofilm-related pathologies in medical practice. This is especially relevant in conditions such as skin ulcers [5], burns [53], and diabetic foot ulcers [54, 55], making it urgent to develop effective treatments that do not contribute to developing antibiotic resistance.
Despite demonstrating significant antimicrobial and antibiofilm activity, the developed nanosystems are not cytotoxic at therapeutic doses (Figure 7). This contrasts the high toxicity observed with pure phytochemicals and essential oils at concentrations tested for antimicrobial activity. These findings align with previous literature suggesting that encapsulating bioactive compounds in polymeric matrices enhances their antimicrobial efficacy while mitigating adverse effects [56, 57], a desirable and common effect of encapsulated drugs [58, 59].
4.1. Benchmarking Against Existing Research
When comparing the effectiveness of the PLGA NPs developed in this study with previous reports, it becomes evident that our approach is relatively novel. Lipid systems for delivering hydrophobic components like essential oils and phytochemicals are more common despite their low stability [60–62]. However, encapsulating these components in PLGA NPs offers several advantages, including improved diffusion in hydrophilic media and better interaction with bacterial membranes [63].
Studies have shown that PLGA NPs can effectively enhance the delivery of hydrophobic components in aqueous environments favored by bacteria. For instance, the hydrophobic nature of the S. aureus membrane, primarily composed of peptidoglycan and teichoic acid, makes it a suitable target for interaction with NPs [64, 65]. The presence of surfactant on the NP surface further facilitates this interaction and the adhesion to the bacterial cell.
These characteristics make PLGA NPs promising candidates for antimicrobial applications. Unlike lipid systems, PLGA NPs exhibit greater stability (up to 6 months as shown in Table 2) and a prolonged release profile. Comparing our results with previous reports is challenging due to the scarcity of studies on PLGA NPs loaded with essential oils, but we can draw some useful insights.
For example, Pola et al. reported a MIC of around 8 mg/mL for S. aureus using PLGA-chitosan NPs for trans-cinnamaldehyde release [63]. Our formulations demonstrate 50% higher activity, likely due to more potent phytochemicals and smaller particle sizes, which increase surface area and enhance membrane interaction. Similarly, Ma et al. developed chitosan NPs (> 250 nm) for OEO release, showing inhibition halos over 6 mm against P. aeruginosa strains, attributed to chitosan’s cationic nature and NP size [66].
Furthermore, encapsulating fennel extract in PLGA NPs showed enhanced antimicrobial activity compared to the pure compound, aligning with our findings [67]. This indicates that encapsulation improves efficacy and allows for lower doses and more significant effects [29].
Mannitol coating also plays a crucial role in improving NP solubility. Lyophilized NPs without mannitol show a maximum solubility in water of 5 mg/mL. In contrast, those with 5%–10% w/v mannitol before lyophilization achieve up to 100 mg/mL solubilities. This increased solubility in hydrophilic media is essential for treating infections effectively. Based on these observations, the most effective formulations (shown in Figure 4 and bolded in Table 4) were selected for further studies on disrupting S. aureus biofilms. These results underscore the potential of PLGA NPs as a stable and efficient delivery system for antimicrobial agents.
5. Conclusions
In conclusion, our study demonstrates the potential of polymeric NPs loaded with RMEO and OEO and key phytochemicals as effective agents for disrupting bacterial biofilms (reduction around 50% of bacteria and biomass). Our findings reveal that encapsulating essential oils and phytochemicals within polymeric matrices (20% loading percentage), specifically PLGA NPs, enhances their antimicrobial efficacy (> 20 times) while reducing cytotoxicity from 60% to 10% on fibroblast. This is attributed to the controlled release of active compounds, improved interaction with bacterial membranes, and disruption of quorum sensing mechanisms within biofilms due to the synergic behavior of the EOs and the mannitol.
Furthermore, our study highlights the importance of NP size (200 nm), composition, and surface charge in influencing antimicrobial activity. We have demonstrated that NPs with a negative zeta potential exhibit enhanced adhesion to biofilm surfaces, facilitating their penetration and disruption. In addition, post-lyophilization, the NPs demonstrated excellent stability, with effortless resuspension and preserved size, PDI, and z-potential after three and six months of storage at room temperature, indicating a prolonged shelf life.
Overall, our work contributes to the growing body of literature on NP-based therapies for infectious diseases, providing valuable insights into the design and development of effective antimicrobial agents. Additional research efforts are needed for further optimizing NP formulations, exploring additional antimicrobial mechanisms, and evaluating their efficacy in the context of clinical trials.
Conflicts of Interest
The authors declare no conflicts of interest.
Funding
We acknowledge the financial support by PAPIIT IN204722 and PAPIME PE205524 from DGAPA-UNAM. P.-B.C. is grateful for the financial support of DGAPA-UNAM through the project PAPIIT IT200424. A.R.-M. would like to thank Conahcyt for their scientific and financial support through the program “Becas Posdoctorales.”
Acknowledgments
A.R.-M. would like to thank Conahcyt for their scientific and financial support through the program “Becas Posdoctorales.” The authors also would like to thank Karla Eriseth Reyes-Morales for her technical assistance with thermal tests, Miguel Ángel Canseco Martínez for the support in FTIR analysis, and Lourdes Soledad Bazán Díaz for her assistance in SEM evaluation.
Supporting Information
Supporting information available: Biofilm inhibition curves, bacterial growth inhibition curves, and cytotoxicity curves of essential oils and nanoparticles..
Open Research
Data Availability Statement
The data that support the findings of this study are available from the corresponding authors upon request.


