
Integrated Neural Network Analysis of Machining Characteristics in Dry-Turned Al7075/FA0.9SiC0.9 Hybrid Composite Using PCD Inserts
Abstract
This study presents a comprehensive analysis of the machinability characteristics of an aluminum-based hybrid nanocomposite (Al7075 reinforced with 0.9 wt.% fly ash and 0.9 wt.% SiC) fabricated using an ultrasonically assisted stir-casting technique. Dry turning operations were performed using polycrystalline diamond (PCD) inserts to evaluate the influence of key input parameters—cutting speed, feed rate, depth of cut, and tool nose radius—on output machining regimes, namely, cutting force components and tool tip temperature. The results revealed that increasing cutting speed reduces the cutting force while elevating the tool tip temperature. Conversely, an increase in feed rate, depth of cut, and nose radius leads to a rise in both force components and temperature. A full factorial artificial neural network (ANN) model was developed to predict these output responses accurately. The ANN model demonstrated high prediction accuracies with errors of 11.50%, 15.88%, and 9.89% for the main cutting force, thrust force, and tool tip temperature, respectively, in the validation set. These findings confirm the model’s reliability in forecasting machining behavior, offering valuable insights for optimizing the dry machining of hybrid composites.
1. Introduction
Lightweight, inexpensive materials with high specific strength are in high demand in industries like aerospace, sports, and automobiles [1]. The demand from various sectors can be met by metal matrix composites (MMCs) [2]. Machining operation creates the vast majority of components used in the manufacturing sector. Aluminum alloy is prioritized by aerospace and automotive engineers for its superior thermal stability, mechanical qualities, and low cost compared to other lightweight alloys [3].
Particulates like SiC, B4C, Al2O3, TiO2, and SiN have been studied extensively over the past two decades to improve the specific mechanical properties of MMCs [4–7]. Particles with sizes on the order of a micron and a nanometer are the focus of these investigations. These experiments have shown that nanoscale particles can significantly impact the properties of MMCs compared to their microscale counterparts [8–10]. Using hard-phased nanosized ceramic reinforcement typically raises composite material costs [4]. Using industrial and bio waste ashes like rice husks, coconut shells, walnut shells, and fly ash (FA) can additionally increase the composite materials’ individual qualities [11–15]. Therefore, the cost of reinforcing particles can be decreased, as these materials are easily available and may cause environmental problems (pollution) if not utilized. Thermal power facilities produce FA as a by-product; it consists of the thermally stable phases of alumina and silicate [16]. Composites benefit greatly from the low density and high hot hardness of FA particles, resulting in superior specific strength [17, 18].
In the manufacturing industry, the machining process plays a crucial role in developing the components. Due to hard phase reinforcements, MMCs are relatively difficult to cut, resulting in a high machining cost [19, 20]. Among the several types of machining, turning is the most significant. It is required to optimize the machine variables associated with the turning operation to reduce machining costs [21]. Numerous studies have been undertaken to establish a database of optimal combinations of tools, workpieces, and machine variables [22–25].
Regression correlations have been derived utilizing methodologies such as the gray relational analysis (GRA), intuitionistic fuzzy logic, dimensional analysis (DA), artificial neural networks (NNs) (ANNs), adaptive neuro-fuzzy inference system (ANFIS), dimensional exponential model (DEM) and response surface method (RSM) [7, 24, 26–32]. By exploiting these correlations, optimal input regime values can be identified [27, 33]. Optimization of EDM parameters for Al/B4C composites using Taguchi and GRA improved MRR, tool wear rate (TWR), and Ra, with pulse on time and input current (IP) being the most influential factors [24]. In other research, an integrated TOPSIS-ANFIS approach was applied to optimize WEDM parameters for Al/GrCp10 MMC, leading to significant improvement in machining performance [30]. Furthermore, the cutting operation of wire EDM of a novel Al/Gr/Cp5 MMC was optimized using an integrated ANFIS and RSM, identifying pulse-on time as the most critical factor with a minimum surface roughness of 1.8655 microns, demonstrating strong predictive accuracy (R2 = 0.9624) and effective process optimization [29]. Additionally, the EDM operation of Al/Cu/Ni alloys was optimized using an ANFIS, where IP and pulse-on time were the most significant factors affecting TWR, achieving excellent prediction accuracy (R2 = 0.9999) and minimizing TWR to 0.0388 mm3/min [34]. This study investigates the effect of EDM parameters on surface roughness of Al/Cu/Ni alloy using DEM, RSM, and ANFIS models, finding ANFIS most accurate. The IP was identified as the most influential parameter in determining surface quality [31]. Further, another study models and predicts WEDM performance for Al/SiCp MMC using DA and ANN, finding ANN models more accurate. Pulse-on time was identified as the most influential factor affecting surface roughness and material removal rate [35]. Additionally, the development and performance evaluation of Al/SiC/coconut and bagasse ash composites using integrated DA and ANFIS found DA models more accurate for predicting MRR, with feed rate (FR) being the most critical parameter [12]. Furthermore, an intuitionistic fuzzy divergence approach was used to classify the mechanical stress states of steel plates subjected to biaxial loads based on eddy current maps, improving classification accuracy and reducing uncertainty significantly [36]. Previous research demonstrates that the ANN model can successfully handle problems such as the mathematical relations between input and output variables, which is crucial for machining processes to obtain the optimum set of variables [37]. The ANN model is, therefore, useful for constructing prediction models associated with machining regimes. Various researchers have investigated the suitability of different combinations of workpieces and cutting tools for the machining of aluminum matrix composites (AMCs). Among these investigations, it has been consistently determined that the use of a polycrystalline diamond (PCD) tool yields the most favorable results [38–40]. PCD tools have shown superior performance over conventional tungsten carbide (WC) tools for machining AMCs reinforced with SiC particles. PCD tools, due to their very high hardness (around 80–85 GPa) and excellent abrasion resistance, achieve significantly longer tool life up to 30 times higher compared to WC tools, which wear rapidly due to the hardness of SiC reinforcements [41, 42]. While WC tools experience severe flank and crater wear even at moderate cutting speeds (CSs), PCD tools mainly exhibit minor crater wear with negligible flank damage. The formation of a stable built-up edge (BUE) on PCD tools acts as a protective barrier against abrasive forces, further extending tool life [43]. Additionally, PCD allows high-speed dry machining, maintains better surface integrity, and results in lower cutting forces and specific power consumption, making it the preferred cutting tool material for precision machining of MMCs compared to WC [42].
Although extensive studies exist on machining AMCs with conventional reinforcements, limited work focuses on hybrid composites reinforced with nanosized SiC and industrial waste like FA. Additionally, the combined influence of cutting parameters and tool nose radius (NR) on cutting forces and tool-tip temperature, especially using PCD tools under dry turning, remains underexplored. Further, the use of ANN for accurate predictive modeling in this context has not been sufficiently addressed. The present study is an in-depth experimental investigation of Al7075 alloy reinforced with a hybrid mix of SiC and FA nanosized (≤ 100 nm) particles. In this experiment, we considered three levels of FR, CS, and depth of cut (DoC) to examine how they affect the machining process. For turning PCD tool has been considered with two different NR of 0.4 and 0.8 mm. It has been revealed how these cutting variables affect the value of required cutting force components (main cutting force (Fx) and thrust force (Ft)) and the temperature at the tool’s tip (Tt). Further, ANNs are used to create regression correlations between input and output variables. The created model has been trained using 21 different combinations, and six trials have validated it. The validation sets demonstrate a significant level of concurrence between the observed values and the experimental values, thus indicating the high accuracy of the ANN models. The created model can also predict output regimes within the allowed operational range relative to input regimes.
2. Machinability Study
Experiments were carried out in a dry machining condition using a computer numerical control machine (manufactured by Baltiboi). For experimentation, the composite material was fabricated by considering industrial waste (FA and SiC) particulates with ≤ 100 nm size, each having a 0.9 weight percentage. Nanocomposite was fabricated by using an ultrasonically assisted stir-casting process. Composite specimens, with dimensions of ϕ10 mm and 10 mm in height, were made specifically for the purpose of scanning electron microscopy (SEM) examination. The SEM analysis of the specimens affirms the homogeneous dispersion of FA and silicon carbide particles within the Al7075 matrix. The turning operation was conducted on an Al7075 alloy and a hybrid nano (≤ 100 nm) composite (Al7075/SiC0.9CS0.9). The PCD CCGW090304 insert with a 6° rake, 7° clearance angle, and 0.4 and 0.8 mm NR was utilized for the experiments. Three cutting regimes (CS, FR, and DoC) are chosen after assessing the tool’s and machine’s capabilities. A full factorial experimental design has been chosen to improve the accuracy of the ANN model, Table 1. Various machine and tool variables are considered in the machining experiment, Tables 2 and 3. A Kistler 9257B quartz three-component universal dynamometer was utilized to evaluate the cutting forces. The temperature is detected with a radiation sensor (1°C–1200°C) focused directly on the tip of the tool, as unveiled in Figure 1.
| ANN nomenclature | Value/type | |
|---|---|---|
 |
Number of input layers | 1 |
| Number of output layers | 1 | |
| Number of hidden layers | 1 | |
| Number of neurons in the input layer | 3 | |
| Number of neurons in a hidden layer | 5 | |
| Number of neurons in the output layer | 1 | |
| Network training algorithm | Levenberg–Marquardt backpropagation | |
| Activation function used in a hidden layer | Hyperbolic tangent function (tansig) | |
| Activation function used in the output layer | Pure linear function (purelin) | |
| Number of epochs | 1000 | |
| Training goal | 0.001 |
| Exp. no. | CS | FR | DOC | Tool material | Nose radius | Al7075/FA0.9 SiC0.9 | ||||||||
|---|---|---|---|---|---|---|---|---|---|---|---|---|---|---|
| m/min | mm/rev | mm | mm | Exp. Fx (N) | ANN Fx (N) | %age error | Exp. Ft (N) | ANN Ft (N) | %age error | Exp. Tt (°C) | ANN Tt (°C) | %age error | ||
| 1 | 60 | 0.14 | 0.2 | PCD | 0.4 | 46 | 46.0043 | 0.0093 | 8 | 8.01124 | 6.8165 | 64 | 63.999713 | 0.0004 |
| 2 | 120 | 0.14 | 0.2 | PCD | 0.4 | 37 | 37.01942 | 0.0525 | 7 | 6.99259 | 7.5783 | 105 | 104.99995 | 0.0001 |
| 3 | 180 | 0.14 | 0.2 | PCD | 0.4 | 34 | 34.00769 | 0.0226 | 5 | 5.0003 | 0.006 | 117 | 117.0001 | 0.0001 |
| 4 | 120 | 0.18 | 0.2 | PCD | 0.4 | 43 | 42.98837 | 0.0270 | 7 | 7.0234 | 0.3343 | 123 | 123.0001 | 0.0001 |
| 5 | 180 | 0.18 | 0.2 | PCD | 0.4 | 38 | 37.96845 | 0.0830 | 5 | 4.99964 | 0.0072 | 126 | 125.99944 | 0.0004 |
| 6 | 60 | 0.22 | 0.2 | PCD | 0.4 | 55 | 55.00393 | 0.0071 | 9 | 9.0285 | 0.3167 | 95 | 94.999906 | 0.2743 |
| 7 | 180 | 0.22 | 0.2 | PCD | 0.4 | 44 | 43.99948 | 0.0012 | 7 | 6.99848 | 0.0217 | 145 | 144.99889 | 0.0008 |
| 8 | 60 | 0.14 | 0.3 | PCD | 0.4 | 53 | 53.01328 | 0.0251 | 9 | 9.01747 | 3.8879 | 70 | 69.999166 | 0.0012 |
| 9 | 120 | 0.14 | 0.3 | PCD | 0.4 | 45 | 45.04997 | 0.1110 | 8 | 8.01254 | 0.1567 | 107 | 107.00017 | 0.0002 |
| 10 | 60 | 0.18 | 0.3 | PCD | 0.4 | 65 | 64.99991 | 0.0001 | 12 | 11.9994 | 0.0053 | 90 | 90.0004 | 0.0004 |
| 11 | 120 | 0.18 | 0.3 | PCD | 0.4 | 58 | 57.98918 | 0.0187 | 10 | 9.99278 | 3.4514 | 120 | 120.00006 | 0.0001 |
| 12 | 180 | 0.18 | 0.3 | PCD | 0.4 | 52 | 51.96642 | 0.0646 | 8 | 7.99214 | 3.3598 | 131 | 131.00031 | 0.0002 |
| 13 | 60 | 0.22 | 0.3 | PCD | 0.4 | 73 | 72.99397 | 0.0083 | 14 | 13.9492 | 3.3275 | 100 | 100.00021 | 0.0002 |
| 14 | 120 | 0.22 | 0.3 | PCD | 0.4 | 67 | 67.00599 | 0.0089 | 11 | 10.993 | 4.695 | 128 | 127.99941 | 0.0005 |
| 15 | 180 | 0.22 | 0.3 | PCD | 0.4 | 65 | 64.97014 | 0.0459 | 9 | 8.99793 | 2.6198 | 153 | 152.99877 | 0.0008 |
| 16 | 120 | 0.14 | 0.4 | PCD | 0.4 | 71 | 71.05417 | 0.0763 | 11 | 11.0064 | 0.0584 | 117 | 116.99962 | 0.0003 |
| 17 | 180 | 0.14 | 0.4 | PCD | 0.4 | 65 | 65.02047 | 0.0315 | 10 | 9.99137 | 5.1723 | 135 | 134.99985 | 0.0001 |
| 18 | 60 | 0.18 | 0.4 | PCD | 0.4 | 89 | 88.97926 | 0.0233 | 14 | 13.9938 | 0.044 | 91 | 91.000616 | 0.0007 |
| 19 | 180 | 0.18 | 0.4 | PCD | 0.4 | 74 | 74.01215 | 0.0164 | 11 | 10.9829 | 4.5995 | 135 | 135.00012 | 0.0001 |
| 20 | 60 | 0.22 | 0.4 | PCD | 0.4 | 103 | 102.9087 | 0.0886 | 17 | 16.9501 | 2.7278 | 101 | 101.00115 | 0.0011 |
| 21 | 120 | 0.22 | 0.4 | PCD | 0.4 | 89 | 89.01031 | 0.0116 | 13 | 12.9975 | 0.0194 | 134 | 133.99958 | 0.0003 |
| 22 | 60 | 0.14 | 0.2 | PCD | 0.8 | 60 | 59.99946 | 0.0009 | 14 | 14.0373 | 2.3126 | 103 | 102.88399 | 0.1126 |
| 23 | 120 | 0.14 | 0.2 | PCD | 0.8 | 47 | 47.07237 | 0.1540 | 12 | 11.9886 | 4.2491 | 149 | 148.91306 | 0.2191 |
| 24 | 180 | 0.14 | 0.2 | PCD | 0.8 | 46 | 46.00312 | 0.0068 | 11 | 11.0235 | 4.9855 | 180 | 179.98662 | 0.0074 |
| 25 | 120 | 0.18 | 0.2 | PCD | 0.8 | 60 | 60.76647 | 1.2775 | 14 | 13.9027 | 2.0004 | 170 | 170.04266 | 0.0251 |
| 26 | 180 | 0.18 | 0.2 | PCD | 0.8 | 58 | 57.41849 | 1.0026 | 13 | 13.0252 | 4.2019 | 201 | 201.02002 | 0.0100 |
| 27 | 60 | 0.22 | 0.2 | PCD | 0.8 | 82 | 81.16276 | 1.0210 | 19 | 19.0215 | 0.9295 | 115 | 115.02697 | 0.0235 |
| 28 | 180 | 0.22 | 0.2 | PCD | 0.8 | 67 | 66.99601 | 0.0060 | 13 | 13.0064 | 1.4665 | 222 | 222.08679 | 0.0391 |
| 29 | 60 | 0.14 | 0.3 | PCD | 0.8 | 90 | 89.99428 | 0.0064 | 19 | 18.9979 | 0.011 | 108 | 108.13234 | 0.1225 |
| 30 | 120 | 0.14 | 0.3 | PCD | 0.8 | 70 | 69.49177 | 0.7260 | 15 | 14.9931 | 1.1342 | 151 | 151.07968 | 0.0528 |
| 31 | 60 | 0.18 | 0.3 | PCD | 0.8 | 99 | 99.80554 | 0.8137 | 21 | 20.9701 | 0.048 | 111 | 110.99929 | 0.0006 |
| 32 | 120 | 0.18 | 0.3 | PCD | 0.8 | 84 | 83.11355 | 1.0553 | 16 | 16.0696 | 0.4347 | 176 | 176.00003 | 0.0000 |
| 33 | 180 | 0.18 | 0.3 | PCD | 0.8 | 60 | 61.13794 | 1.8966 | 15 | 14.9756 | 0.1629 | 209 | 208.94996 | 0.0239 |
| 34 | 60 | 0.22 | 0.3 | PCD | 0.8 | 110 | 109.7848 | 0.1956 | 31 | 31.0006 | 0.3996 | 116 | 115.88937 | 0.0954 |
| 35 | 120 | 0.22 | 0.3 | PCD | 0.8 | 100 | 99.88903 | 0.1110 | 26 | 25.9877 | 1.9126 | 189 | 189.08264 | 0.0437 |
| 36 | 180 | 0.22 | 0.3 | PCD | 0.8 | 90 | 90.20711 | 0.2301 | 19 | 18.9969 | 0.2788 | 228 | 227.90865 | 0.0401 |
| 37 | 120 | 0.14 | 0.4 | PCD | 0.8 | 81 | 81.51308 | 0.6334 | 18 | 18.0134 | 1.9434 | 158 | 157.97903 | 0.0133 |
| 38 | 180 | 0.14 | 0.4 | PCD | 0.8 | 77 | 76.65751 | 0.4448 | 17 | 16.9783 | 2.8986 | 186 | 186.01263 | 0.0068 |
| 39 | 60 | 0.18 | 0.4 | PCD | 0.8 | 145 | 145.1764 | 0.1217 | 28 | 27.9993 | 0.4639 | 115 | 114.98868 | 0.0098 |
| 40 | 180 | 0.18 | 0.4 | PCD | 0.8 | 111 | 110.5042 | 0.4466 | 20 | 20.0023 | 1.4664 | 211 | 211.03736 | 0.0177 |
| 41 | 60 | 0.22 | 0.4 | PCD | 0.8 | 147 | 146.9587 | 0.0281 | 37 | 36.9988 | 0.0034 | 119 | 119.08097 | 0.0680 |
| 42 | 120 | 0.22 | 0.4 | PCD | 0.8 | 134 | 134.3474 | 0.2592 | 27 | 27.0044 | 0.0906 | 193 | 192.89928 | 0.0522 |
| Exp. no. | CS | FR | DOC | Tool material | Nose radius | Al7075/FA 0.9 SiC0.9 | ||||||||
|---|---|---|---|---|---|---|---|---|---|---|---|---|---|---|
| m/min | mm/rev | mm | mm | Exp. Fx (N) | ANN Fx (N) | %age error | Exp. Ft (N) | ANN Ft (N) | %age error | Exp. Tt (°C) | ANN Tt (°C) | %age error | ||
| 1 | 60 | 0.18 | 0.2 | PCD | 0.4 | 53 | 48.3997 | 8.68 | 8 | 8.566369 | 7.08 | 84 | 86.7705 | 3.30 |
| 2 | 120 | 0.22 | 0.2 | PCD | 0.4 | 50 | 51.4052 | 2.81 | 8 | 8.709094 | 11.09 | 123 | 121.011 | 1.62 |
| 3 | 180 | 0.14 | 0.3 | PCD | 0.4 | 40 | 37.7931 | 5.52 | 7 | 6.617455 | 5.46 | 125 | 120.723 | 3.42 |
| 4 | 60 | 0.14 | 0.4 | PCD | 0.4 | 74 | 75.7238 | 2.33 | 13 | 12.37844 | 0.97 | 74 | 81.3212 | 9.89 |
| 5 | 120 | 0.18 | 0.4 | PCD | 0.4 | 76 | 81.5484 | 7.30 | 12 | 13.32626 | 15.88 | 125 | 128.832 | 3.07 |
| 6 | 180 | 0.22 | 0.4 | PCD | 0.4 | 85 | 77.9064 | 8.35 | 11 | 11.75572 | 2.40 | 159 | 158.764 | 0.15 |
| 7 | 60 | 0.18 | 0.2 | PCD | 0.8 | 75 | 74.0102 | 1.32 | 15 | 16.83145 | 10.92 | 107 | 117.142 | 9.48 |
| 8 | 120 | 0.22 | 0.2 | PCD | 0.8 | 79 | 69.9851 | 11.41 | 15 | 14.29211 | 4.72 | 181 | 187.15 | 3.40 |
| 9 | 180 | 0.14 | 0.3 | PCD | 0.8 | 60 | 57.5555 | 4.07 | 15 | 13.96145 | 3.71 | 178 | 180.948 | 1.66 |
| 10 | 60 | 0.14 | 0.4 | PCD | 0.8 | 110 | 103.692 | 5.73 | 22 | 24.65481 | 12.27 | 112 | 115.856 | 3.44 |
| 11 | 120 | 0.18 | 0.4 | PCD | 0.8 | 114 | 127.107 | 11.50 | 23 | 24.77937 | 7.74 | 185 | 179.394 | 3.03 |
| 12 | 180 | 0.22 | 0.4 | PCD | 0.8 | 132 | 124.844 | 5.42 | 24 | 23.73084 | 1.12 | 233 | 236.585 | 1.54 |

3. Results and Discussion
3.1. Effect of Variation of Machining Variables on Output Regimes
3.1.1. Effect of Variation of CS on Output Variables
Increasing the CS from 60 to 180 m/min results in a decrease in the cutting forces (Fx and Ft), as shown in Tables 2 and 3. Figure 2c illustrates that when the value of the CS increases, so does the value of the Tt.


The Al7075/FA0.9SiC0.9 composite shows maximum values of main cutting force of 147 N at CS of 60 m/min, FR of 0.22 mm/rev, DoC of 0.4 mm, and NR of 0.8 mm, with a Tt of 119°C. At 180 m/min CS, 0.14 mm/rev FR, and 0.2 mm DoC, with a corresponding Tt of 117°C, the minimum cutting force components are 34 N (Fx).
Matrix material undergoes thermal softening due to the elevated temperature along the shear plane zone. In the shear plane zone, it reduces the cutting force needed to dislodge the matrix material [23, 26]. Furthermore, Figure 2a,b demonstrates a decreasing trend in the Fx and Ft as the CS increases.
3.1.2. Effect of Variation of FR on Output Variables
The experimental findings indicate that the shear plane angle and the uncut chip thickness exhibit an increment as the FR value increases [44]. The elevation of the shear plane angle results in an augmented concentration of stress along the cutting edge and rake face, thereby leading to an escalation in the necessary shearing force within the matrix phase [45]. With an increase in FR, the cross-section and fracture resistance of the sheared chip increase, requiring more cutting forces to remove the material.
In addition, as the FR increases from 0.14 to 0.22 mm/rev, Fx, Ft, and Tt exhibit an increasing trend, as seen in Table 2 and Figures 3 and 4. The matrix phase’s plastic strain increases as the Tt rises. Increasing the FR results in an elevation of the maximum shear stress necessary for crack initiation and propagation. Consequently, this leads to an augmentation in both the cutting force and temperature.


3.1.3. Effect of Variation of DoC on Output Variables
Figure 4a demonstrates that when the value of the DoC increases, the principal cutting forces increase due to the increase in chip load. The cross-sectional area of the chip and the amount of material removed will rise as the DoC is raised. As the DoC increases, the tool will penetrate deeper into the workpiece, thereby leading to an enlarged contact area between the tool and the workpiece [23].
This raises the friction between the two surfaces, hence increasing the cutting force and temperature, as shown in Figure 4b,c. It increases resistance to deformation and fracture, requiring more forces at the tool and the workpiece interface to overcome this resistance.
In response to an increase in force value, the temperature along the interfacial region of the tool chip rises. As the DoC increases, the shear plane angle tends to increase. This effect tends to increase the cutting forces required for deformation. In Figure 4c, it is observed that an increase in the shearing plane angle and material resistance during shearing results in an upward trend in the cutting temperature.
3.1.4. Effect of Variation of Tool NR on Output Variables
The tool NR impacts the shearing of metal in turning operations. Experiments on Al7075 alloy and nanocomposite by PCD tool have been conducted considering two different NR, 0.4 and 0.8 mm. It is depicted from Figures 2, 3, and 4 that with a tool NR of 0.4 mm, the values of Fx, Ft, and Tt are less as compared to the NR of 0.8 mm. As with a tool NR of 0.4 mm, shearing stress concentrations along the tooltip and shearing plane are higher. This can lead to increased deformation and improved material flow, resulting in a better surface finish. Moreover, a larger tool NR (0.8 mm) will reduce shearing stress at the tool-workpiece interface, so higher forces are required to fracture the material. Further, a larger tool NR changes the direction of cutting forces, leading to an increase in cutting force perpendicular to the direction of cutting, which can increase the shear plane angle, which is a cause of an increase in cutting forces and temperature along the shear plane. Additionally, as the tool NR increases from 0.4 to 0.8 mm, the shear plane angle increases, which will cause an increase in the size of the chip and make it more difficult to control. A smaller NR concentrates cutting forces at the tip, while a larger NR distributes cutting forces more evenly along the cutting edge. This can reduce the risk of tool breakage and wear, but it can also result in a poor surface finish due to reduced material flow.
3.2. ANN Modeling
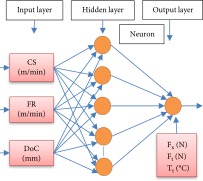
ANNs can perform mathematical mapping (regression) between input and output regimes [46]. In ANN architecture, neurons in the hidden and output layers function as information transmission sources [46]. For each link in these layers, a particular weight is assigned to improve the signal to be processed. Applying an activation function to the input signal determines the output signal of the neuron. Training NNs necessitates the selection of a suitable design, as training process efficiency and convergence are the major objectives at this stage [46]. This indicates that the training architecture is employed to ascertain the network weights necessary for establishing the input-to-output mapping. The error correction process utilizes a multilayer feed-forward network and an error-back propagation algorithm [47]. Since there is no rule for selecting the appropriate number of regulating parameters (epochs and neurons) in the hidden layer, the Levenberg–Marquardt backpropagation (LMBP) training algorithm was implemented, utilizing different configurations of neurons and epochs. The optimal values of neurons and epochs were determined to be 5 and 1000, respectively, by reducing the validation set prediction error (Tables 2 and 3). Three types of ANN layers are created: input, output, and hidden. Input factors for the machinability behavior study include CS (meters per second), FR (millimeters per revolution), and DoC (millimeters). Five neurons execute a nonlinear hyperbolic tangent function in hidden layers (tansig). One neuron is utilized in the output layer, which includes the Fx, Ft, and Tt. For training purposes, the LMBP feed-forward algorithm is used (Table 1). Comparing experimental values to those predicted by an ANN and determining the square root of the average error, the final architecture of the ANN is finalized. When the estimated mean square error hits a predefined threshold of 0.001 or when a predetermined iteration value of 1000 epochs is reached, the network training process is terminated. Initially, experimental data are classified into training and validation sets. The first group consists of the training data set (Table 2). The second group consists of the validation data set (Table 3). However, a NN model with 5 neurons and 1000 epochs is built, and training and validation run experimental values are compared.
3.2.1. Model for Main Cutting Force (Fx) for PCD Tool With Variation in Tool Geometry
It is observed from Tables 2 and 3 that the maximum percentage errors between ANN model and the experimental data for training runs of Fx of Al7075 and Al7075/FA0.9SiC0.9 vary from 0% to 0.39% and 0% to 1.89%, respectively, for PCD tool materials (0.4 and 0.8 mm NR). Table 3 illustrates the maximum percentage errors for Al7075 and Al7075/FA0.9SiC0.9 in the validation set. The range of maximum percentage errors for Al7075 is from 0.1% to 9.48%, whereas for Al7075/FA0.9SiC0.9, it ranges from 1.32% to 11.50%. For validation experiments, the regression model can predict with 88.50% accuracy. Figures 5a, 5d, 5g, 5j, 6a, and 6b depict a comparative analysis of the observed Fx values against their corresponding estimated values, utilizing a NN, for both the training and validation datasets. The resemblance between the predicted model values and the experimental values of Fx is apparent. Consequently, it is evident that a substantial concurrence exists between the estimated and observed values of Fx, thereby substantiating the models’ validity.


3.2.2. Model for Thrust Force (Ft) for PCD Tool With Variation in Tool Geometry
According to the data presented in Table 2, the maximum percentage errors observed between the experimental results and the ANN model during the training process for Ft values of Al7075 and Al7075/FA0.9SiC0.9 range from 0% to 6.40% and 0% to 7.58%, respectively. These observations were obtained when employing the PCD tool. In Table 3, the validation set reveals that the maximum percentage errors for Al7075 and Al7075/FA0.9SiC0.9 are observed to range from 0.32% to 14.54% and from 0.97% to 15.88%, respectively. Based on the training and validation experiments conducted, the regression model demonstrates predictive capabilities with an accuracy of 92.42% and 84.12%, respectively. These results indicate a strong agreement between the estimated values of cutting force and the corresponding experimental measurements. Figures 5b, 5e, 5h, 5k, 6c, and 6d) show the comparison between the experimental versus estimated values of Ft for training and validation sets obtained using a NN. The observed data demonstrate a notable resemblance between the predicted values and the experimental values of Ft. This indicates a substantial level of agreement between the estimated and observed values of Ft, thereby substantiating the validity of the models utilized.
3.2.3. Model for Tool Tip Temperature (Tt) for PCD Tool With Variation in Tool Geometry
According to the data presented in Table 2, the comparative analysis reveals that the highest percentage discrepancies between the empirical observations and ANN models for the training iterations of Tt for Al7075 and Al7075/FA0.9SiC0.9, using the PCD tool, range from 0% to 3.38% and from 0% to 0.27%, respectively.
For the validation iterations, it is perceived from Table 3 that the maximum percentage errors for Al7075, Al7075/FA0.9SiC0.9 are 0.46%–8.10% and 0.15%–9.89%, respectively. In the training and validation experiments, the regression model demonstrates predictive accuracies of 96.62% and 90.11%, respectively.
This indicates a strong correspondence between the estimated and experimentally determined cutting force values. Figures 5c, 5f, 5i, 5l, 6e, and 6f) show the comparison between the experimental versus estimated values of Tt for training and validation sets obtained using NNs.
The close proximity between the predicted values of the model and the experimental value of Tt indicates a notable correlation. Thus, it is apparent that there exists a substantial concurrence between the estimated and observed values of Tt, thereby validating the credibility of the models.
The research demonstrated that key machining parameters, including CS, FR, DoC, and tool NR, significantly influence cutting forces (Fx, Ft) and tool tip temperature (Tt) during machining processes. Specifically, an increase in CS led to a reduction in cutting forces, while tool tip temperature showed a proportional relation with CS. Both FR and DoC were found to increase cutting forces and tool tip temperature due to enhanced material removal and frictional effects. Additionally, an increase in tool NR resulted in higher forces and temperatures, attributed to the greater contact area and resistance encountered during machining. The study further utilized ANNs, utilizing the LMBP algorithm, to predict the cutting forces and tool tip temperature with high accuracy. The ANN model exhibited a strong correlation between predicted and experimental values, confirming its effectiveness for machining performance prediction. Furthermore, the research revealed that hybrid Al7075/FA0.9SiC0.9 composites required more energy for machining compared to the base Al7075 material, indicating the necessity of optimized machining strategies for composite materials. Overall, the findings emphasize the critical role of machining parameters in influencing tool performance and material behavior, highlighting the potential of ANN-based models for enhancing predictive capabilities in machining operations.
4. Conclusions
- •
The tool tip temperature exhibits an increasing trend with higher CSs, while the cutting force components (Fx and Ft) tend to decrease.
- •
An increase in FR, DoC, and tool NR leads to a corresponding rise in cutting force components and tool tip temperature.
- •
Hybrid MMCs demand higher shearing and cutting forces compared to the Al7075 alloy, indicating greater machining resistance.
- •
The developed ANN models demonstrated strong predictive performance, achieving maximum prediction accuracies of 98.11%, 92.42%, and 96.62% for Fx, Ft, and Tt, respectively, during training. For the validation set, the prediction accuracies were 88.50%, 84.12%, and 90.11% for the same parameters.
Overall, the proposed ANN-based model exhibits a high level of reliability and effectiveness in forecasting machining outcomes under varying process parameters.
Conflicts of Interest
The authors have nothing to report.
Funding
No funding was received for this manuscript.
Acknowledgments
The current study was conducted within the state-of-the-art Advanced Manufacturing Lab at the Department of Mechanical Engineering, NIT Hamirpur.
Open Research
Data Availability Statement
The data that support the findings of this study are available on request from the corresponding author. The data are not publicly available due to privacy or ethical restrictions.