Optimization Design of Nonpulsating, Equal Contact Stress Guide Curves for Internal Curve Radial Piston Motors
Abstract
To address the issues of short lifespan and high pulsation rates in existing radial piston hydraulic motors, this study focused on the design and optimization of the guide curve based on contact stress analysis. Initially, a thorough mechanical analysis and mathematical modeling of the piston rollers were conducted, taking into account friction forces. Using a six-action, eight-piston motor as a case study, the movement patterns of the pistons were extensively analyzed, and the corresponding torque was calculated. An extended acceleration zone approach was employed to develop a mathematical model of the guide curve, aimed at achieving constant contact stress without pulsation. Finally, the nondominated sorting genetic algorithm (NSGA-II) was utilized to optimize the lifespan of the guide, resulting in a guide curve that ensures a longer operational lifespan and low pulsation rate. This design method for the guide curve offers a critical reference for optimizing the design of internal curve radial piston motors, which require stringent control over both lifespan and pulsation rates.
1. Introduction
Hydraulic actuation is a crucial element in various machinery and equipment [1, 2]. Radial piston hydraulic motors are extensively utilized in hydraulic transmission systems for ships, ports, construction, and metallurgical machinery due to their high mechanical and volumetric efficiencies, as well as their ability to provide substantial torque at low speeds [3, 4]. Furthermore, these motors are recognized for their exceptional low-speed stability and minimal noise levels. Within these motors, the cam ring serves as a vital component of the internal curve motor, and the design of the guide rail’s curve is pivotal for the motor’s overall performance and durability. A poorly designed guide rail curve can result in heightened noise levels, frequent impacts, and accelerated wear, consequently diminishing the motor’s lifespan [5, 6]. The configuration of the guide rail’s curve directly impacts the trajectory of the piston roller’s movement, thereby impacting critical parameters such as the distribution of contact stress and the guide rail’s longevity.
Recent studies have extensively focused on enhancing the design of guide rail curves; however, there are still deficiencies in the existing methods. The concept of equal contact stress in guide rail curves was first introduced by Yang et al. [7]. Wang et al. and Huang et al. [8, 9] utilized the Hertz theory and force analysis of the piston subassembly to establish differential equations for determining maximum equal contact stresses. These equations were then solved using MATLAB to obtain numerical solutions for evaluating various performance aspects of the guide rails. However, these studies did not address the pulsation issues that occur during the overall motion of the pistons. Liu et al. developed a guide rail curve that could eliminate piston pulsation by considering the concept of equal contact stress. However, this analysis did not account for the friction effects, thereby restricting the practical utility of the model.
Firth and Cunningham [10] implemented a trapezoidal acceleration curve in the guide rail design to minimize the flexible impact between the roller and the guide rail, albeit leading to a slight increase in the maximum contact stress. Li and Wang [11] employed a cosine acceleration curve for the guide rail design, resulting in higher acceleration in the oil inlet zone, which elevated the contact stress at the initial curve and consequently rendered the inner side of the guide rail more susceptible to pitting and spalling. Likewise, there are designs that opt for a sinusoidal acceleration curve for the guide rail, characterized by acceleration values defined by a sine function, effectively enhancing the acceleration by π/2 compared to a constant acceleration curve. Sinusoidal acceleration curves, in comparison to cosine acceleration curves, exhibit a smaller rise near the beginning of the acceleration zone and reduced curvature, thereby effectively mitigating contact stress between guide rails. However, this design’s drawback is the generation of relatively larger pulsations.
Yu et al. [12] proposed the concept of utilizing a high-order differentiable and continuously closed curve, known as the modified cardioid, for the purpose of guide rail curve design. This approach has been effective in mitigating internal shocks within the motor system, particularly in engines with an odd number of pistons. Engines with an even number of pistons exhibit a higher pulsation rate in comparison to those with an odd number. Zhang et al. [13] employed the genetic algorithm (GA) to develop higher-order curves. The resultant guide rail curves offer seamless transitions in velocity, acceleration, reaction forces, and maximum contact stress, thereby eliminating impacts and showcasing a lower pulsation rate than the modified cardioid. However, the process of solving the associated equations is complex, and challenges related to pulsation persist.
An et al. [14] explored the impact of guide rail curve cam angle allocation on contact stress, velocity, and acceleration. The study effectively addressed issues related to the inability to allocate nonpulsating cam angles or the failure to generate zero-speed zones at low angle allocation coefficients. This development helped mitigate the design constraints of curves and prevented the shock associated with oil shut-off during flow distribution. Zhang et al. [15] developed a quasiactual mechatronic instrument capable of replicating real-world operating conditions to test roller-piston friction pairs in hydraulic motors, addressing the lack of cost-effective testing tools for wear and reliability analysis. Xin et al. [16, 17] introduced a novel design of generalized elliptical stator curves for double-ball piston hydraulic motors and performed a comprehensive analysis of the motor’s performance characteristics. Zhang et al. [18] proposed a self-compensation oil distributor (SCOD) for hydraulic motors, which reduces oil leakage and power loss by autoadjusting interface spacing through balancing pistons and floating seal sleeves, ensuring efficient operation. Gao et al. [19, 20] focused on the design and analysis of stator curves for six-action, ten-piston water hydraulic motors. Zhang et al. [21] developed a composite thermal lubrication model for hybrid journal bearings, incorporating four thermal effects and actual surface roughness, to evaluate friction and temperature characteristics under low-speed, heavy-load conditions, with experimental validation.
Given the critical importance of designing guide rail curves that ensure a long service life and eliminate pulsation in piston motors, this paper employs multiple research methodologies. Firstly, a thorough mechanical analysis and mathematical modeling of piston rollers are conducted to deeply explore the conditions for achieving equal contact stress in guide rails. Subsequently, the motion laws of hydraulic motor pistons are discussed in detail, and the torque of the piston rollers is calculated. Using a six-action, eight-piston motor as a case study, methods to eliminate torque pulsation by increasing the equal acceleration zone are examined. Ultimately, a multiobjective optimization of lifespan and torque for the nonpulsating, equal-stress guide rail curve model is performed.
The nondominated sorting genetic algorithm (NSGA-II) is a robust decision space exploration tool derived from GA framework, specifically designed for addressing multiobjective optimization problems (MOOPs) [22]. This algorithm effectively distinguishes between superior and inferior solutions by employing rapid nondominated sorting, maintains population diversity through the concept of crowding distance, incorporates an elitism strategy to improve search efficiency, and offers easily adjustable parameter settings for seamless implementation. The NSGA-II is particularly well suited for tackling complex multiobjective problems. The application of the NSGA-II in obtaining Pareto optimal solutions resulted in the development of a nonpulsating, equal-stress guide rail curve for radial piston hydraulic motors, leading to enhanced longevity and torque output. This technological development significantly advances both the theoretical understanding and practical implementation in the design of radial piston motors.
2. Equal Contact Stress Guide Rail Curve Analysis
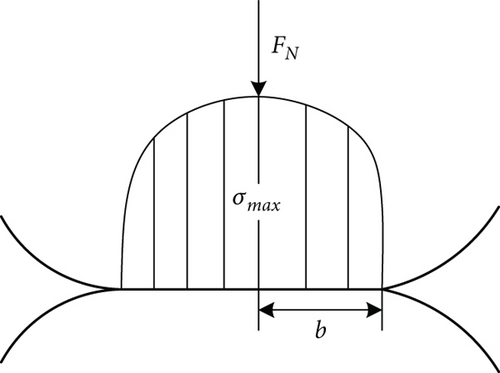
Under the impact of hydraulic pressure, the roller’s movement along the curved guide rail can lead to fluctuations in contact stress, resulting in pitting and spalling on the inner side of the guide rail. To address this issue, the study proposes dividing the guide rail curve in the oil inlet zone into two segments for design considerations. The first segment is the equal contact stress curve, which is intended to ensure consistent contact stress distribution. This design strategy is aimed at improving the wear resistance of the guide rail.
2.1. Single-Piston Contact Stress Analysis
Under the impact of the hydraulic cylinder’s propulsion, the roller travels along the curved trajectory defined by the guide rail. The guide rail applies a reaction force on the roller, inducing its rotation. The specific orientation of this force is illustrated in Figure 1.
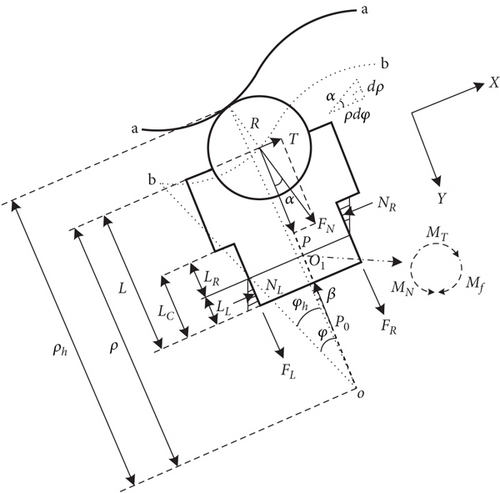
In Figure 1, the curve “a-a” represents the actual guide rail curve at the contact points between the roller and the guide rail, while the curve “b-b” represents the theoretical guide rail curve depicting the motion trajectory of the roller’s center. The theoretical guide rail curve “b-b” provides a more precise reflection of the roller’s motion state [23]. Therefore, this study primarily focuses on the theoretical guide rail curve “b-b” and derives the actual guide rail curve “a-a” through an outward extrapolation. The distance from the roller center to the rotor center ρ is referred to as the polar radius. The distance to the guide rail is ρh. The total piston length L is the distance from the roller center to the bottom of the piston, while the effective piston length LC is the part of the piston in contact with the rotor.
The main forces acting on the roller during its motion are detailed as follows:
In the simplified model of the piston roller, the piston assembly is subjected to different forces along the X- and Y-directions. Along the X-direction, it experiences the tangential component of force T and the normal pressures NR and NL on both sides. Along the Y-direction, it is subjected to the radial component of force P, friction forces FR and FL, and the hydraulic oil pressure P0 at the bottom of the piston.
2.2. Solution for Equal Contact Stress Conditions
2.3. Mathematical Modeling and Analysis
The paper uses a six-action, eight-piston radial piston hydraulic motor as a case study, presenting the initial values of the pertinent parameters in Table 1.
| Parameter | Meaning | Value |
|---|---|---|
| ρ (m) | Polar radius | 0.05622 |
| ρ′ (m/s) | Angular velocity | 0 |
| ρ″ (m/s2) | Angular acceleration | 0.142 |
| ρ‴ (m/s3) | Angular jerk | 0.005 |
| f | Coefficient of friction | 0.08 |
| LC0 (m) | Initial effective length of the piston | 0.02218 |
| L (m) | Total length of the piston | 0.031 |
| R (m) | Radius of the roller | 0.01 |
| p (Pa) | Static hydraulic pressure | 3∗107 |
| l (m) | Width of the roller | 0.02 |
| E1 (Pa) | Young’s modulus of the guide rail material | 2.16∗105 |
| 9 (Pa) | Young’s modulus of the roller material | 2.19∗105 |
| μ1 | Poisson’s ratio of the guide rail material | 0.3 |
| μ2 | Poisson’s ratio of the roller material | 0.3 |
In MATLAB, the solver for the system of differential equations based on Equations (21) and (22) should be programmed initially. Subsequently, utilizing the initial values provided in Table 1, all the necessary initial values for the system of differential equations for the equal contact stress curve should be calculated. Following this, the system of equations should be solved using MATLAB’s implicit differential equation solver ode15i, with the specified range set. The numerical solution of the curve is illustrated in Figure 3.
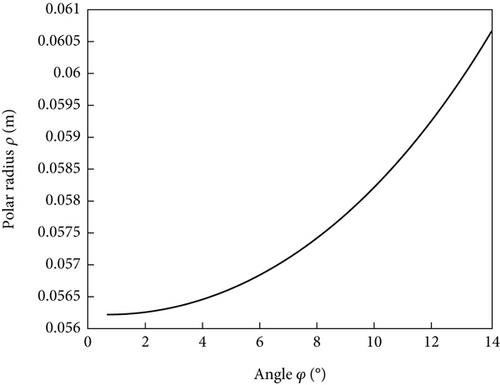
The solver ode15i’s adaptive step size setting during the solution process results in uneven angles in the numerical solution of the curve. To calculate the nonpulsating torque curve’s next step, the uniform polar radius ρ, along with its first and second derivatives (i.e., ρ′ and ρ″), is required. Initially, a fitting method is utilized to process ρ, followed by derivative operations on the fitted curve to derive ρ′ and ρ″. However, discrepancies were observed between ρ′ and ρ″ obtained from the derivative operations and the original curve. Consequently, it was decided to fit the curve ρ and its derivatives ρ′ and ρ″, separately. Through an examination of residual plots before and after fitting, it was determined that a seventh-degree polynomial offers the best fit. Figure 4 illustrates the comparison before and after the fitting process.
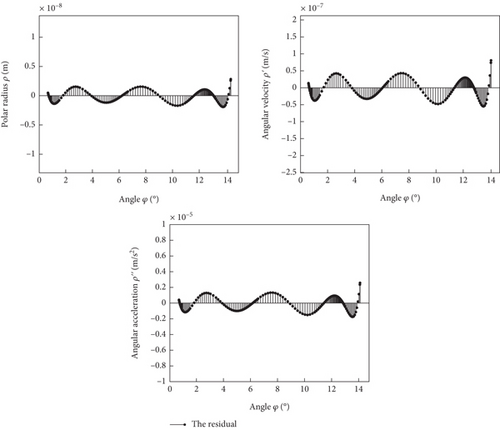
The coefficient values for the fitting equations are detailed as follows: For ρ, the coefficients of the fitting equation are 1.907, −0.982, 0.414, 0.025, 0.020, 0.066, −0.0016, and 0.056; for ρ′, the coefficients of the fitting equation are 39.5, −22.2, 7.01, −0.339, 0.346, 0.048, 0.133, and −0.001; and for ρ″, the coefficients of the fitting equation are 1113, −725, 229, −32.4, 5.52, 0.665, 0.106, and 0.133.
3. Nonpulsating Equal-Stress Guide Rail Curve Analysis
The guide rail curve in the initial section employs an equal contact stress design approach primarily to improve the wear resistance of the inner side of the guide rail. However, this guide rail curve with equal contact stress may lead to excessive torque pulsation. Consequently, in the subsequent section, the guide rail curve is formulated utilizing a no-torque-pulsation technique, which is integrated with the equal contact stress curve from the preceding section to mitigate the impact of pulsation. This design method is intended to enhance the stability of the piston motion.
3.1. Multipiston Nonpulsating Motion Strategy
Figure 5a illustrates a schematic diagram of the guide rail curve for a six-action, eight-piston radial piston hydraulic motor. In this diagram, Piston Number 1 is positioned at the initiation of the return oil zone, while Piston Number 3 is located at the commencement of the oil inlet zone. The guide rail curve is then unfolded, with the shaded zone denoting the oil inlet zone and the unshaded portion representing the return oil zone. These two zones collectively form a piston action zone, with a dimension of 2π/x. Subsequently, the positions of the pistons are distributed and depicted on the unfolded curve diagram, with each piston being separated by a distance of 2π/y (Figure 5b).
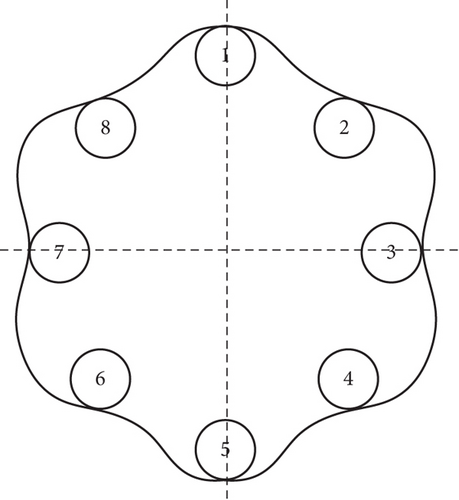

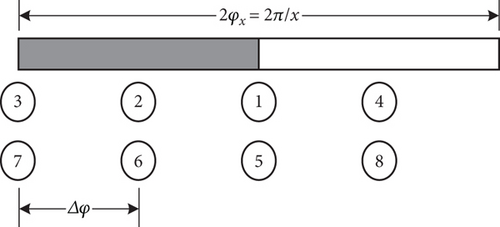
In Figure 5b, Piston Number 3 and Piston Number 7 occupy identical positions within the piston action zone. Similarly, Pistons Number 2 and Number 6, Number 1 and Number 5, and Number 4 and Number 8 are also situated at corresponding locations along the action curve. Consequently, these four pairs of pistons can be accommodated within a single action angle, with each pair separated by 2π/x/4 = 15° (Figure 5c), where Δφ is the periodic angle. When the piston motor advances by one periodic angle, all pistons revert to their initial positions. In essence, the movement of the pistons undergoes continuous variations with Δφ as the period. Therefore, this study focuses only on examining the alterations of pistons within one action angle.
Figure 6 illustrates the segmentation of the guide rail curve within a single action angle. The left side φx is the oil inlet zone, while the right side φx is the oil outlet zone, with each piston separated by Δφ. The guide rail curve is symmetrically divided within one action angle. Moving from left to right, the curve in the oil inlet zone consists of the zero-speed zone, equal contact stress zone, constant acceleration zone, pulsation compensation zone, and another zero-speed zone. As one piston reaches the beginning of the zero-speed zone, another piston is precisely positioned at the midpoint of the constant acceleration zone. Subsequently, as the former piston regresses by angular size of the zero-speed zone φ0 into the equal contact stress zone, the latter piston enters the pulsation compensation zone. When the former piston transitions from the equal contact stress zone back into the constant acceleration zone, the latter piston moves from the pulsation compensation zone to φ0. This zoning strategy ensures that pulsations in piston motion are effectively minimized.
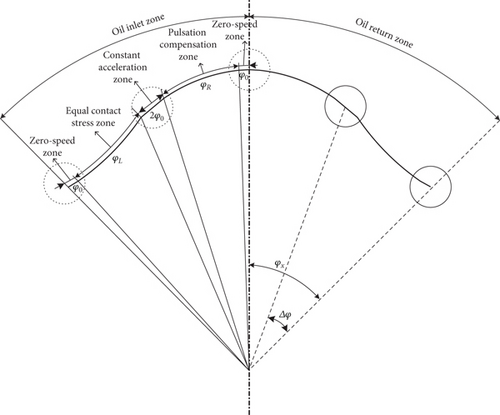
The zero-speed zone is established to prevent oil transfer occurrences when the piston transits the interface between the oil return zone and the oil inlet zone. Inadequate sizing of φ0 can result in oil crossover, while an excessively large zone may cause oil entrapment and consequential operational issues. Typically, φ0 is configured within the range of 0.5°–1.5°. In this study, φ0 is designated as 1°. Within the zero-speed zone, the guide rail curve is configured in an arc shape, ensuring that both ρ′ and ρ″ of the piston are maintained at zero within this zone.
In the equal contact stress zone, when the piston roller approaches the oil inlet position, high-pressure oil exerts force on the piston, causing it to move outward along the bore wall. In this process, ρ′ of the piston initially begins at zero and then rapidly increases, while ρ″ also starts from zero and experiences a sudden rise. Consequently, there is a significant change in the contact stress. Therefore, the area of equal contact stress plays a crucial role in determining the lifespan of the motor’s guide rail. The dimension of this zone is expressed as φx/2 − φ0 = 14°.
In the constant acceleration zone, the piston roller experiences uniform acceleration. Within this zone, ρ′ of the piston remains constant, while ρ″ is zero. This design of the curve guarantees that when the piston in this zone synchronizes with another piston in the zero-speed zone, the motion pulsation remains at zero, and the contact stress also undergoes a sudden decrease. The length of the constant acceleration zone is established as twice that of φ0, which, in this case, is set at 2°.
In the pulsation compensation zone, the piston roller experiences deceleration, causing its ρ′ to gradually decrease until it reaches zero. Consequently, the contact stress between the roller and the guide rail decreases as well. The main purpose of the pulsation compensation zone is to collaborate with the equal contact stress zone to guarantee that the pulsation in the piston’s movement remains at zero.
Within the first half of the action angle range (0, φx), the trajectory of the roller center’s motion in the zero-speed zone is symbolized as ρ0(φ). The trajectory of the roller center’s motion in the zone of equal contact stress is indicated as ρ1(φ), in the area of constant acceleration as ρ2(φ), in the pulsation compensation zone as ρ3(φ), and in the other zero-speed zone as ρ0(φ) + h.
Therefore, the trajectory of the roller center’s motion in the oil inlet zone can be depicted as Figure 7.
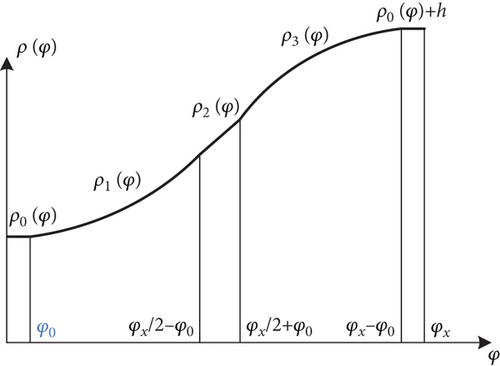
In the constant acceleration zone, the curve is depicted as a sloping straight line. At the onset of the constant acceleration zone, the polar radius and ρ′ are equivalent to those at the endpoint of the equal contact stress zone, given their adjacency.
3.2. Nonpulsating Guide Rail Curve Analysis
In Figure 5, two sets of pistons exhibiting identical motion patterns are in operation. For the purposes of this study, the initial set of pistons is chosen. In a full cycle, the sequence of pistons from left to right is as follows: Piston Number 3, Piston Number 2, Piston Number 1, and Piston Number 4 (Figure 5c). When determining the output torque, it is essential to aggregate the torque fluctuations of the pistons within the oil inlet zone.
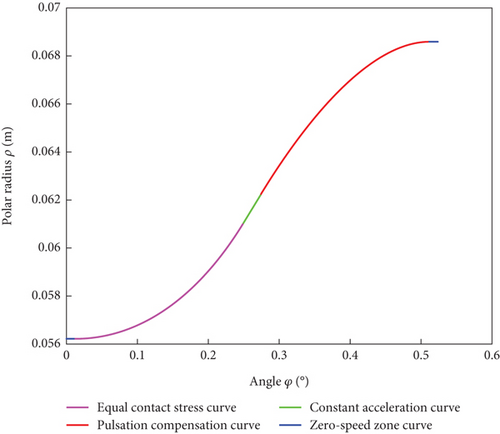
Finally, by using the ode45 solver in MATLAB, it is possible to solve the guide rail curve within the range of (φx/2 + φ0 ~ φx − φ0), which is denoted as ρ3(φ).
Therefore, this study has effectively resolved the entire theoretical curve within a half action angle (Figure 8).
3.3. Calculation and Solution of Actual Guide Rail Curves
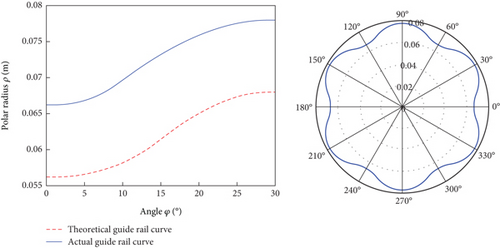
After solving in MATLAB, the representation of the actual curve can be obtained (Figure 9).
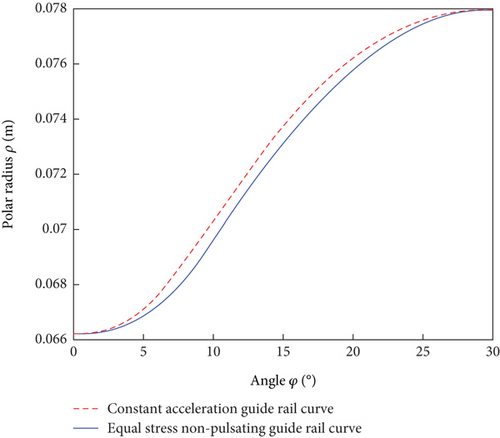
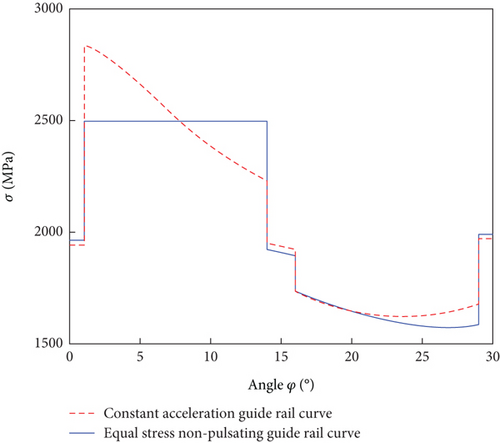
3.4. Comparison With the Constant Acceleration Guide Rail Curve
4. Multiobjective Optimization
MOOPs present challenges due to conflicting optimized objectives. Finding an optimal solution that fulfills all objectives is typically complex from a mathematical perspective. In contrast to analytical and classical numerical methods that necessitate precise mathematical computations or predetermined initial search values, intelligent optimization algorithms, as heuristic algorithms, have the capability to identify global optimal solutions [29].
When addressing multiobjective optimization challenges, it is essential to initially establish a clear definition of the design variables, objective functions, and constraints. This includes objectives such as maximizing output and minimizing costs. Subsequently, a suitable algorithm, such as GA or particle swarm optimization (PSO), should be chosen. These algorithms have the capability to produce a range of solutions that constitute a Pareto front. This front encompasses diverse optimization results within the objective space.
4.1. Multiobjective Optimization Strategy Modeling
Through the analysis of the equal-stress nonpulsating guide rail curve model, it has been determined that a reduction in ρ″ can lead to a decrease in the contact stress σ, consequently prolonging the lifespan Lh of the guide rail. However, a decrease in ρ″ may result in a reduction in the starting torque MT, thereby impacting the startup efficiency. Conversely, an increase in ρ″ has the potential to improve MT, but it also raises the contact stress σ, thereby shortening Lh. Therefore, it is imperative to strike a balance between these two factors by adjusting the parameters of the equal-stress nonpulsating guide rail curve to achieve an extended Lh and enhanced startup efficiency. While the optimization objectives of maximizing Lh and maximizing starting MT are inherently conflicting and cannot be simultaneously optimized, they can be approximated to optimal conditions through compromise and coordination. Consequently, this study introduces multiobjective optimization algorithms to approach this desired equilibrium.
Subject to:0 ≤ ρ″ ≤ 0.23, 0.5 ≤ φ0 ≤ 1.5, 392 ≤ V ≤ 408, where F1 and F2 are the lifespan and starting torque of the equal-stress nonpulsating guide rail curve, respectively, ρ″ is the angular acceleration of the guide rail curve, φ0 is the angular size of the zero-speed zone, and V is the displacement.
Since ρ″ and φ0 impact the motion stroke of the piston roller, they consequently determine the displacement of the motor, which is specified at 400 mL with a permissible error margin of ±2%.
4.2. NSGA-II Optimization
- 1.
The population is initialized, and algorithm parameters are set.
- 2.
Calculate the population’s objective values and violations, and normalize the violations.
- 3.
The population’s objective values and violations are calculated, followed by the normalization of these violations.
- 4.
Selection, crossover, and mutation are performed on the current population to generate new offspring.
- 5.
The objective values and violations of the new offspring are evaluated, and they are then merged with the parent generation to form an intermediate population.
- 6.
Nondominated sorting and crowding distance calculations are conducted on the intermediate population to select the next generation.
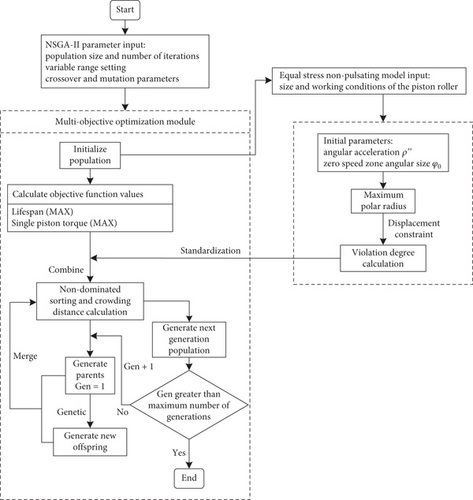
In this algorithm, the utilization of simulated binary crossover (SBX) and polynomial mutation strategies is employed. Parents are selected optimally through a binary tournament selection process to generate superior offspring effectively. The specific parameter settings for this algorithm are outlined in Table 2.
| Parameter | Value |
|---|---|
| Population size | 100 |
| Number of iterations | 300 |
| Crossover distribution index | 10 |
| Mutation distribution index | 60 |
| Mutation probability | 60 |
4.3. Optimization Results and Pareto Frontier Analysis
After the completion of the optimization algorithm, a collection of Pareto optimal solutions was derived for the equal contact stress nonpulsating guide rail curve model, considering Lh and MT. The particular Pareto front is depicted in Figure 13.
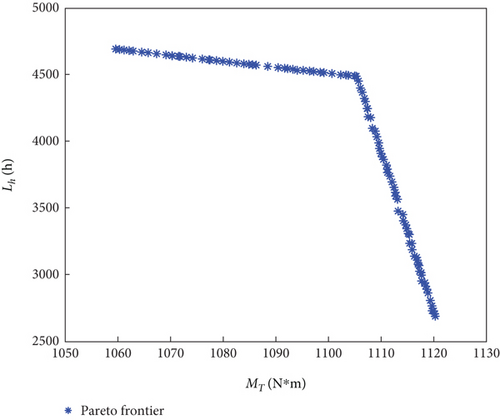
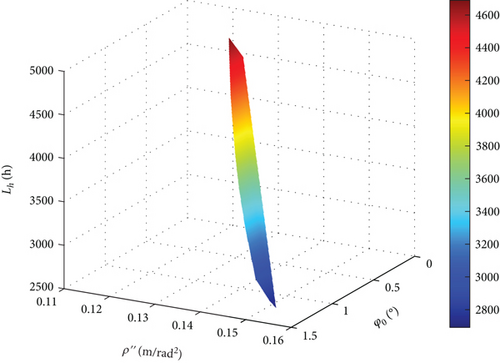
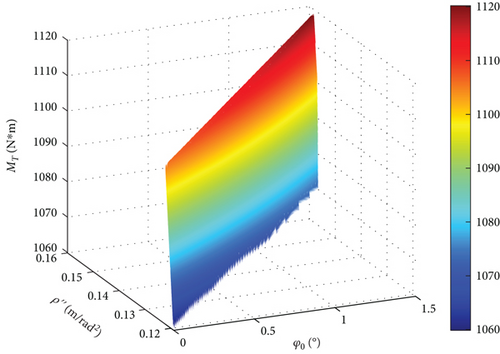
Within a zero-speed zone (Figure 14), φ0 is approximately 1.5°, leading the system to converge to a local optimum. As ρ″ decreases, the system progressively moves away from the local optimum, leading to an extended Lh, accompanied by a gradual decrease in MT.
4.4. Entropy Weighting Method for Pareto Solution Selection
The entropy weight method is a decision analysis technique rooted in the concept of information entropy. It is predominantly employed to ascertain the weights of different evaluation indicators. Information entropy serves as a statistical metric that measures the level of chaos within data. The fundamental premise is that indicators with higher variability convey more information and possess lower certainty, thereby warranting a reduced weight in the analysis as follows:
For MOOPs, the entropy weight method serves as a tool for the objective evaluation and comparison of the significance of various objectives. Consequently, it offers a rational mechanism for distributing weights in multiobjective optimization.
Based on Scorei, the optimization solution with the highest Scorei is selected. The comparison of the equal-stress nonpulsating guide rail curve parameters before and after optimization is shown in Table 3.
| Initial value | Optimized solution | ||
|---|---|---|---|
| Variable | 9 | 1 | 0.1 |
| ρ″ | 0.142 | 0.124 | |
| Objective function value | Lh | 3412 | 4370 |
| MT | 1088 | 1106 | |
Table 3 illustrates that following optimization using the NSGA-II, the optimized values satisfy the constraints. The optimized solution’s lifespan increased from 3412 to 4370 h, marking a 28% enhancement compared to the initial values. Additionally, the maximum torque per piston rose from 1088 to 1106 Nm, reflecting a 1.65% increase.
4.5. Comparison of Optimization Results
Figure 15 depicts a comparison of single-piston torque and contact stress in the oil inlet zone before and after optimization. The analysis indicates that following the optimization process, there was a negligible increase in torque, while the contact stress reduced by approximately 100 MPa. Consequently, the lifespan of the component extended by nearly 1000 h.
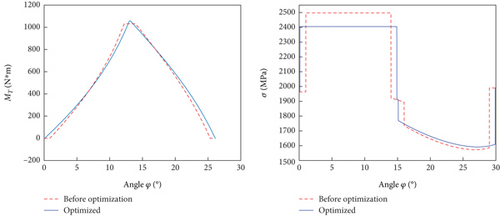
Figure 16 presents the torque generated by individual pistons as the motor rotor undergoes a 60° rotation. With the rotor’s 60° rotation, four pistons have contributed to generating torque. Analysis of the torque overlay reveals that the overall torque postoptimization has risen by 60 N·m in comparison to the preoptimization state.
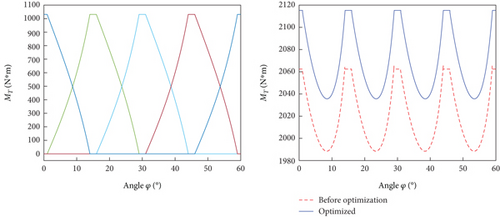
The calculation results indicate that the torque pulsation rate was δ = 3.76% before optimization and slightly increased to δ = 3.80% after optimization. This change is minimal and remains within the acceptable range of ±2%.
5. Conclusion
This paper proposes a groundbreaking guide rail curve design that integrates equal contact stress distribution and nonpulsating torque characteristics. The design effectively mitigates key issues in radial piston hydraulic motors, such as excessive pulsation and limited lifespan, paving the way for enhanced motor reliability and efficiency.
Through an in-depth analysis of piston motion and force dynamics, the study introduces a zoning strategy that incorporates zero-speed zones, equal contact stress zones, and pulsation compensation zones. This ensures stable piston motion, reduced wear, and minimized stress fluctuations.
By employing the NSGA-II, a multiobjective optimization framework was established to balance conflicting objectives, such as extending guide rail lifespan and maximizing torque output. The optimized design achieved a lifespan increase of over 28% and improved torque consistency, validating the effectiveness of the proposed approach.
This study offers a robust theoretical foundation and practical guidance for the design and optimization of internal curve radial piston motors. Its contributions are particularly valuable for high-demand applications, such as construction machinery, marine equipment, and heavy-duty hydraulic systems, where precise control and enhanced durability are critical.
Conflicts of Interest
The authors declare no conflicts of interest.
Funding
This work was supported by the National Natural Science Foundation of China (grant number 51805228), the Natural Science Research of Jiangsu Higher Education Institutions of China (grant numbers 22KJB460021, 23KJA460006), and the Changzhou Leading Innovative Talents Introduction and Cultivation Project (grant numbers CQ20210093, CQ20220089).
Open Research
Data Availability Statement
Research data are not shared.


