An Anomaly Detection System for High-Dimensional Industry Time Series Data Based on GNN and Apache Flink
Abstract
Intelligent systems have been widely used in various fields. They generate a large number of high-dimensional time series monitoring data in the process of operation, which often hide various potential abnormal conditions, which bring hidden dangers to the stable operation of the system. Existing anomaly detection methods mainly focus on the sequence characteristics of time series data, but often ignore the correlation between different variables of multivariate data, and the detection efficiency is low when facing high-dimensional time series data. To solve the above problems, we propose a deep anomaly detection method based on graph neural network, and combined with the big data computing framework Apache Flink, we construct a real-time anomaly detection system for large-scale high-dimensional time series data. Experimental results on SWaT and WADI show that our proposed method can accurately detect anomalies in multivariate time series data, and can perform low-latency real-time anomaly detection on high-dimensional industrial streaming data.
1. Introduction
In the real world, real-time monitoring of infrastructure such as aircraft, server clusters and water conservancy projects is of great significance, helping managers to keep track of the operation of large equipment and systems in a timely manner [1]. In the process of monitoring them, a large number of high-dimensional time series data will be generated to reflect their operating status. These data not only includes the information of normal operation, but also records the abnormal conditions caused by network attacks, equipment failures and other events, reflecting the problems and threats that may be encountered in the operation of the infrastructures. Therefore, timely anomaly detection of high-dimensional time series data to detect and resolve abnormal events in industrial systems and prevent potential system failures has become a major challenge [2–4].
In the past, experts set thresholds for normal events, and if the system’s measurements exceeded the threshold defined by the expert, the system was considered abnormal [5]. However, with the increase in the number and types of sensors deployed in industrial systems, the hidden correlations between different variables in the collected time series data become more complex, and the traditional threshold approach is no longer applicable in some cases. Therefore, in order to adapt to the changes of this environment and the diversity of data, it is of great significance to model the complex correlation between different variables of multivariate data and realize a more efficient and automated anomaly detection method of multivariate time series data [6].
At present, anomaly detection technology has been widely used in many industrial fields, but the research of real-time anomaly detection system is still in the development stage [7, 8]. The traditional anomaly detection system mainly adopts the method of expert setting threshold, which cannot effectively respond to the complex data relationship and dynamic changing environment, especially when dealing with high-dimensional data, its performance is limited by the breadth and depth of expert knowledge. However, in the process of monitoring large-scale systems, a large number of real-time multidimensional time series data with complex correlation will be generated. The anomaly detection system adopted needs to better handle high-dimensional, fast-flowing and real-time changing data, and ensure that the system can maintain the detection efficiency and accuracy when dealing with complex situations in industrial processes.
- 1.
We propose a deep anomaly detection method based on GNNs to solve the problem of complex correlation among variables of multivariate time series data. We improve the graph attention network to pay more attention to edge information, and add the output structure of Transformer to improve the output representation ability of graph features and make the training process more stable.
- 2.
In order to realize real-time anomaly detection on high-dimensional time series data, we design a distributed real-time anomaly detection system based on associative partitioning to solve the problem that high-dimensional data leads to low efficiency of the deep anomaly detection method proposed in this paper. This system combines the above deep anomaly detection method with big data computing framework Apache Flink to realize real-time anomaly detection of high-dimensional time series data.
- 3.
We conduct experiments on SWaT and WADI public data sets for multivariate time series anomaly detection to further evaluate the performance of the algorithm in diverse scenarios, comprehensively compare and verify the proposed anomaly detection method with multiple baseline methods, and test the designed real-time anomaly detection system. The performance and scalability of the system are verified.
2. Related Work
Traditional anomaly detection methods mainly include methods based on density, distance, linear model and classification model, such as isolated forest [9], LOF [10], OCSVM [11], etc. Traditional anomaly detection methods use statistics or machine learning technology to achieve anomaly detection. These methods are based on statistical principles and assume that data is generated from a specific distribution. However, in real-world complex data, the data distribution can change and be difficult to accurately represent with a single statistical model.
Deep learning methods have been developed in the field of anomaly detection of multivariate time series data [12–14]. The current anomaly detection based on deep learning mainly adopts prediction method or reconstruction method. The prediction method regards the anomaly score as the deviation between the observed value and the predicted value, while the reconstruction method regards the observed value deviating from the reconstructed value as the anomaly [15, 16]. Compared with traditional methods, deep anomaly detection can learn hierarchical discriminable features from large-scale complex data to achieve high-precision anomaly detection.
Reconstruction methods mainly include autoencoder [17], USAD [18], OmniAnomaly [14], etc. This kind of method maps the original data to the low-dimensional feature space, and attempts to restore the data from the low-dimensional space through the decoder to optimize the parameters of the two networks by minimizing the reconstruction loss. Since abnormal data is difficult to be accurately reconstructed by the model, the reconstruction error is large. This method uses the reconstruction error as an anomaly score to identify outliers. Prediction based methods mainly include LSTM [19], DAGMM [20], and so on. Normal data usually follows temporal dependencies well and can be easily predicted, whereas abnormal data usually violates this dependency and is unpredictable. The above deep anomaly detection methods mainly focus on the time dependence of data, that is, the trend of data change over time and the correlation between time points, but do not model the spatial structure of multivariate time series data. These methods have some limitations when applied to multivariate time series data, especially when complex spatial association structures between multiple variables are involved.
GNNs are developing rapidly in the field of anomaly detection in time series. The graph network structure can learn the relationship between different variables of multidimensional time series data, and promote the interpretability of time series tasks. GDN [12] and GTA [21] are typical representatives of anomaly detection using GNN. When using GNN to model time series, normal data will fall into a specific potential data distribution space due to the correlation of data nodes, while abnormal data will be difficult to establish connections with other data, resulting in a large distribution gap compared with normal data.
The relevant research of anomaly detection system is still in its infancy, especially in the industrial scenario for large-scale data, there are some problems that need to be solved. Existing systems, such as CADF [22], MIDS [23], and RDAD [24], are often validated on small scale or domain-specific data, so their performance and scalability in real-world applications are limited.
3. Proposed Framework
3.1. Overview
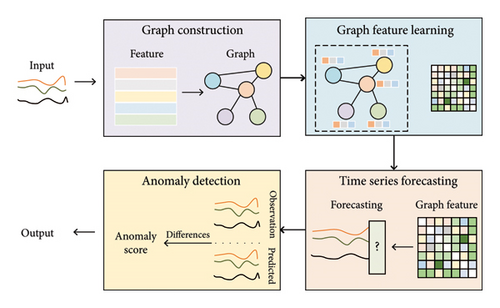
We propose an anomaly detection model based on GNNs to model the spatial structure of multivariate time series data. The overall structure of the model is shown in Figure 1, which uses the following steps to extract the spatial associations of multivariate time series data to capture the interactions among multiple variables more comprehensively and accurately: Firstly, the association graph is constructed by using cosine similarity and TopK strategy for variable features, and the graph structure is optimized by using Gumbel-Softmax sampling method. Secondly, the improved graph attention network is used to learn the features of nodes in the graph. Finally, the variable features are combined with the graph node features, and a deep prediction model is used to realize the time series prediction, and the anomaly score is calculated by comparing the error between the predicted value and the measured value.
3.2. Model Implementation
3.2.1. Graph Construction
To construct the association graph, we employ cosine similarity to measure the pairwise correlation between variables in multivariate time series data. Cosine similarity is particularly suitable for this task as it focuses on the directional alignment of variable dynamics rather than their absolute magnitude variations. In industrial scenarios, sensors may exhibit heterogeneous measurement scales or inherent noise, making amplitude-based metrics (e.g., Euclidean distance) less reliable for capturing true functional dependencies. Cosine similarity, by normalizing vectors to unit length, effectively isolates the temporal correlation patterns between variables, which is critical for identifying anomalies rooted in coordinated behavioral deviations. Furthermore, we apply the TopK strategy to retain the top k most correlated variables for each node, where k is adaptively determined based on the desired sparsity level of the correlation matrix. This step reduces computational complexity while preserving the most salient inter-variable relationships.
The number of neighbor nodes of the association graph obtained by the above way is relatively fixed, but in practical applications, the structure of the graph may change dynamically, and the number of neighbor nodes needs to be adjusted according to different scenarios. We optimize the graph structure based on the Gumbel-Softmax sampling method to hide part of the connections in the graph.
Among them, τ is a temperature parameter that controls the smoothness of Gumbel-Softmax. The smaller τ is, the more sparse the graph structure is.
The purpose of Gumbel-Softmax sampling method is to fine-tune the graph generated by the TopK strategy, balancing the stability and dynamic adaptability of graph structures. So in this study, a smaller τ value will not be selected. In the practical application process, π is chosen as the value of τ. This method offers unique advantages: compared with random pruning (which tends to lose potential correlation information) and entropy-based sampling (which relies on unstable probability thresholds), Gumbel-Softmax employs a controlled noise injection and temperature regulation mechanism to dynamically hide redundant edges while preserving critical correlations. This effectively addresses the robustness issue of multivariate time-series data distribution changes under varying industrial operating conditions.
3.2.2. Graph Feature Learning
The model uses a GNN to learn the features of the spatial association graph. By continuously iterating the transfer of node information, GNNs integrates local correlation information into global features, so as to more comprehensively understand the entire spatial structure. The obtained spatial features play a key role in better understanding the dynamic changes and associations between different data variables.
Different from the graph attention network used in the GDN [12], we propose a graph feature extraction method based on the improved graph attention network, which adds edge information to the original graph attention network, and uses the residual connection and layer normalization in Transformer as the output structure of the graph attention network to improve the representation ability of the GNNs. Suppose, at time t, the input data to the model is X(t) = [x(t − w), x(t − w + 1), …, x(t − 1)], w is the window length. Here, the component of every graph node i is .
3.2.3. Time Series Forecasting
Meanwhile, in order to further reduce the influence of the error of the spike noise type in the prediction process of the model on the anomaly detection results, this paper uses the exponential moving average method to generate smooth anomaly scores.
3.2.4. Anomaly Detection
The model realizes the judgment of abnormal data by defining a threshold, and the data output by the model with an anomaly score higher than the threshold is regarded as abnormal. Determining an appropriate anomaly threshold is challenging because it directly affects the sensitivity and accuracy of anomaly detection models. Some existing works use some dynamic outlier threshold selection algorithms based on extreme value theory, but the algorithms are complex and difficult to understand. Therefore, an easily understood threshold selection algorithm is used in this study, which takes the maximum anomaly score on the validation dataset as the threshold of the dataset.
3.3. Real-Time Anomaly Detection System
Although anomaly detection has been applied in various fields, real-time anomaly detection in the context of high-dimensional time series data is still a challenge. In the process of large-scale facility monitoring, there are often tens of thousands of sensor devices. Using deep learning methods to model time series data with high dimension will face unacceptable overhead. We design a real-time anomaly detection system based on associative partitioning, which combines the Apache Flink stream processing framework with the deep anomaly detection model described above. The design of the system aims to make full use of the advantages of Flink’s stream processing and the powerful representation learning ability of deep learning models to achieve fast and accurate anomaly detection for high-dimensional real-time data streams. Aiming at the problem of low computational efficiency of anomaly detection methods for high-dimensional data, we combine the association graph structure in anomaly detection methods and use the idea of correlation partition to reduce the computational load and improve the parallel performance of anomaly detection. At the same time, the distributed ability of Flink framework is used to realize efficient real-time anomaly detection.
3.3.1. Data Partitioning Module
The data partitioning module is responsible for classifying the original time series data to organize the data effectively and provide a distributed basis for the subsequent real-time anomaly detection module based on Flink. The partition module is divided into two stages: offline stage and online stage. In the offline stage, it mainly realizes the data partition and partition structure storage. In the online stage, the partition structure is loaded, and the real-time data stream is partitioned and delivered. Figure 2 shows the structure of the data partitioning module.
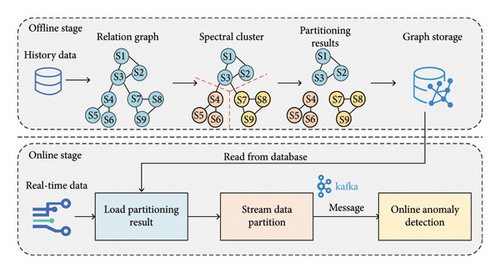
The purpose of the partitioning strategy is to divide the data nodes with strong correlation into the same partition, but the data between partitions is not strongly correlated. Firstly, a preliminary division is made according to the physical area of the data measurement points. This step helps to aggregate data points that are adjacent to the physical area together and establish physical links, which lays the foundation for subsequent processing. Secondly, in each physical area, the partition module uses the partition algorithm based on spectral clustering to partition the data measurement points. Spectral clustering is a clustering method based on graph theory and matrix characteristics, which is mainly applied to the segmentation of graph data. It maps the graph data into a low-dimensional subspace via eigenvalue decomposition of the Laplacian matrix, followed by K-means clustering in the reduced space. Spectral clustering is chosen for its ability to handle graph-structured data and preserve global structural information, which is critical for capturing cross-variable dependencies in industrial time series. The computational complexity of spectral clustering depends primarily on the eigenvalue decomposition of the Laplacian matrix (O(n3)) and the K-means iteration (O(tkn)), where n is the number of nodes, t the iterations, and k the number of clusters. To ensure efficiency, we limit the number of clusters during the initial phase and adopt a multiscale clustering strategy to dynamically adjust the granularity of partitioning based on the correlation strength. Once partitions are determined, the time series data are streamed to the Apache Flink cluster for distributed anomaly detection.
3.3.2. Anomaly Detection Module
Anomaly detection module is the key component of the system. Its main responsibility is to detect anomalies in real-time streaming data, and solve problems such as data merging and missing values processing. This module is deployed on multiple servers in a distributed Flink cluster. Through this distributed structure, the system is able to process a large amount of streaming data more efficiently in order to detect potential abnormal events in time. Figure 3 shows the structure of the anomaly detection module.
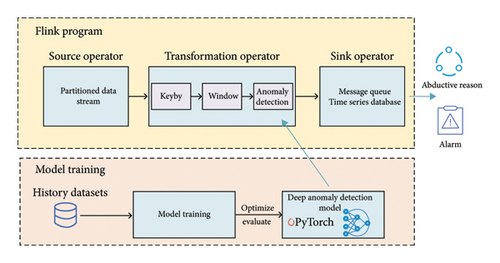
The data received by the anomaly detection module transmitted by the upstream message queue is a single-dimensional structure, in which each data is composed of timestamp, point ID and measurement value. However, the deep anomaly detection model needs to receive multidimensional data structures. Therefore, the single point data need to be aggregated into a wide table according to the timestamp, where each row represents a timestamp, and each column represents the measurement value of a point under the timestamp. We have implemented a data aggregation operator based on Flink’s window functionality to concatenate data. In the anomaly detection stage, we design a deep anomaly detection operator to realize real-time streaming data anomaly detection. This operator mainly realizes two functions in the Flink program, one is to connect the upstream data source to realize real-time anomaly detection, and the other is to connect the downstream output operator to realize the anomaly information alarm of the system.
4. Experiments
4.1. Datasets and Experiments Environment
4.1.1. Datasets
In the experiment, the multivariate time series anomaly detection public datasets SWaT and WADI are used. The SWaT dataset was collected by the iTrust laboratory in Singapore in the Water Treatment testbed. Data were acquired from 51 sensors and actuators of critical infrastructure systems under continuous operation, totaling 11 days of recordings. Among them, the normal time series data were recorded in the first 7 days as the training dataset, and in the last 4 days, the laboratory attacked the water treatment testbed and collected the time series data with abnormal conditions as the test dataset. The WADI dataset was collected from the Water Distribution System testbed as an extension of the SWaT dataset. The time series data generated by the continuous operation of the system for a total of 16 days are included, of which the regular operation for 14 days is the training set and the attack scenario for 2 days is used as the test set. The number of datasets, dimensions, and ratio of anomalies are listed in Table 1.
| Name | Dimension | Train | Test | Anomaly ratio (%) |
|---|---|---|---|---|
| SWaT | 51 | 495000 | 449919 | 11.97 |
| WADI | 123 | 784537 | 172801 | 5.99 |
4.1.2. Experiments Environment
The experiments are conducted on a Dell T5820 workstation with Windows 10 Professional operating system, 64 GB memory, Intel Xeon W-2223 3.60 GHz CPU, and a single NVIDIA GeForce RTX 4090 24 GB GPU.
4.2. Baseline
A total of four time series anomaly detection methods are used as the baseline methods of the experiment, including the traditional method IF [9], the reconstruction based method USAD [18], the prediction based method LSTM [19] and the GNN based method GDN [12]. In order to facilitate the presentation and comparison, EGAD (EGAT for anomaly detection) is used as the name of the anomaly detection method proposed in this paper.
4.3. Evaluation Metrics
4.4. Results
The experimental results on SWaT and WADI public datasets are shown in Table 2. Compared with the four baseline methods, the proposed method EGAD achieves better performance in the evaluation indicators.
| Model | SWaT | WADI | ||||
|---|---|---|---|---|---|---|
| P | R | F1 | P | R | F1 | |
| IF | 51.92 | 70.66 | 59.86 | 43.70 | 25.71 | 32.37 |
| LSTM | 91.21 | 58.60 | 71.36 | 87.86 | 27.52 | 41.91 |
| USAD | 95.49 | 58.59 | 72.62 | 93.24 | 28.26 | 43.37 |
| GDN | 98.31 | 68.25 | 80.57 | 93.50 | 43.18 | 59.08 |
| EGAD | 97.20 | 72.92 | 83.33 | 90.83 | 46.32 | 61.35 |
It can be seen from the experimental results that the detection results of all algorithm models on SWaT dataset are better than those on WADI dataset, which is because the data dimension of WADI dataset is much higher than that of SWaT dataset, and the anomaly rate is only 5.99%, which is also lower than 11.97% of SWaT. This means that the abnormal samples in the WADI dataset are sparser, and the increase of data dimension also increases the complexity of node association. The IF algorithm performs relatively poorly, especially on the WADI dataset, indicating that these traditional anomaly detection algorithms are difficult to fully capture the characteristics of the data when dealing with complex multidimensional time series data, and the EGAD method has a great improvement compared with the two. Although USAD method performs well in precision, it has a low recall rate. Compared with USAD method EGAD has 10.71% and 17.98% improvement in F1 score on SWaT and WADI, respectively. The method GDN based on GNN shows strong performance on these two datasets, but EGAD has an average increase of 2.52% in F1 score compared with GDN on the two datasets. This is because EGAD realizes dynamic graph connection and integrates side information, which can fully mine the correlation of data, so it obtains the best detection performance.
4.5. Ablation
The ablation experiment mainly verifies the influence of each functional module on the experiment, and the experimental results are shown in Table 3. In the table, w/o embedding means remove encoding module, w/o edge means remove edge encoding, w/o output means remove output structure of GAT, and w/o GAT means remove GNN. After deleting each module of the EGAD model, the anomaly detection indicators P, R, and F1 all show a decline.
| Model | SWaT | WADI | ||||
|---|---|---|---|---|---|---|
| P | R | F1 | P | R | F1 | |
| W/o embedding | 94.25 | 58.70 | 72.34 | 82.14 | 40.79 | 54.51 |
| W/o edge | 96.68 | 69.03 | 80.55 | 84.31 | 43.12 | 57.06 |
| W/o output | 96.16 | 68.48 | 79.99 | 90.56 | 42.28 | 57.65 |
| W/o GAT | 88.28 | 54.14 | 67.12 | 83.13 | 34.14 | 48.40 |
| EGAD | 97.20 | 72.92 | 83.33 | 90.83 | 46.32 | 61.35 |
4.6. Parameter Analysis
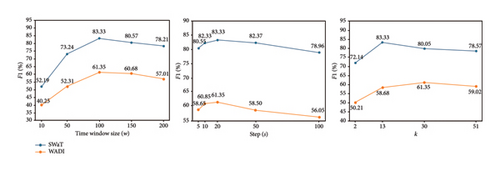
In this experiment, we mainly verify the influence of the model hyperparameters on the experimental results. We study the three main parameters of the model: the time window length w, the window step size s, and the k value of the graph TopK to explore their influence on the F1 score. Except for the above target parameters, the remaining hyperparameters remain unchanged. The experiments are conducted on both SWaT dataset and WADI dataset.
The experimental results are shown in Figure 4. On both datasets, the model performs best when the time window length is 100. When the window length is 10, the model has the worst performance, with F1 scores of 52.19% and 40.25% for SWaT and WADI datasets, respectively. This is because a shorter window length fails to capture the long-term dependencies of the system, leading to performance degradation. After the window length exceeds 100, the F1 score starts to decrease because the redundant information increases and the model becomes too focused on the historical data and ignores the current state, which leads to a decrease in detection performance. The model achieves the best performance with a window step size of 20. When the window step size is 5, the F1 scores of SWaT and WADI datasets are decreased by 2.78% and 2.70%, respectively. Due to the tighter input data, although some redundant information is brought, the time series information is well preserved, and the performance only decreases slightly. When the window step size increases to 100, the F1 scores of SWaT and WADI datasets decrease by 4.37% and 5.30%, respectively, and tend to continue to decrease, because large time span will lose a lot of timing information, leading to significant performance degradation. On the SWaT dataset, the model has the best performance when the k value is 13, and the F1 score is 83.33%. In the WADI dataset, due to its higher dimensionality, the best performance is achieved with a k value of 30, with an F1 score of 61.35%.
4.7. System Test
4.7.1. Data Generator
In view of the relatively low data dimension of current public anomaly detection datasets, it limits the comprehensive verification of the performance of anomaly detection systems. To remedy this deficiency, this study designs an efficient multidimensional data generator, which aims to simulate high-dimensional real-time streaming data in practical application scenarios. The test data is generated according to real industrial scenarios, including timestamps, point names, point values and point locations. The point values are continuous or discrete values, which are used to model sensor data and actuator data such as valves. The generator converts the data into a JSON string type and transmits it to the Kafka message queue, and the data for each measurement point is a single message.
4.7.2. Test Result
The detection efficiency of anomaly detection based on single node and anomaly detection based on real-time anomaly detection system designed in this paper is compared. In this experiment, we used the same deep anomaly detection model and tested the same amount of data. The experiment uses the data generator to generate 1000 dimensional time series data, including 1000 time points, a total of 1 million data, the data is divided into 20 partitions through the data partition module, each partition contains 50 dimensions of data, the detection input window length is 100 time points, the window step is 10. The anomaly detection method for single-machine deployment is implemented using a single machine. Figure 5 shows the time taken by both of the proposed real-time anomaly detection systems running on a Flink cluster for the same dataset.
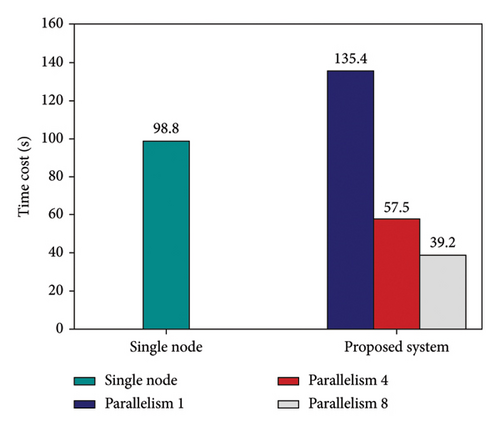
From the experimental results, the detection time is 98.8 s in the case of a single machine, while the real-time detection system based on Flink reaches 135.4 s when the parallelism is set to 1. This is because at the lowest parallelism, the performance of the system is limited by the processing power of a single computing node, and the advantages of distributed computing cannot be fully utilized. The Flink cluster introduces additional overhead, so the detection time is higher than in the standalone case. When the parallelism of the task is increased to 4, the time consumption is significantly reduced by 77.9 s compared with the parallelism of 1. This is because when the parallelism is increased, Flink can make full use of the distributed computing power of multiple nodes to improve the computing efficiency. The data partitioning strategy adopted by the system divides the data nodes into regions, which is highly consistent with the processing mode of Flink. It further promotes the improvement of data processing efficiency. When the parallelism of the real-time anomaly detection task is further increased to 8, the detection efficiency is not significantly improved, which is only 18.3 s higher than that of 4, and the improvement of system performance is limited, reaching a performance bottleneck. When using this system, the effect of parallelism setting on performance should be considered, and the best parallelism degree should be selected according to the requirements and resource situation of the specific task.
Then, the experiment evaluates the performance of the real-time anomaly detection system, mainly testing the delay and throughput of the system. These two key metrics directly affect the practicability and efficiency of the system when dealing with large-scale real-time data streams. The experimental results are shown in Figure 6.
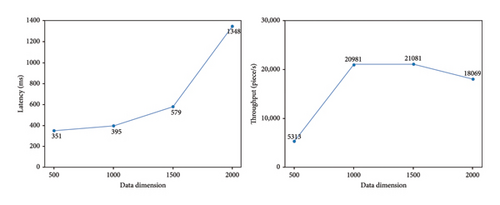
The delay of the real-time anomaly detection system increases proportionally with the growth in data dimension. Given the existing computing resources, when the data dimension is below 1500, there is no significant increase in system delay, all remaining within 1000 ms. However, when the data dimension exceeds 1500, the system latency increases significantly. This is because high-dimensional data causes computational complexity to exhibit exponential growth—such as the surge in adjacency matrix construction and attention computations in GNNs—while memory usage and distributed communication overhead simultaneously escalate. Additional computing resources are required to address this issue. From a throughput perspective, when the data dimension is less than 1000, system throughput rises alongside an increase in data dimension until reaching its peak at 1500 dimensions with a throughput exceeding 20000. However, if the data dimension exceeds 1500, throughput declines due to encountering computational bottlenecks. In practical applications, striking a balance between throughput and latency is crucial while promptly adjusting computing resources according to data scale ensures optimal performance of real-time systems.
5. Conclusions
In this work, we propose an anomaly detection system for high-dimensional industrial time-series data. In order to achieve accurate anomaly detection, we propose an anomaly detection method based on GNN. To solve the problem of low detection efficiency, we combine data partitioning and Apache Flink to implement distributed real-time anomaly detection. Future work can consider improving our proposed anomaly detection method by leveraging lightweight graph structure modeling to reduce computational complexity, integrating approximate inference algorithms to minimize real-time reasoning overhead, and utilizing heterogeneous computing acceleration strategies to enhance distributed processing efficiency. These efforts aim to break through the real-time bottleneck for high-dimensional data while maintaining detection accuracy.
Conflicts of Interest
The authors declare no conflicts of interest.
Funding
This work was supported by the National Key Research and Development Program Project (2022YFC3202600) and the Jiangsu Province Water Conservancy Science and Technology Project (2022003).
Acknowledgments
This work was supported by the National Key Research and Development Program Project (2022YFC3202600) and the Jiangsu Province Water Conservancy Science and Technology Project (2022003).
Open Research
Data Availability Statement
The data that support the findings of this study are available from the corresponding author upon reasonable request.


