Interpretable Deep Learning for Classifying Skin Lesions
Abstract
The global prevalence of skin cancer necessitates the development of AI-assisted technologies for accurate and interpretable diagnosis of skin lesions. This study presents a novel deep learning framework for enhancing the interpretability and reliability of skin lesion predictions from clinical images, which are more inclusive, accessible, and representative of real-world conditions than dermoscopic images. We comprehensively analyzed 13 deep learning models from four main convolutional neural network architecture classes: DenseNet, ResNet, MobileNet, and EfficientNet. Different data augmentation strategies and model optimization algorithms were explored to access the performances of the deep learning models in binary and multiclass classification scenarios. In binary classification, the DenseNet-161 model, initialized with random weights, obtained a top accuracy of 79.40%, while the EfficientNet-B7 model, initialized with pretrained weights from ImageNet, reached an accuracy of 85.80%. Furthermore, in the multiclass classification experiments, DenseNet121, initialized with random weights and trained with AdamW, obtained the best accuracy of 65.1%. Likewise, when initialized with pretrained weights, the DenseNet121 model attained a top accuracy of 75.07% in multiclass classification. Detailed interpretability analyses were carried out leveraging the SHAP and CAM algorithms to provide insights into the decision rationale of the investigated models. The SHAP algorithm was beneficial in understanding the feature attributions by visualizing how specific regions of the input image influenced the model predictions. Our study emphasizes using clinical images for developing AI algorithms for skin lesion diagnosis, highlighting the practicality and relevance in real-world applications, especially where dermoscopic tools are not readily accessible. Beyond accessibility, these developments also ensure that AI-assisted diagnostic tools are deployed in diverse clinical settings, thus promoting inclusiveness and ultimately improving early detection and treatment of skin cancers.
1. Introduction
Skin cancer is among the most fatal forms of cancer, with an annual report of approximately 5.4M cases in USA. Melanoma is a type of skin cancer that represents only 5% of the cases in the USA; it contributes to around 75% of fatalities, resulting in roughly 10,000 cases each year [1]. Early skin cancer detection and treatment protocols are the most recommended approach in the medical healthcare sector for curbing the fatality rate. Many cancer detection systems use deep learning (DL) algorithms for skin lesion diagnosis by proffering predictive decisions on skin cancer categories. However, some factors limit the universal acceptability of DL algorithms in some medical applications. These factors include health data poverty, lack of fairness due to model bias, and lack of DL model interpretability (black-box models). Significant progress has been recorded in advancing the utility of DL techniques for proffering skin lesion diagnosis on dermoscopic images, thereby creating effective predictive models. Although the DL models analyzed on dermoscopic images reported by the authors [2–4] yielded good model performance, a potential barrier exists in deploying these model instances, factoring dermoscopic context into mobile or smart electronic gadgets due to spatial variations in the images. An alternative approach to curb the model limitations is to embrace data collection using smartphone cameras [5]. Hence, a broader context of this article investigates interpretable DL models for predicting and localizing skin lesions, which were curated from smartphones and have diverse variations in image quality.
Previous research works have concentrated on creating a skin lesion diagnostic model while considering the dermoscopic lesion image dataset [6–9]. Some of the famous well-known dermoscopic skin lesion datasets include PH2 [10], BCN20000 [6], HAM10000 [7], and the ISIC collections [8, 9]. These datasets have played an essential role in the development of DL models for solving diverse computer vision challenges such as image classification [11–16] and segmentation [17, 18].
The research study by Cassidy et al. [19] reported a comparative analysis of DL techniques with varying convolutional neural network (CNN) configurations while assessing and analyzing articles published within the past four years. It is vital to highlight that the authors investigated undersampling scenario by removing image duplication while retaining one unique image instance and creating a balanced dataset. Their study compared their proposed models with 19 existing DL methods and demonstrated promising classification prowess in an attempt to classify melanoma. A growing interest has recently been in deploying machine learning models trained on clinical images curated from smartphones and then deployed on mobile devices to foster skin lesion diagnosis. This interest has led to the curation of the PADUFES-20 dataset [5], which investigated the benefits of transfer learning strategy when the DL architectures (GoogLeNet, VGG, residual network (ResNet), and MobileNetV3) analyze the fusion of image and clinical metadata features to create an improved skin lesion diagnostic model with an efficient multiclassification capability.
Furthermore, data augmentation (DA) schemes have been pertinent in promoting enhanced computer vision models capable of classifying or localizing clinical images. A typical DA scheme employs an algorithm for transforming an image’s spatial content; examples include rotation, illumination, color casting, cropping, and rotation matrix [20] for enhancing DL model performances. It is a known fact that dermoscopic and clinical image skin lesion datasets may experience class imbalance challenges. Hence, previous studies have experimented on the benefits of diverse DA schemes [5, 21–25] to mitigate class imbalance problems. A comprehensive study was conducted in the research article by Perez et al. [26]; their study examined the impact of 13 different augmentation schemes when attempting to assess the performance of three DL model architectures trained on dermoscopic lesion images for binary classification.
Limited or no study has explored DL model architectures, factoring in the impact of different DA schemes compared with original images in the clinical image dataset. A research study has attempted to gain intrinsic insight into model interpretability rationality. For instance, the researchers explore the use of explainable algorithms for comprehending the DL model decision-making rationality when analyzed on dermoscopic skin lesions [19].
1.1. Related Studies
Developing DL models from clinical images for skin lesion diagnosis is rapidly gaining traction. This is primarily motivated by the fact that real-time deployment of these artificial intelligence (AI)–powered systems for skin lesion diagnosis will be done on smartphone devices. Recent datasets [5, 27] collected from these smartphone devices are beginning to stimulate new research interests in the applicability of models developed from smartphone imagery for accurate and effective diagnosis of skin lesions. Researchers in [5] provided the first publicly available skin lesion dataset sourced from smartphone cameras. This effort was motivated to promote research investigations in developing computer-aided skin lesion diagnostic tools from smartphone images.
DA strategies have been reported in the literature to mitigate overfitting problems and improve the robustness of DL models by applying spatial and color distortions to images during the training phase. The effect of different DA schemes in skin lesion classification has been studied extensively by Perez et al. [26] using dermoscopic images from the ISIC 2017 archives. The work of Perez et al. [26] investigated 13 different augmentation schemes using three model architectures, namely, Inception-V4, ResNet-152, and DenseNet-161. The results from the study suggested that the optimal augmentation scenario (determined by the best AUC of 0.854, 0.882, and 0.879 for Inception-v4, ResNet, and DenseNet, respectively) for the studied dataset is a combination of random crop, affine, flip, and color jitter. Different color and geometric DA schemes were explored in [28] for the ISBI-2016 melanoma classification challenge dataset. The reported results suggested improved model performance with a combination of geometric, color, and specialist-guided dataset augmentation. The authors in [21] explored the fusion of clinical, CNN, and handcrafted features for skin lesion binary classification tasks involving identifying benign versus malignant lesions and melanoma versus nonmelanoma lesions. The study employed an online DA scheme involving small perturbations on color transformations like brightness and contrast. Geometric transformations such as vertical and horizontal flipping and random rotations between −7.2 and 7.2° were also applied to the dataset. A combined dataset was proposed in [22] to develop a mobile-based skin lesion diagnosis system by including monkeypox images in the PADUFES-20 dataset. The study evaluated the performance of small-sized pretrained networks, namely, EfficientNet-B0, EfficientNet-B7, ResNet18, GoogLeNet, MobileNet-V2, ShuffleNet, and NasnetMobile. DA schemes, including reflection, rotation, scale, and translations, were applied to the dataset simultaneously. An iterative magnitude pruning technique was proposed by Medhat et al. [24] to arrive at lightweight models based on the AlexNet architecture. This study investigated three datasets: the PADUFES-20, MED-NODE, and PH2. The DA schemes applied simultaneously on the datasets included random rotation, reflection, shear, scale, and translation.
The original curators of the PADUFES-20 dataset [5] investigated the impact of the fusion of image and clinical features to obtain improved skin lesion diagnosis in a multiclass classification task using pretrained CNN architectures, namely, GoogLeNet, VGG, ResNet, and MobileNet. The DA scheme employed included horizontal and vertical rotations, translation, rescale, shear, Gaussian noise, and blur. Color augmentations were also applied to the dataset, including brightness, contrast, saturation, and hue. However, this study did not independently investigate the effect of each of the mentioned schemes on the performance of the models. Instead, all the augmentations were applied simultaneously on the dataset. A multimodal fusion scheme was proposed in [23] for image and metadata fusion of the PADUFES-20 dataset involving intra-modality self-attention and inter-modality cross-attention. The image and clinical features were encoded independently before being passed into the intra and inter-modality attention blocks. DA schemes were applied simultaneously to the datasets, including horizontal and vertical flipping, color jittering, random contrast, and Gaussian noise.
The opaque nature of conventional DL algorithms poses a significant challenge to integrating AI solutions in medical diagnostics. These black-box models, while powerful, often lack transparency, making it difficult for clinicians to understand and trust their outputs. This lack of interpretability is a significant barrier to widespread adoption in clinical settings, where the rationale behind diagnostic decisions is as important as the decisions themselves. Enhancing the confidence and reliability of DL models in clinical workflows requires providing clear, understandable explanations for their diagnostic results. To address this challenge, explainable AI (XAI) is rapidly evolving. Researchers are actively developing methods that offer explainable and interpretable mechanisms to support the decision rationale of DL algorithms. Techniques such as SHapley Additive exPlanations (SHAP) [29–32], Local Interpretable Model-Agnostic Explanations (LIME) [33], Deep Learning Important FeaTures (DeepLIFT) [34], and Class Activation Mapping (CAM) [35–37] are among the leading approaches being explored. These methods aim to demystify how DL models arrive at their conclusions by highlighting which features or parts of the data most influence the model’s predictions. This transparency is crucial for validating and verifying AI-driven diagnostic tools.
Recent studies in medical image analysis [38–42] incorporate some interpretable schemes in their analysis to provide some intuitive information about the model’s performance. The pointing game scores [43] were used in [39] to provide quantitative interpretable measures for saliency XAI methods, including Gradient-Based Class Activation Map (GradCAM), Gradient-Based Class Activation Map PlusPlus (GradCAM++), and EigenCAM in the evaluation of DL algorithms for mammography analysis. These quantitative measures were supported by ground-truth bounding boxes, which measured the localization capabilities of these saliency methods. Explainability analysis was explored in [38] with the LIME algorithm for DL models developed from dermoscopic imagery. Due to the absence of ground-truth bounding boxes, the explainability assessment was qualitative only through heatmap visualizations. Visual explanations were discussed in [40] for DL models trained for multiclass classification on the HAM10000 [7] dataset, leveraging saliency XAI methods and layerwise feature map visualizations. The visual explanations obtained by GradCAM and LIME algorithms in [41] show alignments in interpretable assessments of a DL-based monkeypox classifier.
A comprehensive study by Cassidy et al. [19] provided benchmark results for binary and multiclass classification on dermoscopic lesion images. The performance of 19 DL models was discussed and qualitative visual explanations were provided using the GradCAM algorithm. The research investigation in this study focused particularly on the inherent issues within the datasets, especially the problem of image duplicates, and proposed a duplicate removal strategy. This study serves as a critical reference for benchmarking the performance of DL architectures on the largest archive for dermoscopic lesion images.
Optimization algorithms are essential to the learning process of DL algorithms. Popular optimization algorithms for DL models include stochastic gradient descent (SGD), Adaptive Moment Estimation (Adam), and root mean square propagation (RMSprop). The study in [44] investigated the effect of different optimization algorithms on the performance of DL models using the ISIC2018 [7] and COVIDx [45] datasets. Likewise, a comprehensive evaluation of the performance of different optimization algorithms for DL models was carried out in [46] for Indian sign language recognition. The impact of DL optimizers and their hyperparameters was also investigated in [47] for machine bearing fault diagnosis.
1.2. Motivation
Currently, to the best of our knowledge, we find that no study provides benchmark results for the performance of DL models on clinical images. Furthermore, no prior study has investigated the effect of different DA schemes on the performance of skin lesion models developed from clinical data. Likewise, we find that no study has investigated the performance of different DL model optimizers with DA schemes on the performance of skin lesion diagnosis models from clinical datasets. Furthermore, we observed limited research has been done in exploring interpretable DL models for classifying skin lesion from clinical datasets.
1.3. Contribution
- 1.
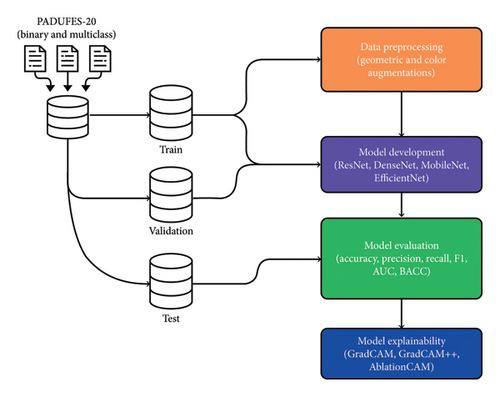
We present a new interpretable DL platform that has the prowess to predict skin lesions and localize the portion in the clinical image containing lesions (as shown in Figure 1) through an easily accessible web-based application.
- 2.
We investigated 13 DL models derived from four main neural network architectures (DenseNet, EfficientNet, MobileNetV3, and ResNet), each considering a fixed optimization scheme analyzed on binary and multiclass image datasets (without DA). We extended our analysis to improve the model performance by considering the four best model architectures; each was analyzed using five DA schemes to increase the training data size while inspecting the impact of three variants of the Adam optimizer (AdamW, Adam, and Rectified Adam (RAdam)).
- 3.
Furthermore, we investigate the benefit of using three CAM algorithms (GradCAM, GradCAM++, and Ablation Class Activation Map (AblationCAM)) and SHAP algorithm to analyze the trained DL model and identify the attention region, which influences the decisions made by the DL methods.
- 4.
Our results reveal that DenseNet architecture with an appropriate optimization scheme and selection of suitable DA protocol yielded a performance that surpassed other techniques in binary and multiclass challenges. We show that the explainable algorithms demystify the rationality behind the decisions made by the DL methods by showing the attention regions containing lesions.
- 5.
Our proposed interpretable DL system prediction and localization of skin lesions will proffer decision support to medical experts in determining the severity of lesions existing as benign or malignant or gaining insights into the subcategorization of the lesions.
Paper outline: Section 2 presents the used datasets and the data preprocessing by exploring DA techniques for increasing the number of images in training data. Section 3 describes the different DL methods investigated, explains the interpretable algorithms, briefly narrates the performance metrics for evaluating the DL models and model deployment, and highlights the experimental setups. Section 4 presents and analyzes the results obtained after training the DL models. Section 6 summarizes the lessons learned from the study and proffers research recommendations.
2. Datasets and DA
2.1. Dataset Description
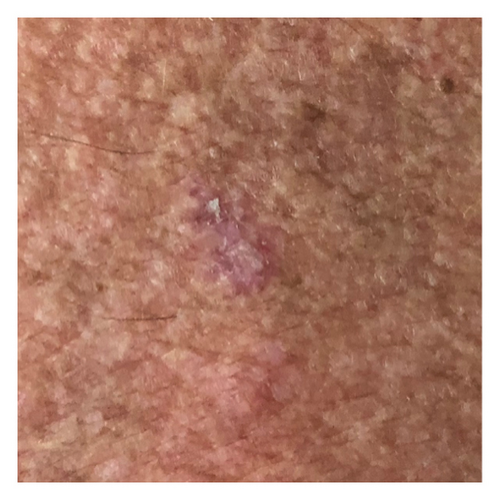
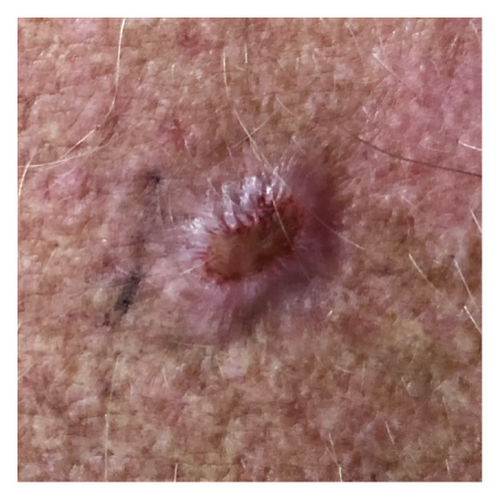
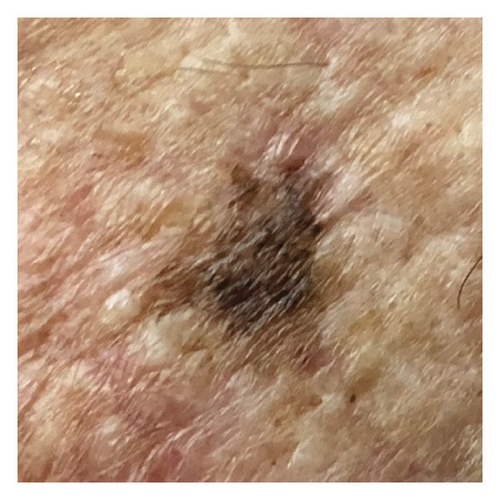
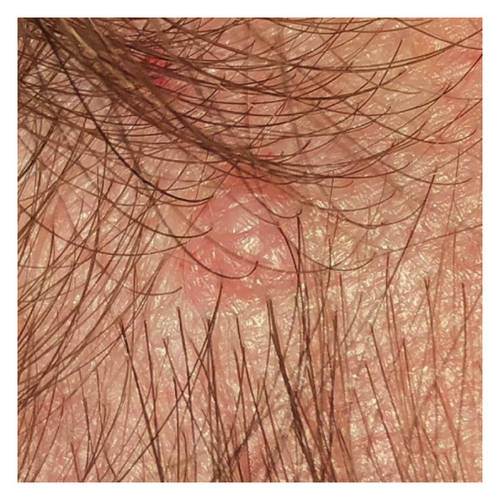
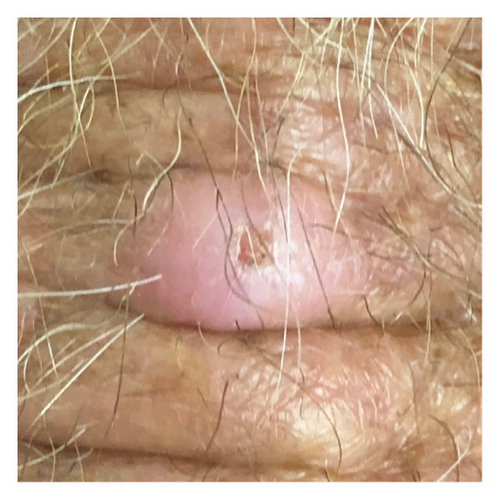
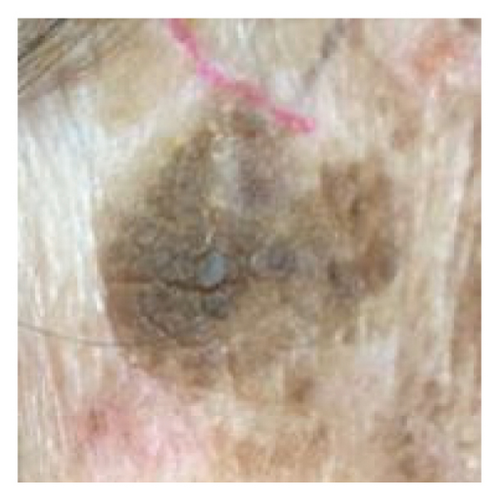
The smartphone-acquired skin lesion dataset, PADUFES-20, considered in this study [5] represents the first publicly available skin lesion data repository of dermal clinical images collected using smartphones, including patient demographics. The dataset consists of 2298 samples of six skin lesions from 1373 patients, including three malignant and three benign lesions. The malignant lesions in the dataset are basal cell carcinoma (BCC), malignant melanoma (MEL), and squamous cell carcinoma (SCC), while the benign lesions featured in the dataset are actinic keratosis (ACK), melanocytic nevus (NEV), and seborrheic keratosis (SEK). Tables 1 and 2 summarize the distributions of the skin lesions when treated as a multiclass or binary classification problem. Figure 2 [5] depicts each dataset’s skin lesion type. We investigated two kinds of clinician image datasets: binary class and multiclass. In the binary classification problem, we considered using the DL models to classify lesions as benign or malignant. Conversely, the multiclass classification problem involved using DL models to classify a lesion instance in a clinician image into one of the six classes featured in the dataset.
| Lesion type | Samples | % |
|---|---|---|
| Actinic keratosis | 730 | 31.77 |
| Basal cell carcinoma | 845 | 36.77 |
| Malignant melanoma | 52 | 2.26 |
| Melanocytic nevus | 244 | 10.62 |
| Squamous cell carcinoma | 192 | 8.36 |
| Seborrheic keratosis | 235 | 10.23 |
| Total | 2298 | 100 |
| Lesion type | Samples | Benign | Malignant | % |
|---|---|---|---|---|
| Actinic keratosis | 730 | ✔ | ✗ | 31.77 |
| Basal cell carcinoma | 845 | ✗ | ✔ | 36.77 |
| Malignant melanoma | 52 | ✗ | ✔ | 2.26 |
| Melanocytic nevus | 244 | ✔ | ✗ | 10.62 |
| Squamous cell carcinoma | 192 | ✗ | ✔ | 8.36 |
| Seborrheic keratosis | 235 | ✔ | ✗ | 10.23 |
| Total | 2298 | 1209 | 1089 | 100 |
2.2. DA
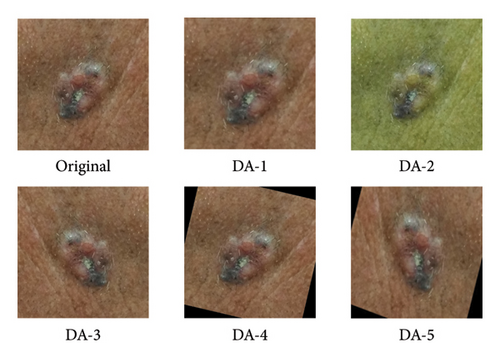
In our preliminary analysis, we observed that the used dataset was small and suffered from a class imbalance within the data distribution. Hence, we investigated five different offline DA schemes to operate on the images of the used datasets to increase the number of training examples and curb the limited training data. Note that each DA scheme factors an algorithm for generating transformed images combined with the original image to create a minimum of twice (DA-1, DA-2, DA-3, and DA-4) or quadruple (DA-5) of the original training data. Table 3 summarizes the different augmentation scenarios independently investigated for each model configuration in this study, and Figure 3 [5] depicts the examples of the augmentation scenarios.
| DA scheme | Name | Description |
|---|---|---|
| DA-1 | Random resized crop | Randomly crop the images and resize the cropped image to 224 × 224 pixels |
| DA-2 | Color jitter | Adjusting the contrast, saturation, and brightness which lies within the uniform distribution range [0, 1] and the hue was adjusted in the range [0, 0.5] |
| DA-3 | Random horizontal flip | Randomly flip the images horizontally |
| DA-4 | Random rotation | Randomly rotate the images between (−25, +25) degrees |
| DA-5 | Random horizontal flip, rotation, and resized crop | Apply schemes DA-3, DA-4, and DA-1 in that order |
3. Methodology
This section briefly explains DL methods, explores different optimization schemes and experimental setups, discusses foundational concepts about interpretable algorithms, and outlines design steps for model deployment.
3.1. DL Methods
We discuss the DL approaches, which are categorized into four primary techniques.
3.1.1. ResNet
In this context, y signifies the output of the residual block, whereas H(.) function encompasses the stacking of layers within the residual function. The input to the block is denoted by x, while θk represents the network weights for given layers within the residual block, and θs corresponds to the skip connection network weights. To determine the successive input value x are obtained by applying the ReLU activation function to the sum of the weighted outputs from the previous layers. This application of ReLU usually introduces nonlinearity into the computation process.
3.1.2. DenseNet
The inherent characteristic of the DenseNet [49] architectures relies on feature reuse and the feedforward propagation prowess that allows the learning of robust features by leveraging information from previous layers, thus resulting in a compact network with fewer network parameters. The dense connections improve the backpropagation of gradients, resulting in improved speed of convergence and training stability. The creators of the architecture proposed four distinct versions, each sharing the same fundamental principles and consisting of 4 dense blocks having variations in the connectivity levels. The intrinsic portions of the initial two blocks were kept constant across all the model variants, with the first block comprising six dense layers and the second incorporating 12 dense layers. The dense layers in all versions employ two convolutions with kernel filter of sizes 3 × 3 and 1 × 1. Conversely, the arrangement of the final two dense blocks varies across different variants of this deep learning architecture. Our research investigation concentrated mainly on the four variations of the DenseNet architectures: DenseNet-201, DenseNet-169, DenseNet-161, and DenseNet-121.
3.1.3. EfficientNet
The research study by Tan and Le [50] introduced an innovative technique for concurrently optimizing the adjustment of the network width, image resolution, and network depth. The pioneer of this technique utilized the compound scaling paradigm while introducing a distinctive set of DL architectures, denoted as EfficientNet-B0 through B7. EfficientNet is constructed from foundational models that utilize Mobile Inverted Bottleneck (MBConv) blocks. Our present investigation examined three iterations of EfficientNet (EfficientNet-B7, EfficientNet-B4, and EfficientNet-B0).
3.1.4. MobileNetV3
- 1.
MobileNetV3-L: This variant underscores the principle of maximizing accuracy while considering the limitations of resources on mobile devices. This method means MobileNetV3-Large.
- 2.
MobileNetV3-S: This variant was initially designed for devices with inadequate computational resources and employs minimal processing power and memory utility. This method refers to MobileNetV3-Small.
3.2. Model Optimizers
3.2.1. Adam
At time step t, approximates the gradients relative to the given loss function. 〈·(Wt−1) denotes the cross-entropy loss function, contingent upon the weight parameters Wt. The numerator segment of the fraction in this equation estimates the bias-corrected first moment β1, while the denominator segment approximates the bias-corrected second raw moments β2. Notably, the exponential decay rates for these moment estimates are raised to the power variable t, resulting in and , respectively. Within an Adam optimization algorithm, updates are made to the squared gradient (Vt) and the moving mean of the gradient (mt). In our preliminary experiments, we optimized the learnable weights on all the architectures (variants of ResNet, DenseNet, MobileNet, and EfficientNet) previously described in Section 3.1.
3.2.2. RAdam
In equation (3), the term inside the square root represents the variance rectification component. It is important to note that when the variance becomes tractable, ρt exceeds 4. Additionally, ηt represents an adaptive learning rate, which can be determined using the expression . Here, Vt+1 denotes an update for the estimation of the first bias moment and α accounts for the weight decay.
3.2.3. AdamW
AdamW is a stochastic optimization technique that adjusts the conventional approach to weight decay in Adam [54] by separating weight decay from the gradient update process. In Adam l2 regularization is commonly integrated using the following modification, where Wt represents the weight decay rate at time t “with the following” The weight update in AdamW is formulated as: where Wt denotes the weights at step t, η is the learning rate, mt and vt are the bias-corrected first and second moment estimates, ϵ is a small constant for numerical stability, and λ is the weight decay coefficient. This decoupling strategy improves regularization and enhances generalization performance across various deep learning tasks.
3.3. Experimental Setups
In baseline experiments for binary and multiclass classification tasks, 13 DL architectures were trained without DA. The best-performing architecture in each family was selected and retrained independently with five different augmentation schemes and three model optimizers, resulting in 60 training experiments per classification task (binary and multiclass). We trained models from scratch (using random weights) and pretrained weights (from ImageNet) for 100 epochs and 50 epochs, respectively. We utilized a train-validation-test split ratio of 70:15:15 in all the experiments conducted and we selected the model at the best epoch on the validation set in each experiment. All the images were resized to a standard size of 224 by 224 pixels. A fixed learning rate of 0.001 was adopted in all the experiments. Model training utilized a workstation equipped with an AMD Ryzen Threadripper PRO 3975WX 32-core processor (128 MB cache), three NVIDIA RTX 3090 graphics cards, 4.7 TB of storage, and 256 GB of memory.
3.4. XAI Algorithms
We explored XAI algorithms based on SHAP and three visual interpretable algorithms that rely on the principle of CAM [55]. We investigated these algorithms by assessing the trained DL models. Our main objective is to examine the prowess of the interpretable algorithms to analyze the DL techniques and pinpoint the key regions indicative of skin lesions (localization map) within the clinical medical images when attempting to predict a target class.
3.4.1. CAM
CAMs are useful for visualizing the decision rationale of DL models by producing heatmaps showing the model’s attention region for a given input image. This provides an intuition into the model’s decisions and enables researchers and end users to understand which regions of the input contribute to the classification result. CAMs are used for tasks such as object detection, image localization, and model debugging, helping to ensure the transparency and reliability of CNN-based models. Three CAM methods are considered in our study: GradCAM, GradCAM++, and AblationCAM.
3.4.1.1. GradCAM
The weight parameter computes the gradient using the formula , yc for class c represents the activation score, and B accounts for the constant (quantity of the pixels) in the feature activation map, and the activation function RELU can be computed using the formula f(x) = max(0, x), given an input feature representation (x).
3.4.1.2. GradCAM++
The weight variable can be calculated using the formula: . It is important to highlight that both GradCAM and GradCAM++ acquire their weights by linearly combining various feature maps through the backpropagation of class relevance scores.
3.4.1.3. AblationCAM
The weight variable can be determined through the formula .
3.4.2. SHAP
SHAP is an interpretability algorithm based on cooperative game theory utilizing the concept of Shapley values assigning a value for each player’s contributions in a game. The SHAP algorithm evaluates the feature contributions to the model’s output by considering all possible feature combinations and averaging the contributions to the output. In the field of XAI, the SHAP algorithm is popular due to the ability to provide global insights to model behavior. The SHAP algorithm is model agnostic and belongs to a class of additive feature attribution methods having these properties [29]: local accuracy, missingness, and consistency. The model-agnostic attribute makes it suitable for any machine learning or DL model. The SHAP algorithm is employed in our study for understanding the feature attributions of the developed models. We utilize the partition explainer function in the official SHAP API [29]. In all the explanations generated by the partition explainer, we utilized a total of 500 evaluations.
3.5. Evaluation Performance Metrics
- 1.
Accuracy: This metric assesses the effectiveness of a supervised learning algorithm to correctly predicting a specific output labels relative to all possible predictions.
() -
where αTP denotes true positives, αTN accounts for true negative, αFN represent false negative, and αFP denotes false positive.
- 2.
Balanced accuracy (BACC): BACC is a metric that evaluates classifier performance in imbalanced class scenarios by considering the accuracy of each class individually and averaging them, thus preventing bias toward the majority class, calculated as the average recall of each class, particularly valuable for datasets with significant class imbalances.
() - 3.
Precision: It is a measure that evaluates how accurately a supervised learning algorithm predicts a positive output label (class).
() - 4.
Recall (sensitivity): It is a metric that assesses how accurately a supervised learning algorithm attempts to predict true positive output labels among all possible positive samples in given data.
() - 5.
F1-Score: This metric calculates harmonic mean between precision and recall.
3.6. Model Deployment Procedure
This section outlines the stages for deploying a functional AI-driven interpretable DL system for predicting skin lesions, motivated by the research works of Hroub et al. [56].
3.6.1. Design Stage
This stage entails conceptualizing and designing the frontend and backend of the AI-based logic for our proposed interpretable DL platform capable of predicting skin lesions.
- 1.
We anticipate that a user will utilize the uploading feature to upload an image.
- 2.
We considered a situation in which, following the successful upload of a clinical image depicting a skin lesion, the user of the application chooses the desired predictive model from the available range of DL models and subsequently clicks the Predict button.
- 3.
Afterward, upon clicking the Predict button, the backend component of our application interface, which comprises the DL models and program logic, is activated to predict the target class. The results are expected to be displayed on the screen showing the level of predictive certainty along with relevant medical advice.
- 4.
Moreover, the user has the option to choose an interpretability method. Depending upon the selection of the DL model, the predicted target class, and the interpretable algorithm selected, the interactive application can generate the saliency map. This map highlights the areas of the skin lesion image that significantly impact the DL model’s decision justification.
3.6.2. Implementation Stage
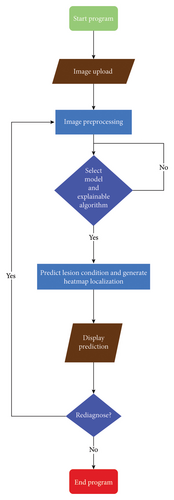
In this stage, we implemented the user interface for our proposed interpretable DL system web application. The demo web application was built on a Python web-based library, Gradio, which supports modularized coding philosophy and facilitates the speedy deployment of AI models. The DL models and explainable algorithms were developed in Python to create a software platform facilitating man–machine interaction within the AI-enabled dermatology decision support platform. Additionally, Cascading Style Sheets (CSS) were employed to design the user interface of our application. Figure 4 shows the implementation steps for the proposed system.
3.6.3. Deployment Stage
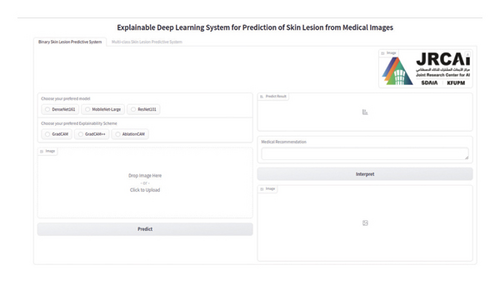
We integrated three chosen DL models (DenseNet, ResNet, and MobileNetV3) into our application program backend in this stage. The visual interface of the AI system we created is depicted in Figure 5. We deployed the developed application on a local host.
4. Results
This section extensively analyzes the DL model performances and provides interpretability insight from our newly developed explainable DL platform.
4.1. Binary Classification
4.1.1. Model Training With Random Weights
Table 4 summarizes the binary classification performance of the 13 different state-of-the-art architectures initially investigated in this study. All versions of DenseNet trained on original images surpass all other DL methodologies when assessed on the testing set (when attempting to solve the binary classification). They exhibit a performance ranging from 74.4% to 78.5% across various classification metrics such as accuracy, precision, recall, and F1-Score. The second best method concerning DL architecture is ResNet101, demonstrating notably superior performance to all instances of MobileNetV3 and EfficientNet variants. Conversely, MobileNetV3 variants exhibit the lowest performance levels. Additionally, we conducted a detailed analysis of the performance relative to each DL variant to identify the top-performing model within each architecture. Consequently, DenseNet161, ResNet101, EfficientNetB7, and MobileNetV3-L emerged as the top performers across their respective DL architectures. Therefore, we utilized the chosen DL techniques incorporating variations of the Adam optimizer (such as RAdam, Adam, and AdamW) to carry out supplementary experiments on the training set containing either original or data augmented images. We conducted additional experiments to assess whether there is potential for enhancing DL model performance factoring DA compared to DL methods, which are trained solely on original images.
| Model | Accuracy | Precision | Recall | F1 |
|---|---|---|---|---|
| DenseNet121 | 76.70 | 76.70 | 76.60 | 76.60 |
| DenseNet161 | 78.40 | 78.50 | 78.40 | 78.40 |
| DenseNet169 | 74.50 | 74.70 | 74.40 | 74.40 |
| DenseNet201 | 77.10 | 77.20 | 77.20 | 77.10 |
| ResNet-18 | 72.60 | 72.90 | 72.50 | 72.50 |
| ResNet-34 | 71.30 | 71.30 | 71.30 | 71.30 |
| ResNet-50 | 71.30 | 71.30 | 71.40 | 71.20 |
| ResNet-101 | 73.30 | 73.40 | 73.40 | 73.30 |
| MobileNetV3-S | 65.80 | 65.80 | 65.70 | 65.70 |
| MobileNetV3-L | 68.10 | 68.10 | 68.10 | 68.10 |
| EfficientNet-B0 | 68.40 | 68.40 | 68.30 | 68.20 |
| EfficientNet-B4 | 71.20 | 71.30 | 71.10 | 71.10 |
| EfficientNet-B7 | 72.00 | 72.50 | 71.90 | 71.80 |
- Note: Values shown in bold represent the highest-performing results within each model class.
The research outcomes were consolidated to gain insights into the binary classification problem, considering the optimization schemes previously described, and we subsequently trained the DL methods on the original and DA images. The results of the performance metrics (accuracy, F1-Score, and AUC) obtained after training the DL techniques and then evaluating the trained models on the testing set are summarized in Tables 5, 6, and 7. From these tables, we observed that DenseNet161 factoring at least one of the optimization schemes, considering the appropriate choice of the DA scheme, obtained the highest performance, outperforming other DL methods across the evaluated performance metrics. The DenseNet-161 architecture utilizing DA-1 and the Adam optimizer yielded the highest classification accuracy and F1-Score (79.4%), which outperformed the DenseNet161 model derived after training on original images (baseline) by a margin of 1%. To further understand the impact of the examined DA schemes, we inspect the 12 experimental scenarios: each scenario accounts (per row) for all possible experiments of a particular DL instance, factoring in one of the optimization schemes, and was trained on either original images or each of the DA schemes. Consequently, the models obtained after training were used to evaluate the testing set.
| Model | Optimizer | Original | DA-1 | DA-2 | DA-3 | DA-4 | DA-5 |
|---|---|---|---|---|---|---|---|
| Testing set | |||||||
| DenseNet161 | Adam | 78.40 | 79.40 | 67.20 | 78.80 | 76.10 | 78.40 |
| RAdam | 77.60 | 78.70 | 69.30 | 78.30 | 77.10 | 77.80 | |
| AdamW | 78.00 | 76.10 | 68.00 | 79.10 | 75.80 | 77.40 | |
| ResNet101 | Adam | 73.30 | 75.20 | 65.10 | 74.10 | 75.50 | 75.20 |
| RAdam | 71.70 | 74.80 | 66.20 | 75.90 | 75.50 | 75.40 | |
| AdamW | 74.30 | 74.10 | 64.30 | 76.20 | 74.30 | 75.10 | |
| MobileNetV3-L | Adam | 68.10 | 73.30 | 62.90 | 73.90 | 78.70 | 74.60 |
| RAdam | 63.90 | 73.50 | 57.20 | 71.00 | 76.10 | 73.80 | |
| AdamW | 66.80 | 74.80 | 63.00 | 73.90 | 75.90 | 74.90 | |
| EfficientNet-B7 | Adam | 72.00 | 75.50 | 62.30 | 73.50 | 76.10 | 75.20 |
| RAdam | 71.70 | 76.80 | 57.20 | 76.40 | 77.50 | 77.20 | |
| AdamW | 72.30 | 75.90 | 63.00 | 72.30 | 76.50 | 76.20 | |
| Validation set | |||||||
| DenseNet161 | Adam | 80.87 | 80.58 | 68.70 | 80.00 | 80.00 | 79.71 |
| RAdam | 80.00 | 81.45 | 71.01 | 81.44 | 80.57 | 82.03 | |
| AdamW | 81.16 | 80.00 | 70.14 | 80.87 | 79.71 | 80.58 | |
| ResNet101 | Adam | 77.10 | 78.20 | 68.12 | 78.84 | 80.00 | 77.39 |
| RAdam | 76.52 | 77.68 | 69.56 | 77.97 | 78.26 | 78.55 | |
| AdamW | 79.13 | 77.39 | 67.83 | 79.42 | 77.68 | 76.81 | |
| MobileNetV3-L | Adam | 71.59 | 77.97 | 66.95 | 78.26 | 79.71 | 76.52 |
| RAdam | 69.86 | 77.68 | 64.93 | 74.20 | 78.55 | 76.23 | |
| AdamW | 79.13 | 77.68 | 66.09 | 77.68 | 78.55 | 77.97 | |
| EfficientNet-B7 | Adam | 74.49 | 77.97 | 63.19 | 78.26 | 78.84 | 78.55 |
| RAdam | 76.23 | 79.71 | 62.32 | 78.55 | 80.57 | 79.71 | |
| AdamW | 74.35 | 80.57 | 66.66 | 77.97 | 80.87 | 78.84 | |
- Note: Bolded values indicate the highest-performing results across the applied DA schemes.
| Model | Optimizer | Original | DA-1 | DA-2 | DA-3 | DA-4 | DA-5 |
|---|---|---|---|---|---|---|---|
| Testing set | |||||||
| DenseNet161 | Adam | 78.40 | 79.40 | 67.20 | 78.80 | 76.10 | 78.40 |
| RAdam | 77.70 | 78.70 | 69.20 | 78.30 | 77.60 | 77.80 | |
| AdamW | 77.90 | 76.10 | 68.00 | 79.10 | 75.80 | 77.40 | |
| ResNet101 | Adam | 73.30 | 75.20 | 64.90 | 74.10 | 75.50 | 75.20 |
| RAdam | 71.70 | 74.80 | 66.20 | 75.90 | 75.50 | 75.40 | |
| AdamW | 74.30 | 74.00 | 64.00 | 76.20 | 74.30 | 75.10 | |
| MobilenetV3-L | Adam | 68.10 | 73.30 | 62.70 | 73.80 | 78.60 | 74.20 |
| RAdam | 63.00 | 73.40 | 57.20 | 71.00 | 76.00 | 73.80 | |
| AdamW | 66.80 | 74.60 | 63.00 | 73.90 | 75.90 | 74.90 | |
| EfficientNet-B7 | Adam | 71.80 | 75.40 | 62.30 | 73.50 | 75.70 | 75.20 |
| RAdam | 71.70 | 76.80 | 57.20 | 76.40 | 77.40 | 77.20 | |
| AdamW | 71.10 | 75.90 | 63.00 | 72.00 | 76.20 | 76.20 | |
| Validation set | |||||||
| DenseNet161 | Adam | 80.87 | 80.56 | 68.58 | 79.98 | 79.97 | 79.70 |
| RAdam | 80.00 | 81.38 | 70.75 | 81.44 | 80.49 | 82.00 | |
| AdamW | 81.02 | 79.93 | 70.08 | 80.86 | 79.70 | 80.58 | |
| ResNet101 | Adam | 77.09 | 78.26 | 67.74 | 78.81 | 79.90 | 77.34 |
| RAdam | 76.39 | 77.65 | 69.56 | 77.81 | 78.26 | 78.53 | |
| AdamW | 79.00 | 77.36 | 67.64 | 79.36 | 77.61 | 76.78 | |
| MobileNetV3-L | Adam | 71.57 | 77.84 | 66.72 | 78.12 | 79.57 | 76.26 |
| RAdam | 69.84 | 77.63 | 64.62 | 74.15 | 78.52 | 76.22 | |
| AdamW | 71.57 | 77.44 | 65.89 | 77.67 | 78.53 | 77.85 | |
| EfficientNet-B7 | Adam | 74.26 | 77.81 | 63.17 | 78.16 | 78.42 | 78.51 |
| RAdam | 76.23 | 79.70 | 62.32 | 78.50 | 80.41 | 79.62 | |
| AdamW | 74.31 | 80.51 | 66.63 | 77.74 | 80.51 | 78.83 | |
- Note: Bolded values indicate the highest-performing results across the applied DA schemes.
| Model | Optimizer | Original | DA-1 | DA-2 | DA-3 | DA-4 | DA-5 |
|---|---|---|---|---|---|---|---|
| Testing set | |||||||
| DenseNet161 | Adam | 85.40 | 84.00 | 71.40 | 84.90 | 85.00 | 83.60 |
| RAdam | 83.80 | 84.80 | 74.40 | 84.90 | 83.30 | 84.60 | |
| AdamW | 83.70 | 82.60 | 73.60 | 85.50 | 82.90 | 83.90 | |
| ResNet101 | Adam | 79.20 | 79.90 | 69.60 | 80.50 | 80.90 | 82.10 |
| RAdam | 77.40 | 81.80 | 69.20 | 81.50 | 81.60 | 81.30 | |
| AdamW | 79.80 | 80.00 | 69.70 | 80.70 | 81.50 | 79.30 | |
| MobileNetV3-L | Adam | 73.00 | 79.40 | 66.60 | 81.70 | 83.30 | 82.60 |
| RAdam | 66.60 | 79.90 | 64.30 | 77.00 | 81.90 | 80.00 | |
| AdamW | 70.90 | 80.60 | 63.70 | 79.30 | 82.40 | 80.50 | |
| EfficientNet-B7 | Adam | 79.60 | 82.20 | 65.30 | 78.90 | 82.10 | 82.00 |
| RAdam | 77.30 | 81.20 | 60.70 | 82.50 | 83.70 | 82.10 | |
| AdamW | 76.70 | 82.70 | 63.80 | 78.50 | 82.90 | 81.70 | |
| Validation set | |||||||
| DenseNet161 | Adam | 88.30 | 85.80 | 71.88 | 85.73 | 87.47 | 86.02 |
| RAdam | 85.05 | 86.42 | 76.12 | 86.21 | 85.61 | 87.27 | |
| AdamW | 86.42 | 85.32 | 75.74 | 86.52 | 85.23 | 86.57 | |
| ResNet101 | Adam | 82.13 | 82.03 | 73.87 | 83.99 | 84.27 | 84.84 |
| RAdam | 82.58 | 83.58 | 74.06 | 83.60 | 84.58 | 84.58 | |
| AdamW | 82.85 | 82.94 | 75.19 | 82.09 | 85.55 | 81.47 | |
| MobileNetV3-L | Adam | 77.17 | 82.17 | 70.49 | 84.82 | 85.11 | 86.31 |
| RAdam | 72.35 | 83.81 | 66.16 | 78.56 | 85.45 | 82.69 | |
| AdamW | 74.23 | 82.72 | 67.03 | 82.36 | 85.17 | 84.25 | |
| EfficientNet-B7 | Adam | 81.18 | 85.27 | 66.60 | 81.13 | 84.13 | 84.17 |
| RAdam | 83.10 | 83.03 | 63.33 | 84.75 | 86.03 | 84.52 | |
| AdamW | 78.71 | 84.23 | 66.30 | 82.26 | 84.91 | 85.35 | |
- Note: Bolded values indicate the highest-performing results across the applied DA schemes.
We report that the DA-1 scheme aided the DenseNet161 in obtaining the highest binary classification accuracy and F1-Score. Additionally, we inspected the impact of the DA across the 12 scenarios; the results show that DA-4 and DA-3 are the most influential in enhancing the DL model performance across the four main neural network architectures under study. The second competitive method is MobileNetV3-L architecture; the most favorable performance was observed with the DA-4 approach across all three optimizer types compared to all other DA schemes, while the Adam optimizer surpassed the AdamW and RAdam. Additionally, MobileNetV3-L, when trained on DA-4, significantly outperforms MobileNetV3-L when trained on the original image by a margin ≥10.3% across accuracy, F1-Score, and AUC metrics. Likewise, the best model accuracy was recorded for the EfficientNet-B7 architecture with DA-4 compared with all other model optimizers: RAdam performed slightly better than the other optimization schemes. The best models from the EfficientNet-B7 architecture outperform most variants of the ResNet101 in most of the performance evaluation metrics. After conducting experiments for the different instances of the ResNet-101 models, while considering different DA schemes and optimizers, the highest model accuracy of 76.2% was achieved with DA-3 when the ResNet101 model weights are optimized using the AdamW optimizer. In general, the ResNet-101 factoring DA-3 and DA-4 schemes yielded the best performance across the three main experimental scenarios for this architecture. However, the best-performing ResNet-101 model trained on data-augmented images still yielded poorer performance compared to most of the top-performing architectures, including DenseNet161, MobileNetV3-L, and EfficientNet-B7.
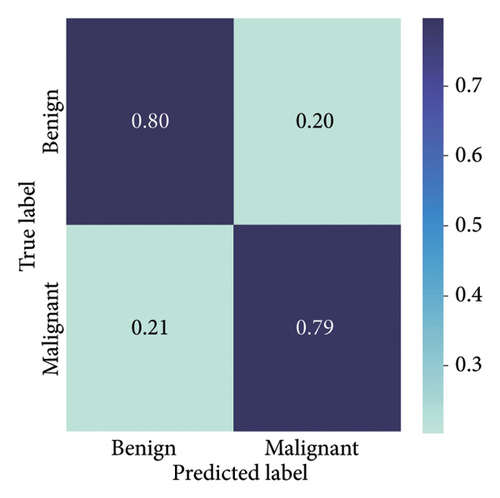
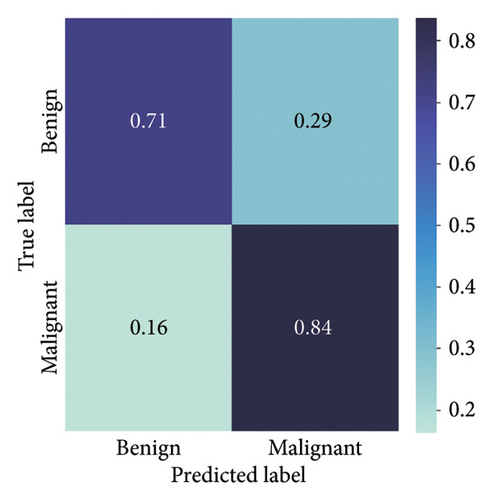
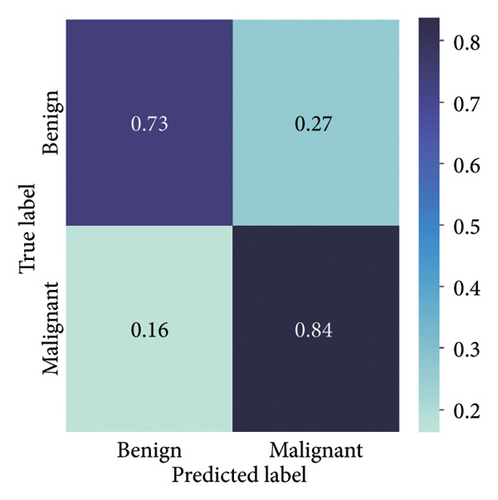
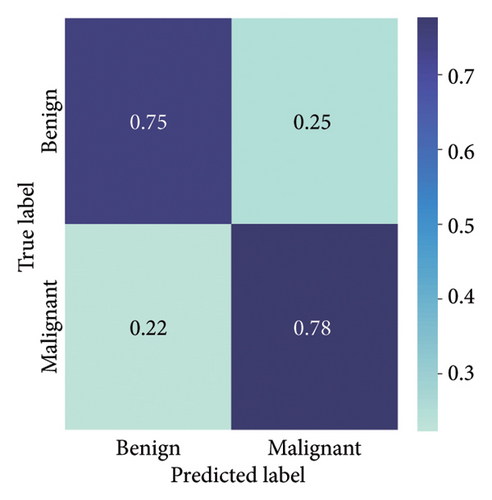
The results presented show that spatial or geometrical transformation–based DA schemes based on random rotation (DA-4), horizontal flipping (DA-3), and cropping (DA-1) can improve the binary classification performance of DL architectures that are trained on clinical skin lesion images. In most instances, the performance of these DL architectures deteriorates when color jitter DA (DA2) schemes are considered. It is vital to highlight that the random rotation (DA-4) yielded the best performances in most experiments, especially with the MobileNetV3-L and EfficientNet-B7. We underscore that some instances of DA-5, which factors DA-1, DA-3, and DA-4, often yielded decent high classification scores across the evaluated metrics. At the same time, the top-performing architecture across all the schemes and model optimizers was the DenseNet-161 architecture. These results indicate that the DA schemes considered in this study have demonstrated the potential to improve DL model performances. To better understand how the evaluated DL models predict clinical skin lesions, we illustrate the correlation between the actual output labels (ground truth) and the predicted outputs from the top-performing models using a confusion matrix, depicted in Figure 6. The figure demonstrates that DenseNet-161 exhibited the highest accuracy, correctly predicting around 548 images while making only 141 false predictions during the testing phase evaluation. In contrast, the other methods showed lower accuracy in correct predictions.
4.1.2. Training With Pretrained Weights
Additional experiments were carried out with the top-performing DL models (DenseNet161, ResNet101, MobileNetV3-L, and EfficientNetB7) which were trained using pretrained weights. Tables 8, 9, and 10 provide a summary of the testing and validation performance in terms of accuracy, F1-Score, and AUC, respectively. The stated DL models were trained using pretrained weights (from ImageNet) while considering different DA strategies and model optimizers for binary classification of skin lesions. The results demonstrate that models adopting DA-4 and DA-5 yielded superior performance, indicating that these augmentation strategies provided better variability and robustness during training, thereby allowing the models to generalize adequately to unseen data. The EfficientNet-B7 architecture (trained with DA-5 augmentation) attained a top accuracy and F1-Score of 85.80% in testing set evaluations. Likewise, the top AUC score was obtained with the EfficientNet-B7 architecture under similar training conditions in validation set evaluations. Experiments with DA-4 strategies also reveal superior classification performance for DenseNet161, ResNet101, and MobileNet-V3, with accuracy scores reaching 84.64%, 84.93%, and 84.93%, respectively, in testing set evaluations. Similar performance was recorded in the validation set with DenseNet161, ResNet101, MobileNet-V3, and EfficientNetB7 attaining accuracy scores of 86.38%, 86.09%, 86.38%, and 87.54%, respectively.
| Model | Optimizer | Original | DA-1 | DA-2 | DA-3 | DA-4 | DA-5 |
|---|---|---|---|---|---|---|---|
| Testing set | |||||||
| DenseNet161 | Adam | 81.74 | 83.19 | 81.16 | 83.48 | 83.48 | 82.90 |
| RAdam | 82.61 | 83.77 | 80.29 | 80.58 | 81.74 | 80.58 | |
| AdamW | 82.61 | 84.06 | 76.81 | 83.19 | 84.64 | 84.35 | |
| ResNet101 | Adam | 80.58 | 82.32 | 80.58 | 80.00 | 84.93 | 81.74 |
| RAdam | 81.16 | 81.16 | 80.29 | 82.90 | 82.03 | 81.16 | |
| AdamW | 83.48 | 79.71 | 80.87 | 82.90 | 84.35 | 82.32 | |
| MobileNetV3-L | Adam | 80.58 | 82.61 | 84.35 | 82.61 | 84.93 | 80.29 |
| RAdam | 79.13 | 82.90 | 80.29 | 83.48 | 80.58 | 81.45 | |
| AdamW | 82.03 | 83.48 | 82.32 | 82.61 | 83.19 | 84.06 | |
| EfficientNet-B7 | Adam | 81.16 | 82.61 | 84.35 | 82.03 | 82.90 | 85.80 |
| RAdam | 81.45 | 82.32 | 82.03 | 82.61 | 81.45 | 83.77 | |
| AdamW | 82.90 | 83.48 | 81.16 | 82.32 | 83.19 | 85.80 | |
| Validation set | |||||||
| DenseNet161 | Adam | 84.35 | 86.09 | 83.48 | 83.48 | 86.38 | 86.38 |
| RAdam | 85.22 | 84.35 | 83.48 | 80.58 | 86.38 | 85.22 | |
| AdamW | 84.06 | 83.77 | 85.22 | 83.19 | 86.09 | 85.22 | |
| ResNet101 | Adam | 85.80 | 83.77 | 84.06 | 80.00 | 85.22 | 84.93 |
| RAdam | 83.77 | 82.90 | 83.19 | 82.90 | 86.09 | 85.51 | |
| AdamW | 85.22 | 84.06 | 81.45 | 82.90 | 85.22 | 84.64 | |
| MobileNetV3-L | Adam | 83.19 | 83.77 | 83.77 | 82.61 | 86.38 | 85.22 |
| RAdam | 84.06 | 84.35 | 82.90 | 83.48 | 85.51 | 84.64 | |
| AdamW | 84.64 | 84.35 | 84.93 | 82.61 | 84.64 | 84.35 | |
| EfficientNet-B7 | Adam | 85.22 | 84.64 | 84.64 | 82.03 | 87.54 | 86.96 |
| RAdam | 84.35 | 85.51 | 83.77 | 82.61 | 86.38 | 86.96 | |
| AdamW | 84.35 | 84.64 | 86.09 | 82.32 | 87.25 | 86.96 | |
- Note: Bolded values indicate the highest-performing results across the applied DA schemes.
| Model | Optimizer | Original | DA-1 | DA-2 | DA-3 | DA-4 | DA-5 |
|---|---|---|---|---|---|---|---|
| Testing set | |||||||
| DenseNet161 | Adam | 81.73 | 83.19 | 81.16 | 83.47 | 83.47 | 82.86 |
| RAdam | 82.60 | 83.73 | 80.28 | 80.56 | 81.74 | 80.57 | |
| AdamW | 82.61 | 84.04 | 76.81 | 83.19 | 84.63 | 84.34 | |
| ResNet101 | Adam | 80.58 | 82.31 | 80.58 | 80.00 | 84.92 | 81.73 |
| RAdam | 81.08 | 81.15 | 80.25 | 82.89 | 82.03 | 81.16 | |
| AdamW | 83.48 | 79.71 | 80.87 | 82.89 | 84.35 | 82.31 | |
| MobileNetV3-L | Adam | 80.58 | 82.58 | 84.34 | 82.61 | 84.91 | 80.28 |
| RAdam | 79.13 | 82.90 | 80.29 | 83.47 | 80.58 | 81.43 | |
| AdamW | 81.97 | 83.47 | 82.32 | 82.60 | 83.19 | 84.05 | |
| EfficientNet-B7 | Adam | 81.15 | 82.57 | 84.34 | 82.03 | 82.90 | 85.80 |
| RAdam | 81.45 | 82.29 | 82.02 | 82.61 | 81.45 | 83.75 | |
| AdamW | 82.89 | 83.48 | 81.14 | 82.27 | 83.18 | 85.80 | |
| Validation set | |||||||
| DenseNet161 | Adam | 84.28 | 86.04 | 83.41 | 83.47 | 86.32 | 86.37 |
| RAdam | 85.05 | 84.33 | 83.44 | 80.56 | 86.33 | 85.19 | |
| AdamW | 84.02 | 83.71 | 85.04 | 83.19 | 86.04 | 85.20 | |
| ResNet101 | Adam | 85.77 | 83.74 | 84.00 | 80.00 | 85.18 | 84.92 |
| RAdam | 83.56 | 82.80 | 83.08 | 82.89 | 86.05 | 85.44 | |
| AdamW | 85.13 | 84.00 | 81.43 | 82.89 | 85.18 | 84.60 | |
| MobileNetV3-L | Adam | 83.17 | 83.74 | 83.65 | 82.61 | 86.30 | 85.20 |
| RAdam | 84.00 | 84.27 | 82.83 | 83.47 | 85.45 | 84.61 | |
| AdamW | 84.52 | 84.32 | 84.82 | 82.60 | 84.60 | 84.31 | |
| EfficientNet-B7 | Adam | 85.13 | 84.62 | 84.59 | 82.03 | 87.48 | 86.84 |
| RAdam | 84.32 | 85.49 | 83.70 | 82.61 | 86.32 | 86.88 | |
| AdamW | 84.31 | 84.52 | 85.97 | 82.27 | 87.13 | 86.81 | |
- Note: Bolded values indicate the highest-performing results across the applied DA schemes.
| Model | Optimizer | Original | DA-1 | DA-2 | DA-3 | DA-4 | DA-5 |
|---|---|---|---|---|---|---|---|
| Testing set | |||||||
| DenseNet161 | Adam | 89.87 | 89.48 | 89.62 | 90.12 | 90.17 | 89.81 |
| RAdam | 89.70 | 90.21 | 86.46 | 90.31 | 89.73 | 88.09 | |
| AdamW | 90.39 | 88.71 | 87.96 | 91.02 | 90.08 | 89.03 | |
| ResNet101 | Adam | 88.24 | 89.02 | 88.71 | 89.22 | 89.80 | 88.94 |
| RAdam | 88.73 | 86.61 | 88.37 | 89.65 | 87.18 | 89.14 | |
| AdamW | 88.02 | 87.52 | 89.34 | 90.12 | 91.31 | 88.92 | |
| MobileNetV3-L | Adam | 86.58 | 87.67 | 87.75 | 88.49 | 90.07 | 87.73 |
| RAdam | 86.93 | 87.46 | 87.61 | 88.36 | 89.23 | 88.39 | |
| AdamW | 88.92 | 88.69 | 86.90 | 88.17 | 88.06 | 90.05 | |
| EfficientNet-B7 | Adam | 89.93 | 90.37 | 89.20 | 89.54 | 90.69 | 90.93 |
| RAdam | 86.94 | 88.90 | 89.28 | 88.70 | 89.55 | 90.30 | |
| AdamW | 90.40 | 88.61 | 88.51 | 89.51 | 89.24 | 90.67 | |
| Validation set | |||||||
| DenseNet161 | Adam | 90.05 | 90.29 | 89.45 | 90.12 | 90.99 | 92.84 |
| RAdam | 89.63 | 89.30 | 88.84 | 90.31 | 91.59 | 91.41 | |
| AdamW | 91.70 | 89.74 | 90.37 | 91.02 | 91.93 | 91.50 | |
| ResNet101 | Adam | 90.40 | 89.76 | 91.46 | 89.22 | 92.70 | 91.02 |
| RAdam | 90.94 | 88.32 | 88.27 | 89.65 | 91.58 | 91.01 | |
| AdamW | 89.72 | 90.21 | 90.04 | 90.12 | 90.73 | 91.06 | |
| MobileNetV3-L | Adam | 89.74 | 88.38 | 90.36 | 88.49 | 92.06 | 91.70 |
| RAdam | 90.40 | 89.35 | 89.32 | 88.36 | 88.36 | 91.00 | |
| AdamW | 89.42 | 90.24 | 90.55 | 88.17 | 91.13 | 90.67 | |
| EfficientNet-B7 | Adam | 89.35 | 90.29 | 90.33 | 89.54 | 92.34 | 92.02 |
| RAdam | 90.29 | 89.64 | 90.75 | 88.70 | 92.08 | 92.23 | |
| AdamW | 88.71 | 91.21 | 92.14 | 89.51 | 92.10 | 91.84 | |
- Note: Bolded values indicate the highest-performing results across the applied DA schemes.
The choice of optimizer also significantly impacted the performances of the DL models in binary classification experiments conducted with pretrained weights. In the validation set evaluations, the EfficientNet-B7 model, trained with the Adam optimizer, attained the best AUC score of 92.34% when DA-4 strategy was considered. Conversely, in the testing set evaluations, the best AUC score of 91.02% was recorded with the DenseNet161 architecture (trained with the DA-3 strategy). While RAdam and AdamW optimizers yielded competitive performance for the models investigated, we find that when using pretrained weights, the Adam optimizer provided the most consistent results when combined with effective DA strategies.
The EfficientNet-B7 model architecture outperformed other architectures in these sets of experiments considering pretrained weights attaining binary accuracy, F1-Score, and AUC of 85.80%, 85.80%, and 90.93%, respectively, in the testing set evaluations. This architecture also demonstrates compatibility with the DA-5 augmentation strategy and the Adam optimizer. Superior performance was also recorded with the DenseNet161 and MobileNet-V3L model architectures, obtaining top accuracy of 84.64% and 84.93%, respectively, in testing set evaluations. Overall, the results obtained with pretrained models show that the combination of the Adam optimizer and DA-4/DA-5 strategies is particularly effective for the binary classification of skin lesions using clinical lesion images.
4.1.3. Statistical Analyses
A statistical comparison between the DA-1 scheme and the original dataset for DenseNet161 yielded p values of 0.95 for both the paired t-test and Welch’s t-test. We observe the statistical difference between the original (without any DA) and other DA schemes in each model architecture over different model optimizer instances. The best accuracy (79.40) was obtained with the DenseNet161 model with Adam optimizer for models trained from scratch without pretrained weights. Statistical tests were conducted using the paired t-test (12) and the Welch t-test (15) to compare the performance of the investigated models on the testing set. Conversely, with the DenseNet161 operating with the DA-3 scheme, the resulting models outperformed the case without augmentation with p values of 0.07 (paired t-test) and 0.09 (Welch t-test). The best overall accuracy with the ResNet101 model architecture was recorded with the DA-3 scheme and AdamW optimizer. Statistical comparisons of models operating DA-3 with the instance without augmentation reveal p values of 0.14 and 0.08, respectively, with the paired t-test and Welch t-test. The overall best accuracy for MobileNet-based architectures was recorded with the DA-4 scheme. Statistical comparisons here show p values of 0.007 and 0.003, respectively, in paired t-tests and Welch tests. Likewise, DA-3 (paired t-test: 0.004, Welch t-test: 0.015) and DA-5 (paired t-test: 0.014, Welch t-test: 0.017) outperformed the instance without DA for the MobileNet architecture. The DA-4 scheme produced the overall best accuracy for the Efficient-Net-B7 architecture across all the optimization algorithms. Statistical comparisons in this scenario with the instance without DA gave p values of 0.013 and 0.003 for paired and Welch t-tests, respectively. Similarly, DA-1 and DA-5 resulted in improved accuracy for EfficientNet compared with instances without data augmentation, with DA-1 yielding p values of 0.015 (paired t-test) and 0.003 (Welch’s t-test), and DA-5 yielding p values of 0.025 (paired t-test) and 0.012 (Welch’s t-test).
The DenseNet161 with pretrained weights gave an overall best accuracy of 84.64% with the DA-4 scheme and AdamW optimizer. Statistical tests measuring the performance of the pretrained DenseNet-161 across all optimizers in the DA-4 scheme against the instance without any DA gave p values of 0.404 and 0.372 for paired and Welch t-tests. Conversely, in the DA-1 scheme, which also outperformed the instance without any DA for DenseNet161, the p values obtained were 0.005 and 0.02, respectively, for paired and Welch t-tests showing significant statistical differences. The overall best accuracy (=84.93%) for the pretrained ResNet101 was obtained with the DA-4 scheme and Adam optimizer. Statistical tests comparing the ResNet101 with the DA-4 scheme and instances without DA revealed p values of 0.22 and 0.18, respectively. The MobileNetV3 architecture obtained an overall best accuracy of 84.93 with the DA-4 scheme and Adam optimizer. The statistical tests comparing the DA-4 scheme for MobileNet-V3 with the case without any DA gave p values of 0.150 and 0.211, respectively, for paired and Welch t-tests. Conversely, the MobileNet-v3 architecture also obtained accuracy values in DA1, surpassing the instance without DA. The measured p values in this instance were 0.07 and 0.09, respectively, demonstrating some statistical difference. The best overall accuracy for the pretrained EfficientNet-B7 was obtained with the DA-5 scheme. Statistical comparisons of this instance with the case without DA gave p values of 0.04 and 0.02, respectively, for paired and Welch t-tests.
4.2. Multiclass Classification
4.2.1. Training With Random Weights
Table 11 summarizes the performance of the 13 different DL architectures trained on clinical lesion images to perform multiclassification tasks. All versions of DenseNet trained on original images surpass all other DL methodologies when assessed on the testing set (when attempting to solve the binary classification). They exhibit a performance ranging from 55.4% to 57.8% across the performance classification measures (accuracy, recall, precision, and F1-Score). DenseNet models achieved BACC scores ranging from 43.1% to 46.1%. Overall, DenseNet121 was the top-ranked model in three out of five performance measures, while DenseNet201 ranked second in two out of five measures. The second best performing DL architecture is ResNet50, demonstrating notably superior performance to all instances of MobileNetV3 and EfficientNet variants. Conversely, MobileNetV3 variants exhibit the worst performance levels across all the evaluation metrics. Additionally, we conducted a detailed analysis of the performance relative to each DL variant to identify the top-performing model within each architecture. Consequently, DenseNet121, ResNet50, EfficientNetB0, and MobileNetV3-S emerged as the top performers across their respective DL architectures. Therefore, we utilized the chosen DL techniques incorporating variations of the Adam optimizer (such as RAdam, Adam, and AdamW) to carry out supplementary experiments on the training set containing either original or data-augmented images. We conducted additional experiments to assess whether there is potential for enhancing DL model performance factoring DA compared to DL methods, which are trained solely on original images.
| Model | Accuracy | Precision | Recall | F1 | BACC |
|---|---|---|---|---|---|
| DenseNet121 | 57.70 | 57.40 | 57.70 | 57.40 | 46.10 |
| DenseNet161 | 57.10 | 55.30 | 57.10 | 55.40 | 43.10 |
| DenseNet169 | 56.70 | 56.70 | 56.70 | 56.10 | 45.20 |
| DenseNet201 | 57.80 | 57.10 | 57.80 | 57.10 | 45.10 |
| ResNet-18 | 53.90 | 50.80 | 53.90 | 51.20 | 36.20 |
| ResNet-34 | 51.30 | 48.30 | 51.30 | 49.30 | 33.80 |
| ResNet-50 | 53.20 | 52.00 | 53.20 | 52.10 | 42.00 |
| ResNet-101 | 52.20 | 53.50 | 52.20 | 52.30 | 40.60 |
| EfficientNet-B0 | 45.80 | 46.70 | 45.80 | 46.00 | 35.70 |
| EfficientNet-B4 | 47.50 | 44.90 | 47.50 | 46.10 | 32.90 |
| EfficientNet-B7 | 45.70 | 44.10 | 45.80 | 44.30 | 30.70 |
| MobileNetV3-S | 43.90 | 41.30 | 43.90 | 41.60 | 29.10 |
| MobileNetV3-L | 43.30 | 40.40 | 43.30 | 41.10 | 21.90 |
- Note: Values shown in bold represent the highest-performing results within each model class.
The research outcomes were consolidated to gain insights into the multiclass classification problem, considering the optimization schemes previously described, and we subsequently trained the DL methods the original and the DA images. The results of the performance metrics (accuracy, F1-Score, and BACC) obtained after training the DL techniques and then evaluating the trained models on the testing set are summarized in Tables 12, 13, and 14. From these tables, we observed that DenseNet121 factoring at least one of the optimization schemes, considering the appropriate choice of the DA scheme, obtained the highest performance, outperforming other DL methods across the observed performance measures. The DenseNet-121 architecture factoring in AdamW optimizer and trained on DA-5 yielded the highest classification accuracy and F1-Score of 65.1% and 64.3%, respectively, which outperformed the DenseNet121 model derived after training on original images (baseline) by a significant margin of 7.4%−8.4% depending on the optimization schemes (Adam or AdamW) used in the training phase. Again, we observe that The DenseNet-121 architecture factoring in AdamW optimizer and trained on DA-5 yielded the highest BACC of (55.1%) in the testing phase. To further understand the impact of the examined DA schemes, we inspect the 12 experimental scenarios: each scenario accounts (per row) for all possible experiments of a particular DL instance, factoring in one of the optimization schemes, and was trained on either original images or each of the DA schemes. Consequently, the models obtained after training were used to evaluate the testing set.
| Model | Optimizer | Original | DA-1 | DA-2 | DA-3 | DA-4 | DA-5 |
|---|---|---|---|---|---|---|---|
| Testing set | |||||||
| DenseNet-121 | Adam | 57.70 | 63.00 | 59.90 | 62.20 | 60.90 | 60.30 |
| RAdam | 56.50 | 62.00 | 61.50 | 63.50 | 63.30 | 63.60 | |
| AdamW | 56.70 | 63.60 | 59.80 | 63.20 | 61.40 | 65.10 | |
| ResNet-50 | Adam | 53.20 | 59.00 | 53.30 | 56.40 | 59.90 | 58.00 |
| RAdam | 52.50 | 60.00 | 56.40 | 58.00 | 59.90 | 59.10 | |
| AdamW | 55.20 | 59.90 | 55.20 | 57.10 | 61.70 | 62.00 | |
| EfficientNet-B0 | Adam | 45.80 | 57.40 | 54.20 | 55.50 | 60.30 | 54.30 |
| RAdam | 46.70 | 56.70 | 49.10 | 54.20 | 58.30 | 53.50 | |
| AdamW | 45.60 | 57.80 | 51.40 | 55.90 | 55.20 | 56.50 | |
| MobileNetV3-S | Adam | 43.90 | 51.10 | 47.20 | 50.30 | 56.40 | 47.00 |
| RAdam | 45.50 | 49.00 | 47.70 | 48.80 | 53.30 | 46.50 | |
| AdamW | 43.70 | 50.90 | 48.30 | 49.10 | 56.10 | 48.30 | |
| Validation set | |||||||
| DenseNet121 | Adam | 62.32 | 67.83 | 63.19 | 66.09 | 65.80 | 64.93 |
| RAdam | 60.29 | 66.96 | 63.77 | 68.70 | 67.25 | 67.83 | |
| AdamW | 59.13 | 66.96 | 63.19 | 66.67 | 67.54 | 66.67 | |
| ResNet50 | Adam | 59.42 | 63.48 | 57.10 | 62.03 | 64.35 | 62.61 |
| RAdam | 56.23 | 62.90 | 58.84 | 64.64 | 64.35 | 60.29 | |
| AdamW | 60.00 | 63.48 | 57.10 | 64.06 | 66.38 | 62.61 | |
| MobileNetV3-S | Adam | 48.41 | 55.65 | 51.59 | 55.36 | 59.71 | 51.59 |
| RAdam | 47.54 | 54.20 | 51.59 | 52.75 | 55.36 | 51.88 | |
| AdamW | 47.54 | 55.65 | 53.04 | 53.04 | 60.29 | 52.17 | |
| EfficientNet-B0 | Adam | 51.30 | 60.29 | 57.97 | 62.32 | 65.51 | 58.26 |
| RAdam | 51.01 | 60.87 | 55.36 | 59.13 | 62.90 | 59.42 | |
| AdamW | 51.30 | 62.61 | 57.39 | 59.42 | 62.03 | 59.42 | |
- Note: Bolded values indicate the highest-performing results across the applied DA schemes.
| Model | Optimizer | Original | DA-1 | DA-2 | DA-3 | DA-4 | DA-5 |
|---|---|---|---|---|---|---|---|
| Testing set | |||||||
| DenseNet121 | Adam | 57.40 | 61.30 | 57.20 | 60.70 | 59.40 | 60.20 |
| RAdam | 54.50 | 60.50 | 58.70 | 61.70 | 60.90 | 61.90 | |
| AdamW | 55.10 | 62.70 | 57.20 | 61.60 | 59.90 | 64.30 | |
| ResNet-50 | Adam | 52.10 | 58.50 | 52.90 | 54.90 | 56.00 | 57.70 |
| RAdam | 51.50 | 59.20 | 53.60 | 56.20 | 57.80 | 59.30 | |
| AdamW | 54.60 | 57.90 | 52.70 | 56.00 | 59.30 | 61.70 | |
| EfficientNet-B0 | Adam | 46.00 | 57.10 | 51.80 | 54.60 | 58.80 | 53.70 |
| RAdam | 45.40 | 56.40 | 47.30 | 52.50 | 57.60 | 54.40 | |
| AdamW | 45.30 | 57.30 | 50.50 | 54.20 | 53.90 | 56.80 | |
| MobileNetV3-S | Adam | 41.60 | 50.90 | 44.50 | 46.60 | 55.40 | 48.60 |
| RAdam | 44.00 | 49.40 | 45.40 | 45.70 | 53.30 | 47.40 | |
| AdamW | 41.70 | 51.30 | 46.30 | 46.80 | 55.10 | 48.90 | |
| Validation set | |||||||
| DenseNet121 | Adam | 45.91 | 50.05 | 43.59 | 47.76 | 52.46 | 50.48 |
| RAdam | 43.19 | 48.54 | 44.71 | 51.00 | 48.21 | 50.51 | |
| AdamW | 43.23 | 49.67 | 43.59 | 53.14 | 50.62 | 54.37 | |
| ResNet50 | Adam | 46.37 | 47.22 | 45.48 | 47.40 | 47.20 | 51.71 |
| RAdam | 39.42 | 47.27 | 42.24 | 45.02 | 46.60 | 46.10 | |
| AdamW | 45.47 | 46.47 | 37.68 | 47.83 | 46.41 | 50.64 | |
| MobileNetV3-S | Adam | 31.02 | 43.79 | 36.34 | 41.80 | 41.56 | 42.51 |
| RAdam | 38.38 | 41.26 | 37.50 | 34.28 | 42.41 | 38.71 | |
| AdamW | 34.29 | 42.89 | 39.80 | 34.60 | 43.40 | 40.85 | |
| EfficientNet-B0 | Adam | 40.60 | 48.61 | 42.06 | 47.29 | 48.33 | 41.78 |
| RAdam | 33.34 | 48.54 | 36.33 | 40.89 | 46.30 | 47.40 | |
| AdamW | 36.30 | 47.70 | 42.42 | 40.24 | 45.96 | 49.27 | |
- Note: Bolded values indicate the highest-performing results across the applied DA schemes.
| Model | Optimizer | Original | DA-1 | DA-2 | DA-3 | DA-4 | DA-5 |
|---|---|---|---|---|---|---|---|
| Testing set | |||||||
| DenseNet-121 | Adam | 46.10 | 49.30 | 42.30 | 45.30 | 48.00 | 48.10 |
| RAdam | 42.30 | 47.60 | 43.70 | 47.90 | 46.50 | 48.90 | |
| AdamW | 41.80 | 49.50 | 42.30 | 49.80 | 44.80 | 55.10 | |
| ResNet-50 | Adam | 42.00 | 48.20 | 40.50 | 40.70 | 43.30 | 49.60 |
| RAdam | 39.60 | 48.50 | 40.40 | 41.60 | 43.50 | 49.10 | |
| AdamW | 43.10 | 46.10 | 38.50 | 41.70 | 44.50 | 52.00 | |
| EfficientNet-B0 | Adam | 35.70 | 46.90 | 38.40 | 41.70 | 46.50 | 43.20 |
| RAdam | 31.40 | 46.50 | 32.10 | 37.30 | 44.60 | 46.80 | |
| AdamW | 31.10 | 45.80 | 38.50 | 40.30 | 41.60 | 47.90 | |
| MobilenetV3-S | Adam | 29.10 | 40.30 | 32.90 | 33.70 | 42.30 | 40.80 |
| RAdam | 33.90 | 39.70 | 33.90 | 31.30 | 42.20 | 38.60 | |
| AdamW | 33.10 | 42.60 | 33.30 | 32.60 | 43.10 | 40.60 | |
| Validation set | |||||||
| DenseNet121 | Adam | 46.93 | 48.71 | 43.93 | 47.33 | 51.73 | 49.95 |
| RAdam | 43.46 | 49.82 | 45.02 | 50.67 | 46.60 | 50.48 | |
| AdamW | 42.45 | 49.54 | 43.93 | 51.31 | 48.76 | 53.45 | |
| ResNet50 | Adam | 46.69 | 49.21 | 46.40 | 46.93 | 46.11 | 52.94 |
| RAdam | 39.73 | 48.28 | 42.40 | 45.83 | 46.26 | 46.43 | |
| AdamW | 45.45 | 46.51 | 38.55 | 47.59 | 46.81 | 50.55 | |
| MobileNetV3-S | Adam | 31.97 | 44.95 | 35.98 | 39.19 | 42.08 | 44.93 |
| RAdam | 36.25 | 42.31 | 36.89 | 34.45 | 43.82 | 40.68 | |
| AdamW | 34.93 | 44.64 | 39.08 | 34.33 | 43.15 | 42.74 | |
| EfficientNet-B0 | Adam | 41.69 | 48.94 | 39.77 | 46.41 | 49.66 | 43.39 |
| RAdam | 34.89 | 49.82 | 36.33 | 40.00 | 46.65 | 49.04 | |
| AdamW | 37.49 | 48.52 | 43.87 | 41.14 | 45.60 | 50.32 | |
- Note: Bolded values indicate the highest-performing results across the applied DA schemes.
We report that the DA-5 scheme aided the DenseNet161 when trained using the AdamW optimizer and yielded the highest multiclassification metrics (accuracy, F1-Score, and BACC). Additionally, we inspected the impact of the DA across the 12 scenarios; the results show that DA-4 and DA-5 are the most influential in enhancing the DL model performance across the four main neural network architectures under study. The second competitive method is ResNet-50 architecture; when trained on DA-5 using the AdamW optimizer, it was the most favorable performance when compared with an instance of ResNet-50 trained with the other two optimization schemes (Adam and RAdam). Additionally, ResNet-50, when trained on DA-5, significantly outperforms ResNet-50 when trained on the original image by a margin ≥6.8% across accuracy, F1-Score, and AUC metrics when considering the AdamW optimizer. Likewise, the best model accuracy was recorded for the EfficientNet-B0 architecture with DA-4 compared with either Adam or RAdam optimizer: Adam performed better than the other optimization schemes. The best models from the EfficientNet-B0 architecture outperform all variants of the MobileNetV3-S in most of the performance evaluation metrics. After conducting experiments for the different instances of the MobileNetV3-S models while considering different DA schemes and optimizers, the highest model accuracy of 56.4% was achieved with DA-4 when the MobileNetV3-S model weights were optimized using the Adam optimizer. In general, the MobileNetV3-S factoring DA-4 and DA-1 schemes yielded the best performance across the three main experimental scenarios for this architecture; however, the best MobileNetV3-S trained on data-augmented images yielded the worst performance when compared with most of the best DL architectures (DenseNet121, ResNet-50, and EfficientNet-B0).
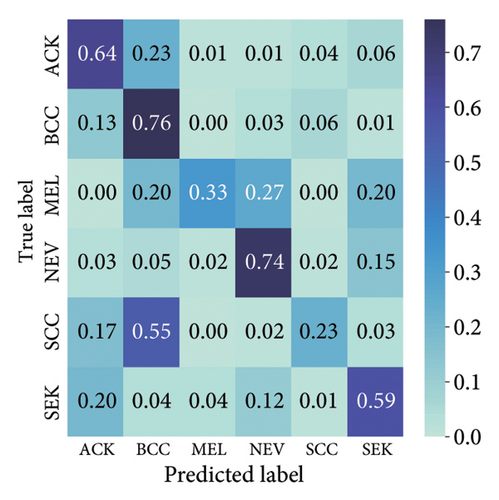
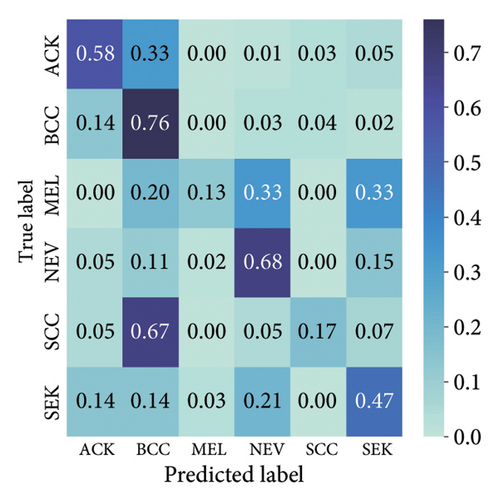
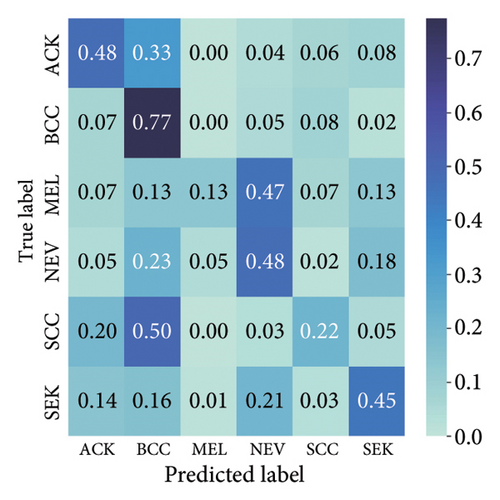
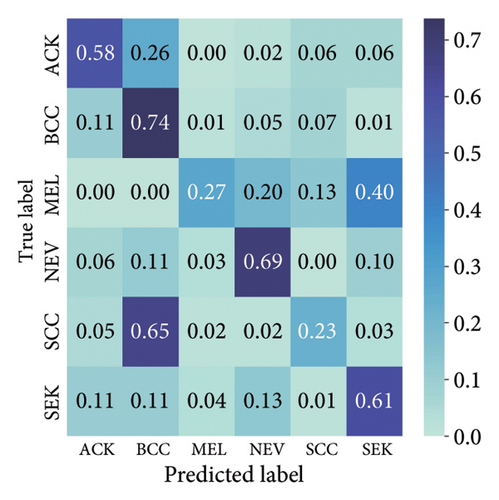
The findings demonstrate that data augmentation schemes based on spatial or geometrical transformations including random rotation (DA-4), a combination of cropping, horizontal flipping, and rotation (DA-5), horizontal flipping (DA-3), and cropping (DA-1) contribute to improved multiclass classification performance in deep learning models trained on clinical skin lesion datasets. In most instances, the performance of these DL architectures deteriorates when color jitter DA (DA2) schemes are considered. It is vital to highlight that the random rotation (DA-4) yielded the best performances in most experiments, especially with the MobileNetV3-S and EfficientNet-B0. We underscore that DenseNet121 and ResNet-50 trained with AdamW optimizer on DA-5, which factors DA-1, DA-3, and DA-4, often yielded the highest classification scores across the evaluated metrics. At the same time, the top-performing architecture across all the schemes and model optimizers was the DenseNet-121 architecture. These results indicate that the DA schemes considered in this study have demonstrated the potential to improve DL model performances. To better understand how the evaluated DL models predict clinical skin lesions, we illustrate the correlation between the actual output labels (ground truth) and the predicted outputs from the top-performing models using a confusion matrix, depicted in Figure 7. The figure demonstrates that DenseNet-121 exhibited the highest accuracy, correctly predicting around 443 images while making only 246 false predictions during the testing phase evaluation. In contrast, the other methods showed lower accuracy in correct predictions.
4.2.2. Training With Pretrained Weights
Additional experiments were carried out with the top-performing DL models (DenseNet121, ResNet50, MobileNetV3-S, and EfficientNetB0), which were trained using pretrained weights (from ImageNet) while considering different DA strategies and optimization techniques in an attempt to perform multiclassification of skin lesions. Tables 15, 16, and 17 provide a summary of the testing and validation performance in terms of accuracy, F1-Score, and AUC, respectively. The results obtained demonstrate the efficacy of models trained with DA-3, DA-4, and DA-5 strategies for improving the test and validation performances. The best multiclass classification accuracy of 75.07% was recorded with the DenseNet121 architecture utilizing the RAdam optimizer and DA-3 strategy. The EfficientNet-B0 architecture attained the highest F1-Score and BACC of 69.47% and 68.54% with the Adam optimizer and DA-4 strategy. Similar performance was observed for the EfficientNet-B0 models in the validation set with F1-Score and BACC of 72.83% and 69.83%, respectively, considering Adam optimizer and DA-4 strategy, thereby demonstrating the consistency of these models in testing and validation sets.
| Model | Optimizer | Original | DA-1 | DA-2 | DA-3 | DA-4 | DA-5 |
|---|---|---|---|---|---|---|---|
| Testing set | |||||||
| DenseNet121 | Adam | 71.59 | 70.43 | 68.12 | 74.20 | 73.33 | 70.14 |
| RAdam | 66.67 | 72.17 | 71.01 | 75.07 | 72.17 | 71.30 | |
| AdamW | 69.86 | 68.70 | 68.41 | 71.30 | 73.04 | 70.14 | |
| ResNet50 | Adam | 66.09 | 68.41 | 66.67 | 68.70 | 71.59 | 70.43 |
| RAdam | 65.80 | 67.83 | 69.57 | 71.30 | 69.86 | 72.46 | |
| AdamW | 65.80 | 66.09 | 68.41 | 68.12 | 70.72 | 67.20 | |
| MobileNetV3-S | Adam | 61.74 | 64.93 | 64.06 | 67.54 | 72.17 | 66.09 |
| RAdam | 61.45 | 66.96 | 60.29 | 65.51 | 68.99 | 68.12 | |
| AdamW | 62.61 | 66.38 | 65.22 | 67.25 | 71.01 | 66.96 | |
| EfficientNet-B0 | Adam | 71.01 | 68.70 | 69.57 | 70.14 | 73.04 | 73.04 |
| RAdam | 69.28 | 71.01 | 68.99 | 69.28 | 71.30 | 69.86 | |
| AdamW | 70.72 | 70.43 | 67.83 | 71.59 | 72.46 | 73.04 | |
| Validation set | |||||||
| DenseNet121 | Adam | 72.46 | 75.36 | 74.78 | 77.39 | 77.10 | 74.78 |
| RAdam | 72.17 | 75.65 | 75.07 | 76.23 | 77.10 | 75.07 | |
| AdamW | 74.20 | 76.23 | 75.94 | 76.23 | 77.68 | 76.23 | |
| ResNet50 | Adam | 71.88 | 74.49 | 71.01 | 76.23 | 76.52 | 71.88 |
| RAdam | 71.59 | 72.46 | 73.91 | 73.04 | 76.52 | 72.75 | |
| AdamW | 72.46 | 73.04 | 74.49 | 74.78 | 74.78 | 71.88 | |
| MobileNetV3-S | Adam | 67.83 | 70.72 | 72.46 | 71.59 | 71.88 | 66.67 |
| RAdam | 66.09 | 71.01 | 70.14 | 70.43 | 71.01 | 67.54 | |
| AdamW | 67.54 | 69.86 | 72.17 | 71.30 | 72.17 | 68.41 | |
| EfficientNet-B0 | Adam | 73.62 | 74.49 | 76.23 | 76.52 | 76.81 | 74.78 |
| RAdam | 73.04 | 74.20 | 76.81 | 75.36 | 77.68 | 74.78 | |
| AdamW | 73.04 | 74.20 | 76.52 | 77.39 | 75.94 | 75.65 | |
- Note: Bolded values indicate the highest-performing results across the applied DA schemes.
| Model | Optimizer | Original | DA-1 | DA-2 | DA-3 | DA-4 | DA-5 |
|---|---|---|---|---|---|---|---|
| Testing set | |||||||
| DenseNet121 | Adam | 62.74 | 60.33 | 63.88 | 66.49 | 66.89 | 65.29 |
| RAdam | 58.60 | 64.18 | 60.86 | 65.85 | 67.03 | 64.48 | |
| AdamW | 59.48 | 60.15 | 57.99 | 60.61 | 65.22 | 65.93 | |
| ResNet50 | Adam | 58.01 | 61.92 | 59.43 | 58.74 | 65.28 | 65.61 |
| RAdam | 58.75 | 61.45 | 60.81 | 66.91 | 61.20 | 66.49 | |
| AdamW | 62.87 | 55.25 | 57.73 | 60.43 | 62.54 | 58.23 | |
| MobileNetV3-S | Adam | 56.10 | 57.00 | 53.54 | 59.75 | 63.31 | 62.73 |
| RAdam | 56.42 | 63.04 | 51.91 | 58.53 | 63.12 | 64.99 | |
| AdamW | 56.81 | 61.42 | 54.62 | 56.76 | 65.40 | 62.93 | |
| EfficientNet-B0 | Adam | 64.80 | 62.77 | 61.20 | 61.43 | 69.47 | 66.45 |
| RAdam | 57.12 | 58.95 | 57.91 | 62.10 | 63.31 | 60.01 | |
| AdamW | 64.38 | 61.49 | 63.76 | 64.52 | 64.48 | 65.78 | |
| Validation set | |||||||
| DenseNet121 | Adam | 64.51 | 70.91 | 68.25 | 70.46 | 66.52 | 66.58 |
| RAdam | 65.86 | 61.98 | 69.79 | 63.66 | 69.00 | 64.40 | |
| AdamW | 68.82 | 65.39 | 62.28 | 65.78 | 67.80 | 68.72 | |
| ResNet50 | Adam | 63.64 | 62.62 | 65.12 | 65.59 | 70.78 | 63.16 |
| RAdam | 63.85 | 63.13 | 63.85 | 61.52 | 66.36 | 62.86 | |
| AdamW | 66.05 | 60.19 | 63.86 | 61.19 | 66.84 | 61.77 | |
| MobileNetV3-S | Adam | 58.51 | 63.63 | 59.55 | 60.14 | 62.78 | 61.88 |
| RAdam | 57.83 | 61.74 | 55.67 | 59.83 | 61.81 | 60.36 | |
| AdamW | 50.23 | 60.63 | 57.66 | 62.06 | 64.06 | 60.99 | |
| EfficientNet-B0 | Adam | 69.67 | 67.30 | 64.68 | 67.53 | 72.38 | 69.52 |
| RAdam | 64.48 | 65.58 | 69.13 | 68.83 | 72.30 | 71.61 | |
| AdamW | 68.05 | 68.83 | 68.55 | 68.29 | 66.02 | 69.39 | |
- Note: Bolded values indicate the highest-performing results across the applied DA schemes.
| Model | Optimizer | Original | DA-1 | DA-2 | DA-3 | DA-4 | DA-5 |
|---|---|---|---|---|---|---|---|
| Testing set | |||||||
| DenseNet121 | Adam | 62.19 | 59.76 | 63.86 | 64.52 | 65.74 | 65.22 |
| RAdam | 61.30 | 63.29 | 59.27 | 63.59 | 65.85 | 63.02 | |
| AdamW | 59.26 | 60.38 | 57.74 | 60.47 | 62.54 | 65.09 | |
| ResNet50 | Adam | 57.72 | 61.84 | 56.14 | 57.89 | 64.23 | 64.50 |
| RAdam | 58.21 | 61.08 | 59.44 | 64.08 | 59.36 | 68.40 | |
| AdamW | 63.72 | 53.80 | 57.11 | 59.76 | 60.94 | 60.24 | |
| MobileNetV3-S | Adam | 55.34 | 57.30 | 52.87 | 60.59 | 62.61 | 62.10 |
| RAdam | 58.18 | 62.62 | 52.65 | 57.84 | 62.23 | 65.15 | |
| AdamW | 57.15 | 59.81 | 54.94 | 57.84 | 65.09 | 61.96 | |
| EfficientNet-B0 | Adam | 66.15 | 61.78 | 61.05 | 59.91 | 68.54 | 66.11 |
| RAdam | 55.39 | 59.31 | 55.79 | 62.51 | 63.81 | 58.93 | |
| AdamW | 65.70 | 61.44 | 62.60 | 62.98 | 62.46 | 66.81 | |
| Validation set | |||||||
| DenseNet121 | Adam | 62.17 | 67.87 | 66.71 | 68.64 | 63.88 | 66.38 |
| RAdam | 66.71 | 60.50 | 66.95 | 61.07 | 67.64 | 62.70 | |
| AdamW | 66.68 | 63.97 | 60.55 | 64.17 | 63.42 | 68.86 | |
| ResNet50 | Adam | 61.33 | 61.36 | 62.55 | 63.50 | 68.73 | 60.11 |
| RAdam | 62.35 | 61.63 | 61.44 | 59.23 | 63.09 | 62.15 | |
| AdamW | 64.42 | 59.10 | 60.49 | 59.26 | 64.02 | 60.51 | |
| MobileNetV3-S | Adam | 57.09 | 62.64 | 56.23 | 58.32 | 63.19 | 64.00 |
| RAdam | 56.23 | 62.12 | 55.03 | 56.40 | 59.95 | 59.22 | |
| AdamW | 51.14 | 59.86 | 54.77 | 60.23 | 64.48 | 59.56 | |
| EfficientNet-B0 | Adam | 67.34 | 64.62 | 61.77 | 66.43 | 69.83 | 68.70 |
| RAdam | 60.69 | 63.50 | 65.51 | 65.24 | 70.81 | 69.11 | |
| AdamW | 66.59 | 69.25 | 66.10 | 64.78 | 64.49 | 67.95 | |
- Note: Bolded values indicate the highest-performing results across the applied DA schemes.
The choice of model optimization algorithms also affected the performances of the investigated architectures when considering pretrained weights. The Adam optimizers yielded consistent performance across different metrics with DA-4 and DA-5 strategies providing superior performance for the EfficientNet architecture in F1-Score and BACC metrics. Highly competitive performance was also observed for RAdam and AdamW in these pretrained settings. The MobileNetV3-S showed performance improvements for the BACC metric reaching about 65.15% in testing set evaluations. The DenseNet121 and EfficientNetB0 architectures outperformed others in the multiclass classification experiments involving pretrained weights. DenseNet121 attained the highest accuracy in the testing set evaluations under DA-3 and DA-5 strategies with the RAdam and Adam optimizers indicating the suitability of this architecture for multiclass classification on clinical lesion images. The deep and densely connected layers of the DenseNet model provided better feature extraction and representation in the multiclass settings.
4.2.3. Statistical Analyses
Statistical tests were conducted using the paired t-test (Eqn) and the Welch t-test (Eqn) to compare the performance of the investigated models on the testing dataset. We observe the statistical difference between the original (without any DA) and other DA schemes in each model architecture over different model optimizer instances. The best overall accuracy for the DenseNet-121 (=63.50%) trained from scratch was obtained in the DA-3 scheme with the RAdam optimizer. Statistical tests comparing the performance of the DenseNet121 in DA-3 with the instance without DA revealed p values of 0.015 and 0.0003, respectively, for paired and Welch t-tests. The ResNet-50 model trained without pretrained weights gave an overall best accuracy of 62.00% with the DA-5 scheme and AdamW optimizer. Statistical comparison of the results obtained for the ResNet-50 in DA-5 schemes with the instance without DA gave p values of 0.01 and 0.02, respectively, for paired and Welch t-tests, demonstrating high levels of statistical difference. The EfficientNet-b0 trained without pretrained weights gave an overall best accuracy of 60.3% with the DA-4 scheme and Adam optimizer. The measured p values on paired t-test and Welch tests were 0.013 and 0.012, respectively, indicating high levels of statistical difference between DA-4 and instances without DA for EfficientNet-b0. MobileNet-V3S, trained without pretrained weights, gave an overall best accuracy of 56.40 with the DA-4 scheme and Adam optimizer. The statistical tests measuring the difference between the DA-4 scheme and instances without DA for MobileNet-V3S gave p values of 0.02 and 0.0018, respectively, for paired and Welch t-tests.
The pretrained DenseNet121 model obtained an overall best accuracy of 75.07% with the DA-3 scheme and RAdam optimizer. Statistical comparison of the DA-3 scheme scenario for DenseNet121 with the instance without DA gave p values of 0.19 and 0.09, respectively, for paired and Welch t-tests. The overall best accuracy (=72.46%) obtained for the pretrained ResNet-50 architecture was obtained with the DA-5 scheme and the RAdam optimizer. Statistical comparison of the DA-5 scenario with the instance without DA for ResNet-50 gave p values of 0.11 for both paired and Welch t-tests. DA-4 also produced better performance for the pretrained ResNet50 architecture and gave p values of 0.007 and 0.008 compared to the instances without DA, indicating a high statistical difference. MobileNet-V3S trained using pretrained weights recorded the best accuracy values across all optimizers with the DA-4 scheme. Statistical comparisons of MobileNet-V3S on DA-4 with the instance without DA gave p values of 0.009 and 0.005, respectively, showing high statistical differences. The pretrained EfficientNet-b0 obtained an overall best accuracy of 73.04 in DA-4 and DA-5 schemes. Statistical comparison for EfficientNet-b0 models in DA-4 scheme with the instance without DA gave p values of 0.002 and 0.05, respectively, for paired and Welch t-tests, indicating significant levels of statistical difference.
5. Discussion
5.1. Interpretability
One of our research goals is to understand the rationality behind how the selected DL methods arrive at a particular decision. We conducted a comparative analysis of three interpretable algorithms. These algorithms analyze DL models and produce saliency maps on a clinician’s skin images by identifying regions indicating skin lesion conditions. In the subsequent subsections, we offer a concise overview of the operational framework of our newly developed interpretable DL platform, which predicts and localizes the presence of skin lesions in clinical images for both binary and multiclassification scenarios. In the web platform, only the CAM-based methods were made available because the SHAP algorithm requires lots of computational resources and hence takes more time to produce the explainable maps.
5.1.1. SHAP Assessment on Binary and Multiclass Tasks
In this section, we provide detailed explainability discussions using feature attributions from the SHAP algorithm. The discussion in this section is premised on the DenseNet161 model trained with the DA-4 strategy for binary classification and DenseNet121 model trained with the DA-5 strategy for multiclass classification. The SHAP plots are produced for these models and trained from scratch using pretrained weights with Adam, AdamW, and RAdam optimizers. The models are analyzed using instances where correct and incorrect predictions were obtained. Figures 8, 9, and 10 provide the binary classification SHAP visualizations of the feature attributions for the DenseNet161 in pretrained and random weight settings using Adam, AdamW, and RAdam optimizers, respectively. In Figure 8, for the correct predictions, Adam-optimized models focus on the irregular borders and pigmentation, as highlighted by the red regions, for malignant predictions. For benign predictions, the model highlights the smoother areas characterized by uniform texture and coloration. Wrong predictions were obtained when the model incorrectly highlighted noncritical regions of images and areas, particularly displaying malignant features. The AdamW-optimized model highlights lesion border areas and texture irregularities as critical features for malignancy as shown in Figure 9. The lack of color variations and uniform textures was highlighted for correct benign predictions in the AdamW-optimized model. For incorrect predictions, the model attributes less significant regions and minor artifacts, failing to give significant weights to malignant features. Furthermore, it appears the model identifies elevation as a predominant feature for obtaining malignant predictions, leading to misclassifications in Figures 9(b) and 9(d). In Figure 10, the RAdam-optimized model highlights the lesion edges and heterogeneity for distinguishing malignant and benign lesions. Although the model highlights the lesion areas in the incorrect predictions, it fails to interpret the features correctly to obtain either malignant or benign predictions.
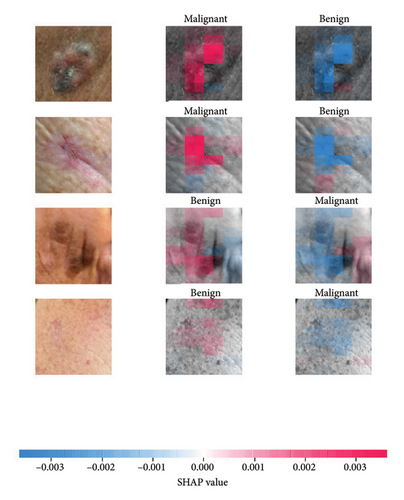
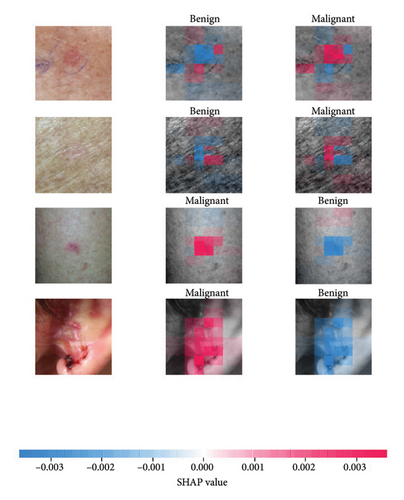
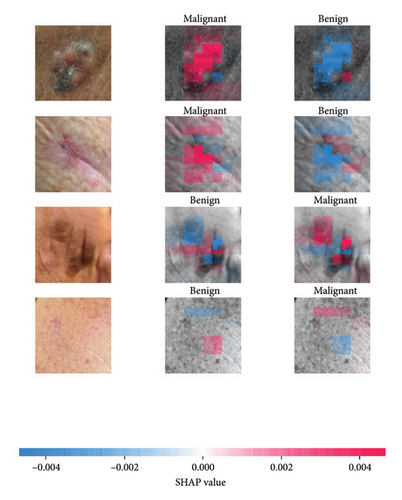
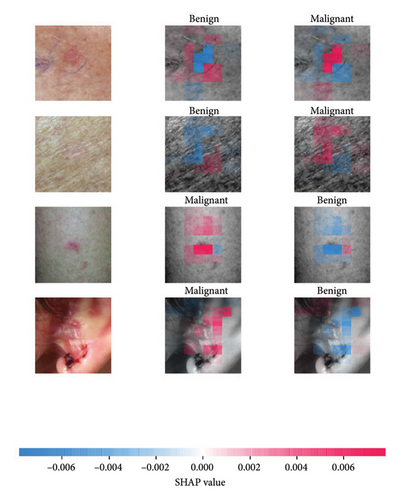
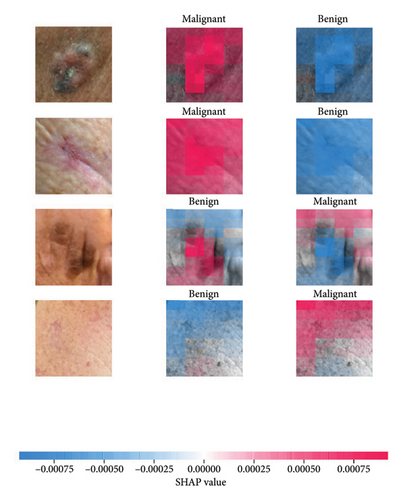
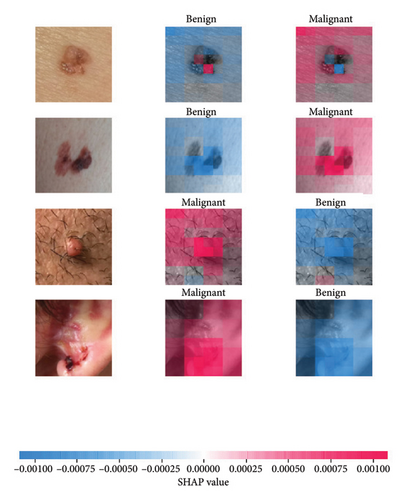
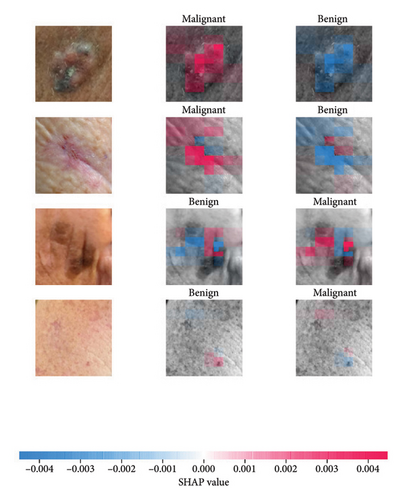
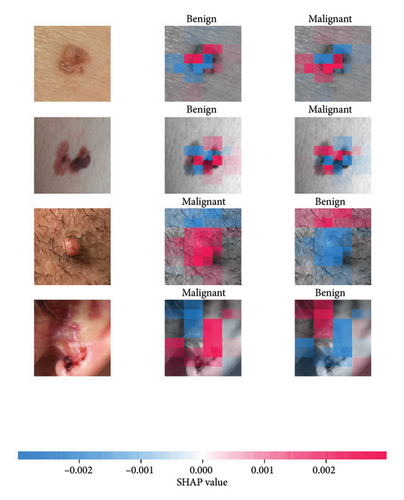
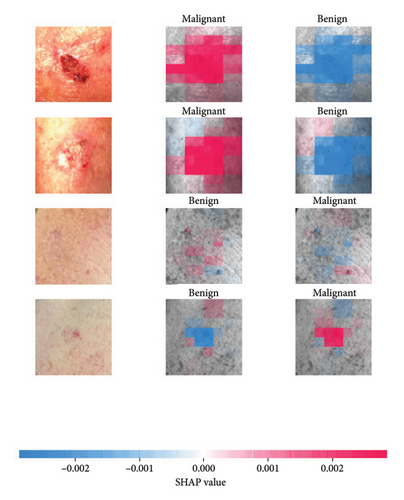
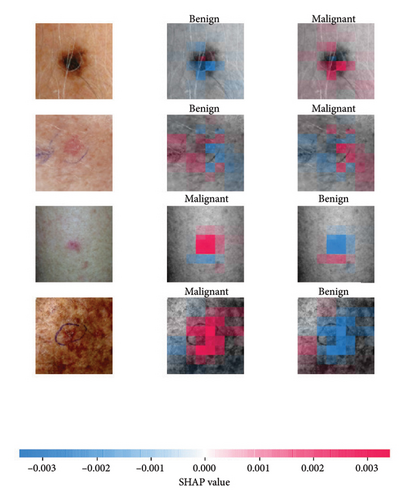
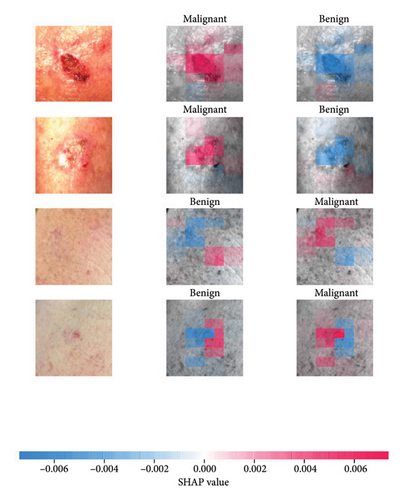
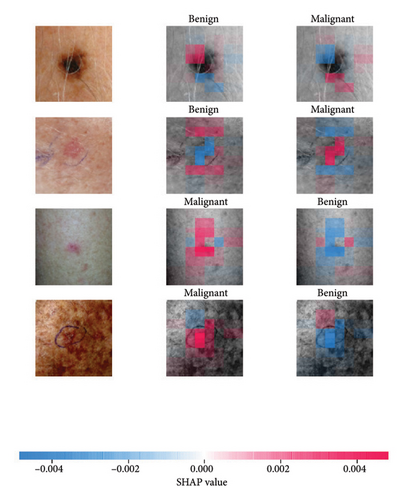
Figures 11, 12, and 13 provide the multiclass classification SHAP visualizations of the feature attributions for the DenseNet161 in pretrained and random weight settings using Adam, AdamW, and RAdam optimizers, respectively. In Figure 11, the Adam-optimized DenseNet-121 with pretrained weights focuses on the darker and irregular regions for correct BCC predictions. Uniform pigmentation and well-defined borders were highlighted as attributions for NEV prediction, while melanoma attributes were due to uneven colors and irregular borders. Incorrect predictions of SCC were due to the attribution of surface irregularities and color variations shared with BCC and ACK conditions. The AdamW-optimized model in Figure 12 highlights malignant features showing irregular pigmentation and border irregularities to obtain accurate predictions for MEL conditions. Characteristic features showing raised edges and pearly colors were attributed to BCC predictions. Incorrect predictions in this case were primarily due to the model’s feature attributions that were not definitive for the correct class. Accurate predictions for MEL conditions in Figure 13 for the RAdam-optimized model were due to features distinctive of asymmetry and color variations. Likewise, the model focuses on distinctive features with irregular textures and pigmentations for ACK and BCC. Incorrect predictions, especially in the case of NEV misclassified as MEL, were due to emphasis on features that were not indicative of malignant lesions.
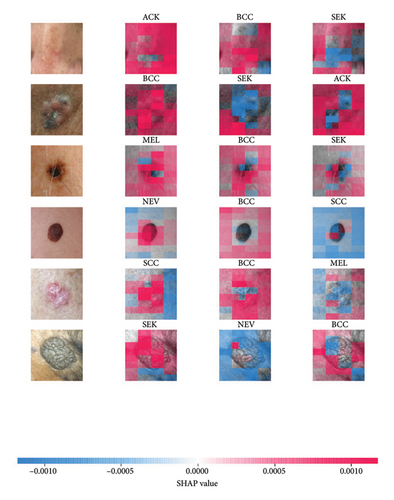
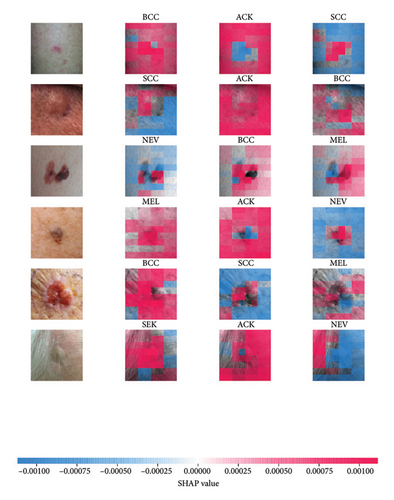
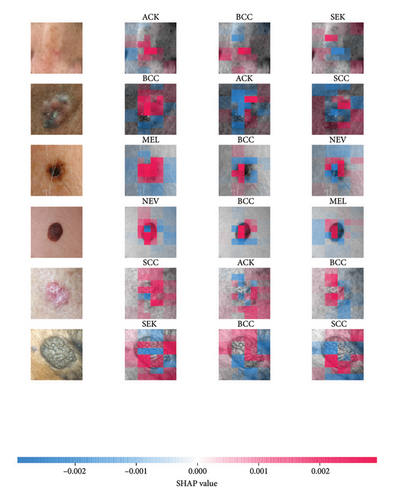
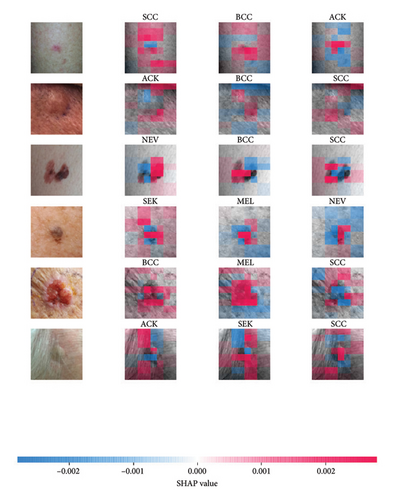
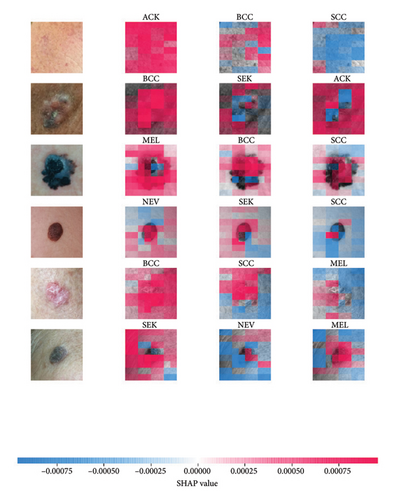
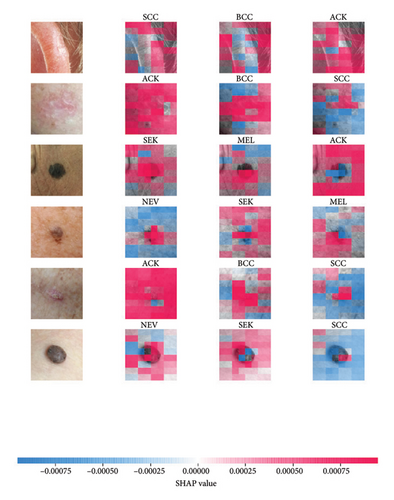
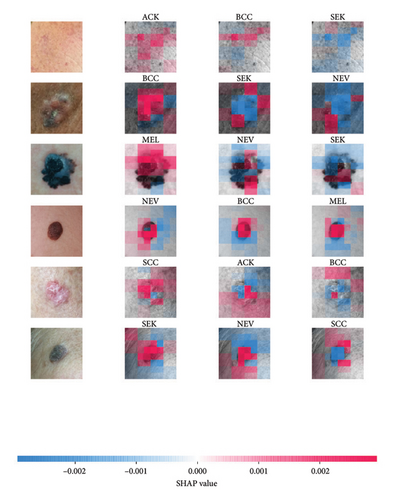
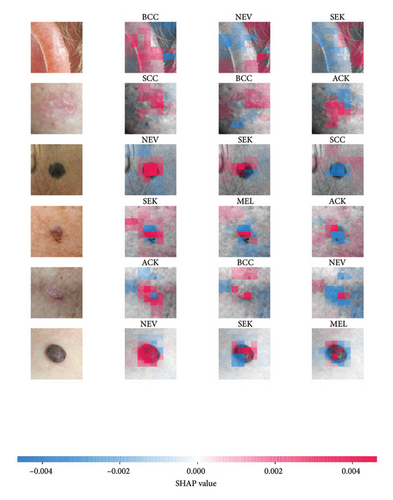
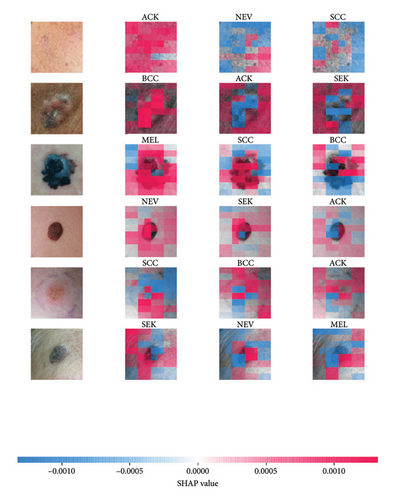
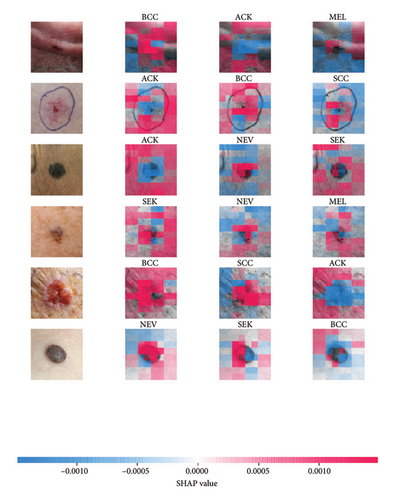
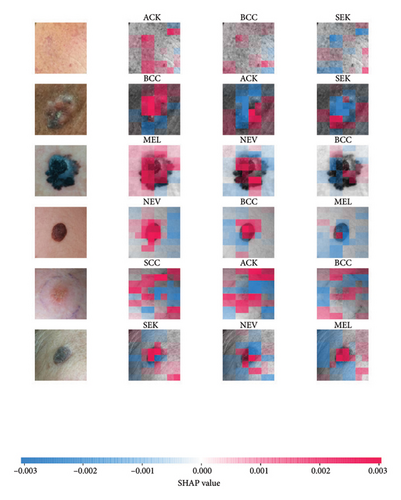
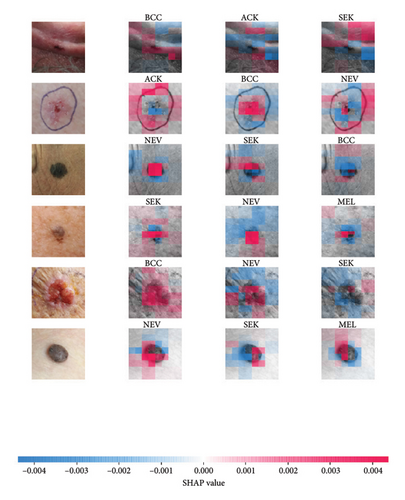
5.1.2. CAM Interpretability Assessment on a Multiclassification Task
The operational functionality of our developed system is showcased in Figure 14. This explainable DL system demonstrates the capability to predict skin lesions, suggest the specific type of skin lesion (malignant or benign), and pinpoint the precise region of interest containing the lesion (tumor). Suppose a user of the developed interpretable DL platform chooses the multiclass skin lesion predictive system menu tab; upon uploading the skin image and selecting DenseNet121 and then clicking on the Predict button, the user activates the DL engine to classify the skin image to determine the target class from the six possible class categories (displaying the extent of certainty). The result demonstrates the system effectively predicted the provided skin image containing BCC, a type of malignant tumor, revealing a certainty score of 100%. Conversely, the confidence scores for other classes (SEK, NEV, ACK, SCC, and MEL) were 0%. Consequently, we chose the interpretable scheme (GradCAM) from the available options and then clicked on the interpret button. The interpretability analysis showed that the BCC can be found in the middle portion of the clinical skin image. We conducted another assessment of DenseNet121 using the other interpretable algorithms (AblationCAM and GradCAM++). Figure 15 demonstrates that all interpretable algorithms concurred and identified nearly identical attention regions (localized portions) in the skin containing BCC. This comprehensive analysis is crucial for medical experts to establish confidence before proffering treatment protocols.
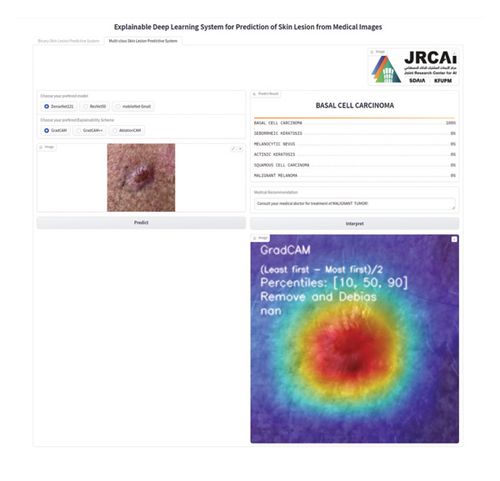
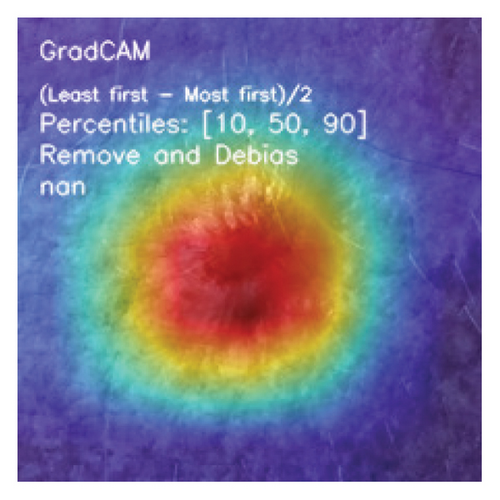
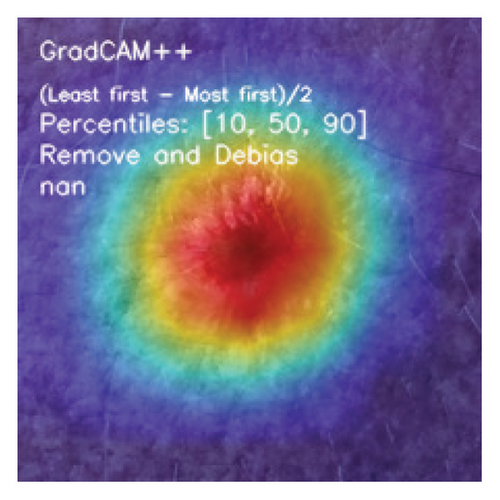
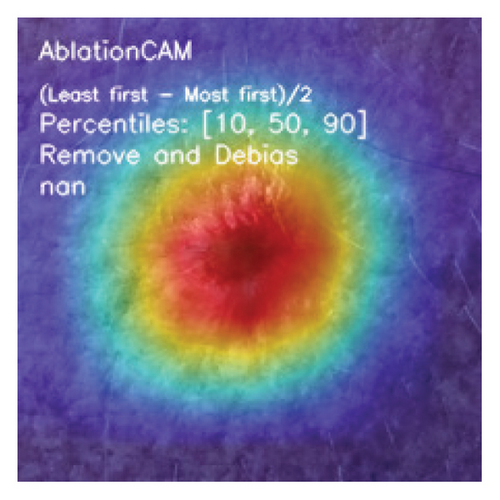
5.1.3. CAM Interpretability Assessment on a Binary Classification Task
We conducted a detailed examination of the operational features within our developed system’s binary skin lesion predictive system menu, as depicted in Figure 16. Suppose a user of the developed interpretable DL platform chooses the binary skin lesion predictive system menu tab; upon uploading the skin image and selecting MobileNet-Large (MobileNetV3-L) and then clicking on the Predict button, the user activates the DL engine to classify the skin image to determine the target class from the two possible class categories (displaying the extent of certainty). The result demonstrates the system accurately predicted the provided skin image containing a benign tumor, achieving a confidence score of 100%. Conversely, the confidence score for a malignant tumor is 0%. Furthermore, the explainability analysis suggests that the benign tumor is located at the upper left and lower middle regions of the clinical skin image. We replicated the assessment using the other interpretable algorithms and present the resulting observations in Figure 17. The figure shows that all the interpretable algorithms agreed and identified nearly identical attention regions (localized portions) in the skin containing benign tumors. Consequently, this attention region influenced MobileNetV3-L’s decision to classify the uploaded skin image as depicting a benign tumor. Such thorough analysis is essential for medical experts to devise treatment protocols confidently.
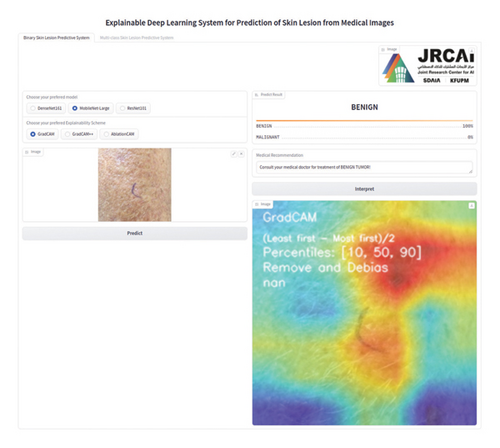
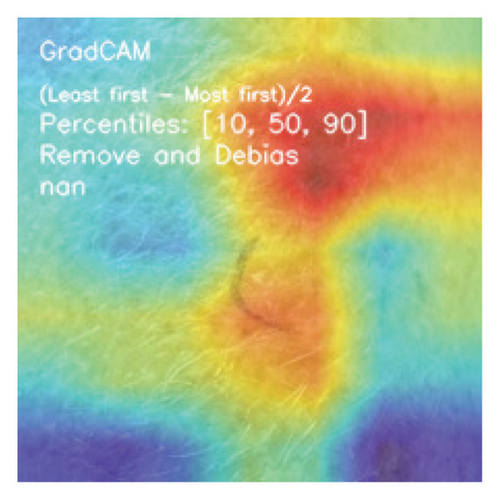
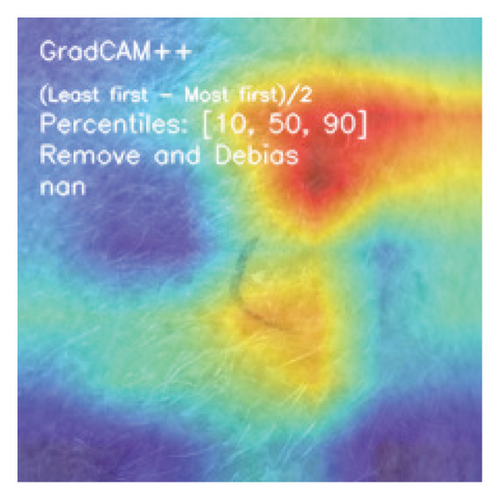
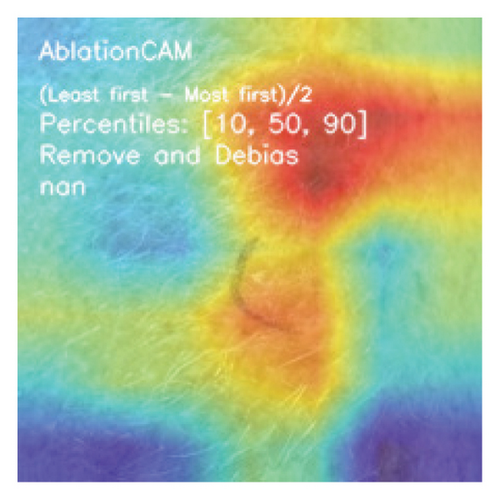
5.2. Limitations
- •
Dataset: While the investigated dataset, PADUFES-20 [5], produced some promising results in binary classification, the limited performance in the multiclass classification is due to the limited samples present in the dataset. Although DA strategies have been proven in our study to improve performance on this dataset, the MEL class in the PADUFES-20 dataset has only 52 samples in total. This prevents the models from learning adequate features for classifying MEL in multiclass classification. Likewise, the SCC class has only 192 samples in the dataset, and this limitation also affected the model’s performance in correctly identifying lesions from this class in the testing set. Our study has shown the potential of improving the performance of DL models in lesion classification from clinical images when the right augmentation strategies are applied. Research advocacy for building larger databases of clinical lesion images, similar to the large dermoscopy lesion archives, is needed to further drive research in this area and improve model performance.
- •
DA: In our study, we investigate five DA strategies, including only one color DA scheme. Further studies can be conducted using more sophisticated color augmentation strategies for simulating performance under different lighting conditions. Additionally, color augmentations can be carefully designed to build models immune to skin tone variations and bias.
- •
Model architectures: Our study focuses on four families of CNN architectures, namely, DenseNet, ResNet, MobileNet, and EfficientNet. It may be worth investigating other CNN architectures on this dataset. Furthermore, this study can be replicated with different vision transformer variants.
- •
Optimization schemes: Due to limited computational resources, we investigated and reported on only three model optimization algorithms: Adam, RAdam, and AdamW. Further investigations with other optimization algorithms might be useful to the medical dermatology research community.
- •
Explainability/interpretability: Our interpretability analyses were limited to qualitative discussions due to the absence of ground truth bounding boxes in the lesion dataset. We intend to conduct further quantitative interpretability analysis after engaging qualified experts in the medical community for ground truth labeling on the PADUFES-20 dataset.
6. Conclusion
This article has demonstrated the development and deployment of an affordable, interpretable DL system for binary or multiclassification of lesions from clinical skin images. The interpretable DL system employed XAI algorithms, which analyzed the DL model inferences by understanding the different pixel-level feature representations and subsequently mapping these learned representations to predict target classes for clinician skin images from a dataset—treated as either binary or multiclass of the skin lesion dataset. Additionally, the study evaluates DL models trained with three variants of the Adam optimizer (RAdam, AdamW, and Adam) with randomly initialized weights. We explore the impact of various DA techniques on model performance evaluation and trained 13 DL models on original data.
Afterward, we selected the 4 best-performing model instances from the 13 DL architectures and considered five DA schemes to enhance model performance. To gain insights into the decision-making processes of these DL methods, we utilize interpretable algorithms that leverage the CAM and SHAP principles to identify critical weights influencing the decision made by the DL models, thereby producing localization maps of skin lesion regions (heatmaps of lesion or areas containing tumor in the medical images). We employed DL models and interpretable algorithms to create an interactive web application interface deployed via the Gradio framework. This pilot-scale application can be a decision support tool for dermatologists and clinicians.
The results from our experimental analysis demonstrate that the instance of DenseNet when trained with appropriate DA schemes and optimized with suitable optimizer outperforms most other DL approaches across various evaluation metrics in binary and multiclass challenges. We illustrate how explainable algorithms elucidate the rationale behind DL model decisions by highlighting attention regions containing lesions. This study indicates that offline DA can significantly enhance DL techniques, improving classification performance compared to models trained solely on original clinician skin images. This indicates that employing DA techniques, factoring in spatial transformations or combinatorial effects of different DA schemes, aided the DL model in effectively generalizing to new testing examples. Our proposed interactive interpretable DL system supports three primary functions: predictive capability, the ability to perform recommendations, and saliency map generation.
Future research could explore the potential of using the vision transformer model to predict skin lesions on a larger dataset of clinician skin lesions, covering a broader range of class categories.
Conflicts of Interest
The authors declare no conflicts of interest.
Funding
This research was funded by the Saudi Data & AI Authority (SDAIA) and King Fahd University of Petroleum & Minerals (KFUPM) under SDAIA-KFUPM Joint Research Center for Artificial Intelligence (JRCAI) Grant JRCAI-UCG-04.
Acknowledgments
The authors would like to acknowledge the support provided by SDAIA-KFUPM Joint Research Center for Artificial Intelligence at King Fahd University of Petroleum & Minerals.
Open Research
Data Availability Statement
Data are available on request.


