Advanced ActivePure Technology: The Opportunity for Risk Assessment Using Murine Model
Abstract
This study evaluates the effects of Advanced ActivePure technology, a photocatalytic air purification system, on the health status of mice housed in a controlled environment. This novel technology is promising due to its ability to eliminate the risk of ozone release into the environment, making it safer compared to other photocatalytic oxidation technologies. Utilizing 300 6-month-old mice over a period of 3 months, this research investigated various health parameters, including haematological, serum biochemical, redox, and inflammatory indicators. The experiment demonstrated no significant alteration in the majority of tested parameters between the control and Advanced ActivePure-exposed groups. Until now, no study has analyzed the health safety of living organisms exposed to Advanced ActivePure in such a detailed manner. Histopathological analyses of nasal and eye tissues showed no adverse changes attributable to Advanced ActivePure exposure. These findings suggest that Advanced ActivePure technology does not negatively impact the overall health of mice, including biochemical markers and respiratory histopathology.
1. Introduction
The safeguarding against contamination of air impacting human and animal health within indoor environments is contingent upon numerous determinants. These encompass the efficacy of air exchange systems, the density of human and animal occupants, the health condition of said occupants, and their individual vulnerabilities to airborne pollutants. The well-being of humans and animals situated in confined indoor environments, such as office edifices, early childhood education facilities, and agricultural husbandry structures, is influenced by the aggregate impact of all the aforementioned variables. Of particular concern are individuals receiving care in medical institutions, including hospitals, long-term care facilities, and procedural spaces. Also of concern is animal care in veterinary clinics.
As a result, an assortment of methodologies has been devised to counteract pathogens and other air contaminants prevalent within such settings. The air purification techniques predominantly deployed include filtration, adsorption, ultraviolet light germicidal irradiation, ionization, and photocatalytic oxidation (PCO). Nevertheless, the application of these techniques does not guarantee efficacy universally; often they are operationally cumbersome and financially burdensome. Moreover, the outcomes of their utilization often do not adequately confer health benefits [1, 2].
Air filtration is often touted as key in maintaining a healthy environment, effectively removing particles, such as PM2.5, that can negatively impact human and animal health. HEPA and ULPA filters are used for removing ultrafine nanoparticles, such as bacteria and viruses, from the ambient air. However, filtration is not without its drawbacks and potential health hazards. Although adsorption filters effectively remove contaminants from the air, there is a risk of airborne bacteria developing on the adsorbent surface, which can lead to an increased risk of infection. Additionally, adsorption technology generates hazardous solid waste, which, if not properly treated or disposed, threatens health and the environment.
Electrostatic filters generate pollutants, such as ozone and VOC (volatile organic compounds) resulting from ionization. These new pollutants pose an additional threat to health. Filters can also become a source of contaminants themselves if they are not regularly cleaned or replaced. Prolonged use of a filter increases the likelihood of potential pollution, for example, through the re-emission of VOCs or the spread of fungi and bacteria through aerosol diffusion [3].
UVC light disinfects the air in forced air systems; standalone systems (in the absence of living organisms); and in heating, ventilation, and air conditioning systems. Studies show that ultraviolet germicidal irradiation effectively reduces microorganisms and endotoxins [3]. To prevent health risks, it is vital to control the release of toxic byproducts, such as ozone, from UVC systems. Safety measures must be in place to prevent direct UVC light exposure, which damages the respiratory system, eyes, and skin. For these reasons, UVC is typically used only episodically in empty rooms and unfortunately is only marginally effective in shielded applications [2, 4].
Bipolar ionization generates positive and negative ions when water vapor is exposed to high-voltage electrodes. Although there is limited research, recent evidence suggests that this technology might help reduce bacterial deposition, neutralize airborne pathogens, and eliminate particles and VOCs, especially with long-term use [5, 6]. Unfortunately, these systems, similar to UVC-based ones, produce high ozone and VOC levels.
PCO is based on a light-mediated, redox reaction of gases and biological particles adsorbed on the surface of a solid pure or doped metal oxide semiconductor material or photocatalyst. When exposed to UV light, the photocatalyst generates oxygen species that remain surface-bound. The oxygen species are highly reactive with adsorbed gases and biological particles. However, the oxidizing process can be incomplete, and the original reaction byproducts can be more toxic or harmful than the original constituents. Several studies showed the generation of formaldehyde and acetaldehyde from the partial oxidation of ubiquitous VOCs such as alcohols. In addition, older PCO technology produces ozone [7, 8].
As indicated by the literature review [9, 10], the use of various air purification techniques carries the risk of generating hazardous concentrations of ozone and oxidized forms of VOCs. The prolonged presence of such compounds in the air poses a significant danger to both humans and animals. When these oxidants come into contact with the skin, body membranes, or lung epithelium, they disrupt redox homeostasis, leading to a condition known as oxidative stress. This condition, which can persist for varying durations depending on the environmental concentration of these harmful oxidants, can subsequently cause inflammation. Pathological changes associated with intratissue processes triggered by these oxidizing environmental factors (e.g., formaldehyde) may include a decrease in antioxidant potential, an increase in the concentration of oxidation products from cellular macromolecules, alterations in the activity of antioxidant enzymes, and, consequently, an increase in the concentration of proinflammatory factors. All these changes can occur locally or affect the entire general system [11]. In addition, none of these techniques is fully effective in reducing contamination on surfaces.
Advanced ActivePure (Advanced AP) is a novel technology based on a photocatalytic process, but it differs from traditional PCO technology in many significant ways. Advanced AP uses UV light to illuminate a target comprised of titanium dioxide and a number of rare earth minerals, producing a wide array of ions and molecules. These molecules and ions are released into the environment, destroying pathogens and pollutants in the air and on surfaces. Unlike traditional PCO technology, which primarily operates within the air purifier unit, Advanced AP operates throughout the room. The presence of ultralow concentrations of these molecules and ions in the air may raise concerns about the risk of inducing increased oxidation processes in humans and animals, resulting in related serious health consequences.
The extensive research efforts on Advanced AP technology have primarily assessed its short-term effects, particularly in the fields of microbiology and airborne particulate matter (PM). A preliminary 90-day evaluation of the Advanced AP system confirmed its lack of impact on the vital parameters of mice and the histological structure of the respiratory system. Findings from multiple studies indicate that the system is capable of controlled hydrogen peroxide emission without ozone-related consequences [12]. Furthermore, effective reductions in bacterial concentrations in the air and on surfaces, as well as a decrease in PM levels in rooms where the Advanced AP system was in operation, have been established [13]. To provide a detailed assessment of the health status of animals exposed to Advanced AP technology, this study was conducted in which mice were exposed to therapeutic levels of Advanced AP for 3 months, and their health status was comprehensively evaluated through the analysis of physiological, biochemical, redox, and histopathological parameters.
2. Methods
2.1. Animals and Housing
The study did not include any procedures that required the approval of the Ethics Committee for Animal Experimentation (statement issued by the Second Local Ethics Committee for Animal Experimentation on 16 June 2021). In this study, the activities performed on animals do not fall within the legal definition of a procedure. The tested Advanced AP device emits minimal sound and vibrations in both audible and inaudible ranges (< 50 dB) and does not produce harmful byproducts. As such, the device does not negatively impact animal welfare. Since the study did not involve interventions that could cause pain, suffering, distress, or harm, it remained within the scope of routine animal husbandry and care, exempting it from the requirement for ethical approval.
The study was conducted on a group of 40 outbred mice (20 males and 20 females) from a line described by [13], which were selected from a total of 300 animals housed in the facility at the Institute of Animal Sciences, Warsaw University of Life Sciences, Poland.
The mice were divided into two groups and housed in two identical rooms, each measuring 58.8 m3, where a 12-h light/dark cycle was maintained. Each room contained three stainless steel racks holding 40 conventional plastic cages (Tecniplast, Milan, Italy) with dimensions of 31 × 16 × 14 cm. There were four animals (male or female) in each cage. The mice had ad libitum access to water and a complete diet (Labofeed H, Morawski, Poland). Animals (30 males and 30 females) in both groups were weighed at the beginning, middle, and end of the experiment. The bedding for the cages consisted of softwood granules (TierWohl Super), which were sterilised using UVC before being added to each cage. For environmental enrichment, paper tubes were added to each cage. Laboratory staff came into the rooms once a day to replace the water and food and perform animal health checks. Before starting the tests, the floors and walls of both rooms were washed with hot steam and then with a commercial agent based on chlorine (Domestos Unilever) solution according to the manufacturer’s instructions. Cage racks were washed with water at 60°C under pressure followed by hot steam and exposed to UVC radiation for 30 min. The mice cages and drinking bottles were cleaned with water and detergent (Ludwik, INCO), then with hot steam, and exposed to UVC radiation for 30 min. According to the manufacturer, the litter was aseptic, and additionally, it was exposed to UVC radiation for 30 min. During the experiment, the floors were washed weekly with Domestos solution (according to the manufacturer’s instructions). The cages and bedding were replaced every 2 weeks, and cage lids and bottles remained the same throughout the experiment.
The intake duct of the ventilation system was equipped with standard F8 fine filters (EN 779:2002). Before the experiment starts, two Advanced AP “Induct 2000” units were installed in the ventilation system, positioned just before the input air, on the central part of the ceiling of the Advanced AP room. The Induct 2000 device was located 1 m above the ground facing the entrance door (Figure 1).
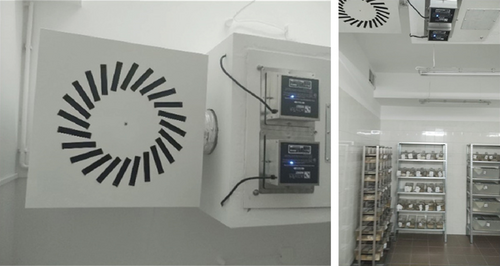
The airflow was consistent at 360 m3/h for both rooms. The Advanced AP levels, as measured by negative ion concentrations, were conducted three times a month using an Air Ion Counter COM-3200 Pro II (Tokyo, Japan). The relative humidity levels and the temperature were determined daily using a thermo-hygro sensor (Techno Line Mobile Alerts MA 10200, Wildau, Germany).
2.1.1. Collection of Animal Samples
On experiment completion, six male and six female mice from each group were euthanised by cervical dislocation. Blood samples from the heart were collected into heparinised tubes, cooled to 4°C, and forwarded for analysis. For histopathological analysis, 12 specimens from each group were collected.
2.2. Health Status Parameters
2.2.1. Haematological Status and Serum Biochemical Parameters
Red blood cell (RBC) count, hematocrit, mean cell volume (MCV), haemoglobin concentration, and white blood cell (WBC) and platelet counts were determined using a CELL-DYN 3700 analyser (GMI, United States). Differential leukocyte counts were performed. Albumins, total protein, glucose, asparagine transferase (ASP), alanine aminotransferase (ALT), and triglycerides assays were performed using a Fuji Dri-Chem NX500i (Fujifilm Corporation, Tokyo, Japan) according to the manufacturer’s recommendations.
2.2.2. Redox Plasma and Lung Parameters
Total antioxidant capacity (TAC) assay kit (STA-360, Cell Biolabs, INC.) was used to evaluate the effect of Advanced AP on antioxidant levels in plasma. Glutathione (GSH) levels in plasma samples were measured using the ELISA Kit (Abbexa, Cambridge, United Kingdom). 8-Hydroxy-2 ′-deoxyguanosine (8-oxo-dG) assay kit (Abbexa, Cambridge, United Kingdom) was used to evaluate oxidative damage to DNA. Absorbance was measured using a Tecan Infinite 200 microplate reader (Tecan, Durham, NC, United States). Glutathione peroxidase-1 (GPx1) and superoxide dismutase-1 (SOD1) concentrations in tissues were measured by ELISA (Abbexa, Cambridge, United Kingdom). Malondialdehyde (MDA), the most abundant product of all lipid peroxidation products, was measured using thiobarbituric acid (TBA) according to [14].
2.2.3. Inflammatory Parameters
The concentrations of tumor necrosis factor alpha (TNF-α), interleukin 6 (IL6), interleukin 8 receptor beta (IL8RB), and heat shock 70 kDa protein 9 (HSPA9) were determined in the extracts using ELISA kits in accordance with the manufacturer’s instructions (Abbexa Ltd, Milton, United Kingdom). The results of the content of the above proteins in the lungs were expressed per milligrams of total protein, as determined using the bicinchoninic acid assay kit (Thermo Fisher Scientific, Waltham, MA, United States).
2.2.4. Histological Analysis
For histopathological analysis, 12 randomly selected mice from each group were euthanized and sampled. Immediately after euthanasia, de-skinned and de-brained murine heads were fixed in Hartman solution (Polysciences) at 4°C for 24 h, after which the solution was changed, and the heads were kept in the same conditions for an additional 24 h. Then, the heads were decalcified in Surgipath Decalcifier I (Leica) at ambient temperature for 24 h. The sample to decalcifying solution volume ratio was approximately 1:10. Subsequently, the samples were dehydrated and underwent a standard paraffin embedding protocol. Whole heads were then cut into 5 μm-thick sections using a Leica RM2265 microtome (Leica). Slides from each individual were stained with hematoxylin–eosin.
For NF-κB detection, polyclonal, rabbit, NF-κB antibody (No. ab16502, Abcam) in a 1:50 dilution was used. Incubation with anti-NF-κB antibody was for 60 min at ambient temperature. A citrate buffer was used for heat-induced epitope retrieval (HIER). A peroxidase detection system (Dako) coupled with chromogen detection (Dako) was used for visualization in accordance with the manufacturer’s recommendations. The samples were counterstained with Harris hematoxylin (Mar-four). The stained sections were analyzed and photographed with a Nikon Eclipse 90i microscope equipped with a Nikon DFSI3 camera using NIS-Elements AR 5.01.00 software (Nikon).
The left eye was chosen for cornea examination. The whole cornea and corneal epithelium thickness (micrometers) were measured in the midsagittal plane in its middle part. For the histological examination of the nasal tissues, frontal sections of the nasal cavity were used. The nasal epithelia were evaluated in three planes as suggested by Herbert et al. [15] and measured in the third plane. Respiratory epithelium (RE) was measured on the upper lateral wall of the maxillary sinus near the nasal chamber and on the lateral wall of the sixth ethmoid turbinate near the vomeronasal organ. Olfactory epithelium (OE) was measured at the bottom part between the third and fourth ethmoid turbinates [16]. All measurements were made using the ImageJ 1.53 (National Institutes of Health, United States) software.
2.2.5. Statistical Analysis
Statgraphic 4.1 (StatPoint, Inc., Herndon, VA, United States) was used for one-way analysis of variance (ANOVA) and Duncan’s multiple range test. Differences were considered significant at p < 0.05. The statistical analyses of the eosinophils, monocytes, and epithelial measurements were performed using Mann–Whitney U test in the Statistica 13 (StatSoft) software. Normality was assessed using the Shapiro–Wilk test, and equality of variances was checked with Levene’s test.
3. Results
3.1. Environmental Condition Parameters
As detailed in the Methods, the levels of Advanced AP (as measured by negative ions), temperature, and humidity were measured over a 3-month period in the control and Advanced AP rooms. These results are presented in Table 1. Please note that the temperature and relative humidity levels were essentially identical and constant in the Advanced AP and control rooms throughout the entire 90-day test period. The only significant difference between the test and the control room parameters was the level of Advanced AP. Importantly, the levels of Advanced AP were stable during the 90-day test period. Advanced AP output of > 350 negative ions/cc has been shown in multiple studies to be therapeutic (i.e., effective) against viruses, bacteria, and fungi [17–19].
| Parameter | Day 30 | Day 60 | Day 90 | |||
|---|---|---|---|---|---|---|
| Control | AP | Control | AP | Control | AP | |
| Temperature (°C) | 21.2 ± 0.6 | 21.2 ± 0.5 | 21.7 ± 0.5 | 21.4 ± 0.5 | 21.6 ± 0.8 | 21.7 ± 0.8 |
| Relative humidity | 50.2 ± 4.1 | 49.0 ± 2.5 | 51.4 ± 4.5 | 51.6 ± 3.8 | 52.3 ± 3.2 | 50.7 ± 3.9 |
| Advanced AP levelsa | 104.4 ± 36.7 | 524.4 ± 15.5 | 114.4 ± 12.3 | 536.7 ± 24.0 | 105 ± 26.7 | 543.3 ± 32.1 |
- Note: Data concerning environmental condition values are expressed as the average ± standard deviation of the mean (temperature, humidity, n = 30; negative ions, n = 5).
- aThe Advanced AP output as measured by the number of negative ions per cc of air.
3.2. Mouse Body Weights
The weights of the control and Advanced AP-exposed mice were determined during the course of the 90-day experiment as described in the Methods and are shown in Table 2. Please note that the mean body weight of the Advanced AP-exposed mice and the control mice was not different, indicating that Advanced AP had no effect on the weight gain of the mice.
| Parameter | Day 1 | Day 45 | Day 90 | |||
|---|---|---|---|---|---|---|
| Control | AP | Control | AP | Control | AP | |
| Body weights (g) | 51.5 ± 3.9 | 52.6 ± 3.6 | 57.3 ± 4.3 | 58.9 ± 4.2 | 60.7 ± 4.9 | 59.6 ± 4.1 |
- Note: ±Standard deviation of the mean (n = 60).
3.3. Haematological Parameters
At the conclusion of the 90-day experiment, the haematological parameters of mouse peripheral blood were determined as described in the Methods. These results are presented in Table 3. It is important to note that there were no significant differences (p > 0.05 in all cases) between each of the values between the control and the Advanced AP-exposed mice.
| Parameters | Control | AP |
|---|---|---|
| RBC (T/L) | 9.1 ± 0.5 | 8.9 ± 0.7 |
| Haematocrit (%) | 50.7 ± 3.8 | 47.1 ± 11.3 |
| MCV (fl) | 56.0 ± 2.4 | 55.6 ± 4.1 |
| Haemoglobin (mmol/L) | 14.3 ± 0.6 | 14.2 ± 1.2 |
| WBC (G/L) | 3.6 ± 1.0 | 3.31 ± 0.9 |
| Neutrophils (%) | 34.6 ± 10.2 | 32.3 ± 11.0 |
| Eosinophils (%) | 0.0 ± 0.0 | 0.08 ± 0.3 |
| Monocytes (%) | 0.17 ± 0.4 | 0.08 ± 0.3 |
| Lymphocytes (%) | 65.1 ± 10.3 | 65.7 ± 10.6 |
| Platelets (G/L) | 584.4 ± 106.5 | 564.3 ± 90.4 |
- Note: Data are expressed as mean ± standard deviation of the mean (n = 10).
- Abbreviations: MCV = mean corpuscular volume, RBC = red blood cells, WBC = white blood cells.
3.4. Blood Serum Biochemical Parameters
At the conclusion of the 90-day experiment, the blood serum chemistry values were determined as described in the Methods section. These results are presented in Table 4. Please note that the levels of glucose, triglycerides, ALT, aspartate aminotransferase (AST), and total protein were not statistically significantly different between the control and Advanced AP groups. Notably, albumin levels were statistically significantly increased in the Advanced AP-exposed group (41.52 ± 1.4 g/L) compared to the control group (39.4 ± 1.8 g/L), denoted by “∗” p < 0.05 (Table 4).
| Parameters | Control | AP |
|---|---|---|
| Glucose (mmol/L) | 6.3 ± 1.1 | 6.4 ± 0.8 |
| Triglycerides (mmol/L) | 1.8 ± 0.1 | 1.9 ± 0.3 |
| ALT (U/L) | 48.1 ± 15.3 | 52.5 ± 8.7 |
| AST (U/L) | 102.9 ± 16.8 | 90.1 ± 19.1 |
| Albumin (g/L) | 39.4 ± 1.8∗ | 41.52 ± 1.4∗ |
| Total protein (g/L) | 54.7 ± 2.5 | 55.8 ± 2.1 |
- Note: Data are expressed as mean ± standard deviation of the mean.
- Abbreviations: ALT = alanine aminotransferase, AST = aspartate aminotransferase.
- ∗Significantly different at p < 0.05 (n = 10).
3.5. Redox and Inflammatory Markers in Sera From Control and Advanced AP-Exposed Mice
Redox markers levels in the sera of both groups were determined as described in the Methods. These results are presented in Table 5. Please note that there were no statistically significant differences in TAC, GSH levels, and 8-oxo-dG concentrations between the two groups (Table 5).
| Parameters | Control | AP |
|---|---|---|
| TAC (mM) | 1950 ± 530 | 2087 ± 440 |
| Glutathione (μg/mL) | 18.2 ± 3.7 | 21.3 ± 3.5 |
| 8-oxo-dG (μg/mL) | 11.8 ± 0.8 | 12.1 ± 0.4 |
- Note: Data are expressed as mean ± standard deviation of the mean (n = 6).
- Abbreviations: 8-oxo-dG = 8-hydroxy-2 ′-deoxyguanosine, TAC = total antioxidant capacity.
Redox markers levels in the lungs of both groups were determined as described in the Methods. These results are presented in Table 6. Please note that the levels of GPx and TBARS were not different between the two groups. In contrast, the superoxide dismutase (SOD) levels showed a statistically significant difference, with the control group displaying a higher concentration (4.4 ± 0.9 pg/g tissues) compared to the Advanced AP-exposed group (3.0 ± 0.7 pg/g tissues).
| Parameters | Control | AP |
|---|---|---|
| SOD (pg/g tissues) | 4.4 ± 0.9∗ | 3.0 ± 0.7∗ |
| GPx (μg/g tissues) | 34.17 ± 4.7 | 32.79 ± 5.5 |
| TBARS (μg/g tissues) | 2.7 ± 0.07 | 2.7 ± 0.05 |
- Note: Data are expressed as mean ± standard deviation of the mean.
- Abbreviations: GPx = glutathione peroxidase, SOD = superoxide dismutase, TBARS = thiobarbituric acid reactive substances.
- ∗Significantly different at p < 0.05 (n = 6).
The analysis of inflammatory parameters within mice lungs was as described in the Methods. Please note that the levels of TNF, IL-6, and IL-8 in the control group and in the Advanced AP-exposed group were not significantly different. Additionally, the levels of heat shock protein in the control group and the Advanced AP group were not significantly different (Table 7).
| Parameters (pg/mg total protein) | Control | AP |
|---|---|---|
| TNF | 207.5 ± 77.1 | 209.7 ± 68.9 |
| IL-6 | 100.8 ± 14.7 | 94.4 ± 20.0 |
| IL-8 | 1.3 ± 0.6 | 1.0 ± 0.4 |
| HSP | 361.2 ± 192.6 | 285.7 ± 43.7 |
- Note: Data are expressed as mean ± standard deviation of the mean (n = 6).
- Abbreviations: HSP = heat shock protein, IL = interleukin, TNF = tumor necrosis factor.
3.6. Histological Parameters
3.6.1. Cornea
The thickness of the corneas and corneal epithelium of Advanced AP-exposed and control mice was determined as described in the Methods. These results are presented in Table 8.
| Control | AP | |
|---|---|---|
| Corneal thickness | 82.24 ± 13.02 μm | 77.09 ± 4.19 μm |
| Corneal epithelium | 33.92 ± 3.66 μm | 34.88 ± 2.83 μm |
- Note: ±Standard deviation of the mean.
We found that there were no differences in either the thickness of the cornea or in the thickness of the corneal epithelium between these groups, and no major corneal tissue lesions were observed in mice from either the control group or the Advanced AP-exposed group.
The corneal epithelium consisted of one layer of basal cells, one to three layers of intermediate wing cells, and two to three layers of superficial mature cells. Basal cells showed differentiation in their morphology. The most prominent were the cuboidal and puffy cells with a roundish nucleus located close to the basal membrane. Narrower columnar cells, with the nucleus located above the basal cell row, were seen, although sparsely, in addition to the least frequent thin columnar cells with a squished nucleus located between the puffy cells (Figure 2a,b). The mature cell layer rarely showed very mild desquamation in singular specimens from both the control and Advanced AP-exposed groups (Figure 2c). The majority of the cornea was composed of the corneal stroma. The corneal stroma was similar in both groups and was built by collagen fibers and keratocytes (Figure 2a,b). Very mild focal lymphocyte infiltrations were noted in this structure in two specimens from the control and one from the Advanced AP-exposed group (Figure 2d). Additionally, singular immune cells, namely, lymphocytes and neutrophils (Figure 2e), were seen in one specimen from the control group and in one specimen from the Advanced AP-exposed group. Moreover, a few mastocytes were seen in this layer (Figure 2f). The endothelium was composed of a singular layer of cells, yet in most of the studied individuals, it was mildly vacuolized (Figure 2a,b). Vacuolization was seen in all specimens from the control group and in half of the specimens from the Advanced AP-exposed group. In the studied corneas, regardless of the group, no NF-κB positive cells were seen (results not shown).
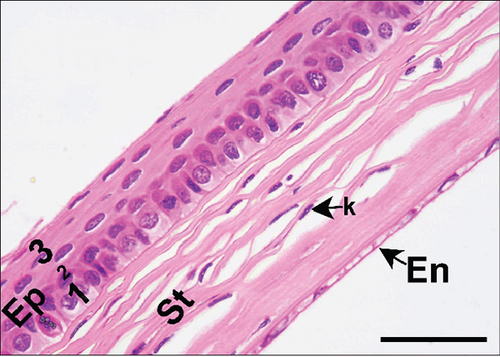
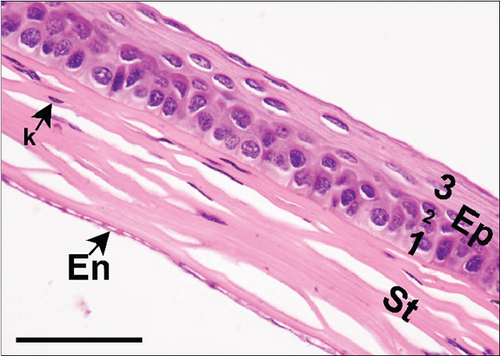
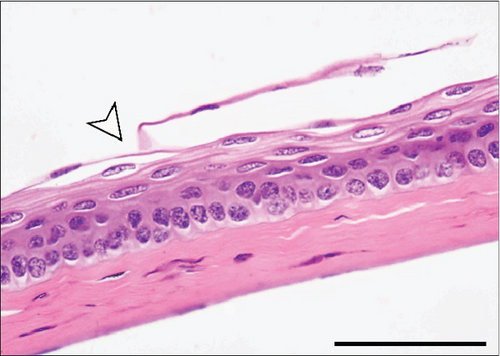
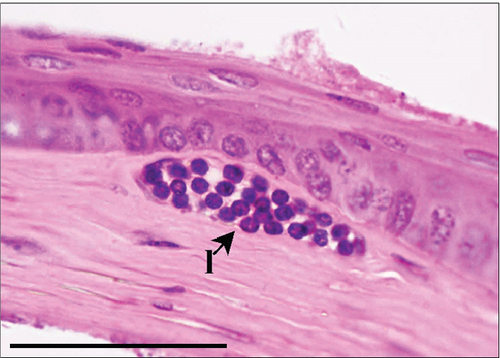
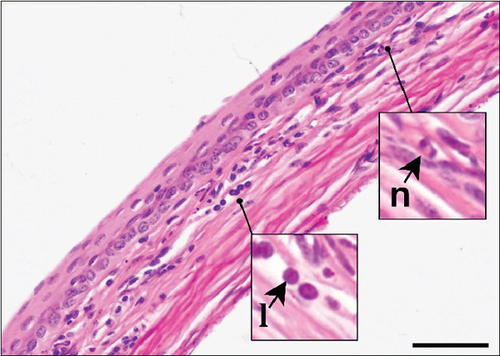
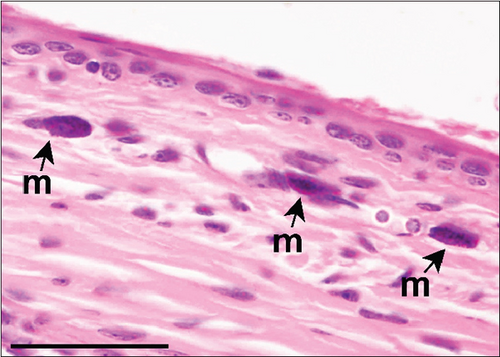
From these results, we conclude that there were no significant histopathological alterations in the cornea of the control and Advanced AP-exposed mice. That is, Advanced AP had no effect on corneal histology.
3.6.2. Nasal Tissue
As described in the Methods section, we examined the histology of nasal cavity RE and OE. We initially measured the thickness of the RE in the maxillary sinus and in the sixth ethmoid turbinate. These results are presented in Table 9.
| Nasal epithelium location | Control | AP-exposed |
|---|---|---|
| RE of maxillary sinus | 23.04 ± 1.43 μma | 20.63 ± 1.81 μma |
| RE of 6th ethmoid turbinate | 24.51 ± 4.59 μm | 20.62 ± 3.45 μm |
| OE | 39.14 ± 4.19 μm | 39.26 ± 6.08 μm |
- Note: ±Standard deviation of the mean.
- aSignificantly different at p < 0.05.
In the control group, RE thickness in the maxillary sinus was slightly, although significantly, thicker than RE in the Advanced AP group. RE was also measured on the sixth ethmoid turbinate, yet no differences in the thickness of this epithelium were seen between the control and Advanced AP groups. The thickness of OE was also similar between the two groups. Similarly to the corneas, no major lesions were found in the nasal cavity epithelia of mice from either the control group or the Advanced AP-exposed group.
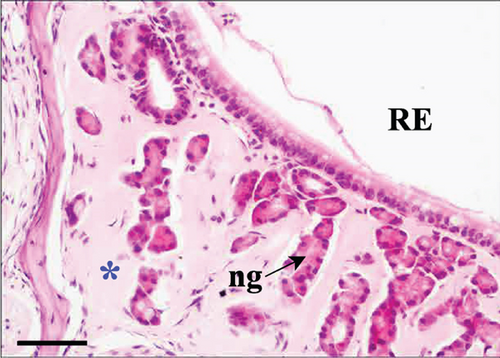
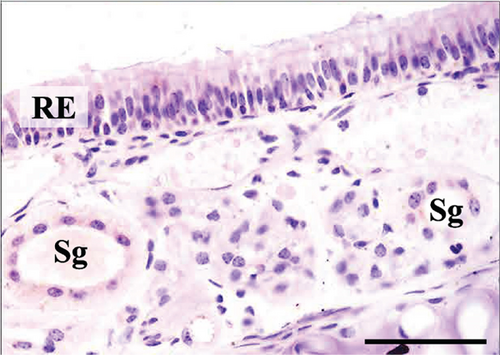
In the third plane, the RE lining the maxillary sinus was predominately pseudostratified ciliated columnar epithelium. Between the ciliated cells a few nonciliated and goblet cells were seen, along with basal cells near the basal lamina. The lamina propria under the RE epithelium contained prominent lateral nasal glands (Steno’s glands). In both control and Advanced AP-exposed groups, the structure of RE epithelium lining maxillary sinus was similar (Figure 3a,b).
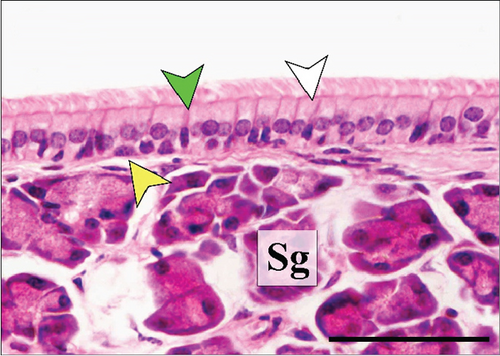
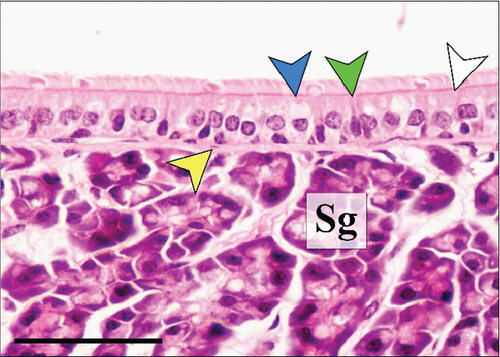
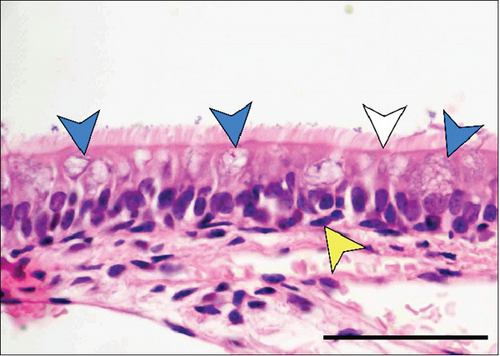
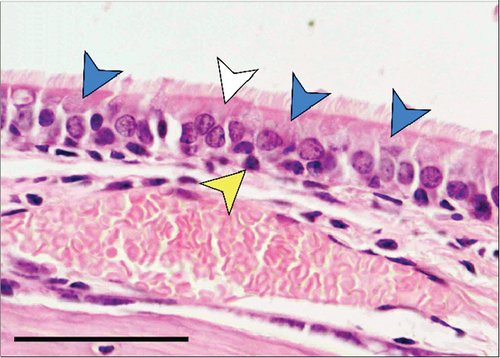
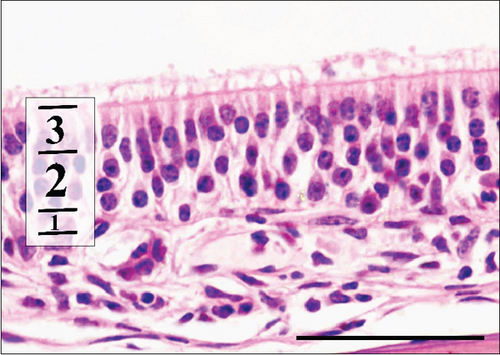
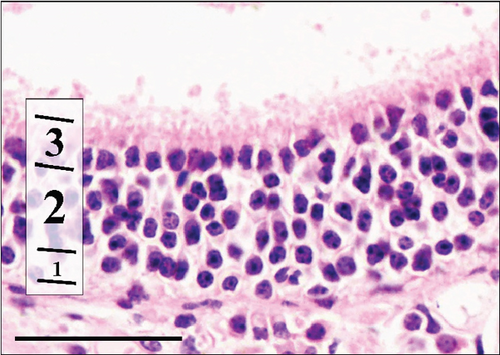
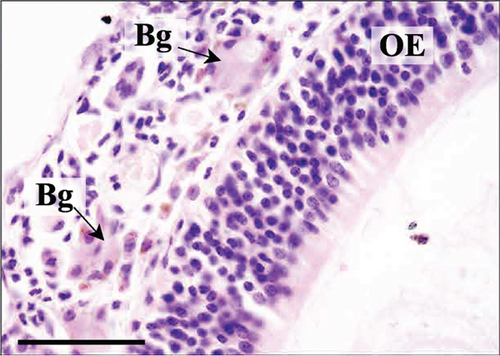
The RE lining the sixth ethmoid turbinate was similar to that lining the maxillary sinus. The observed cell types were the same; however, more goblet cells were present in this part of the airways, and the lamina propria did not contain large glands in both control and Advanced AP-exposed groups (Figure 3c,d). Olfactory mucosa consisted of OE and lamina propria with Bowman’s glands and olfactory axons. Similarly to RE, OE was a pseudostratified columnar epithelium. The basal lamina was observed to be less pronounced in OE than the one seen in RE, and no abnormal thickening was observed regardless of the group. In the OE, three types of cells were present: basal cells located at the basal lamina, a singular layer of supporting (sustentacular) ciliated cells located on the laminar surface of the epithelium, and a few layers of bipolar sensory neurons, located between the supporting and basal cells (Figure 3e,f). There were no goblet cells in this epithelium, and the secretion seen on the OE was produced by Bowman’s glands.
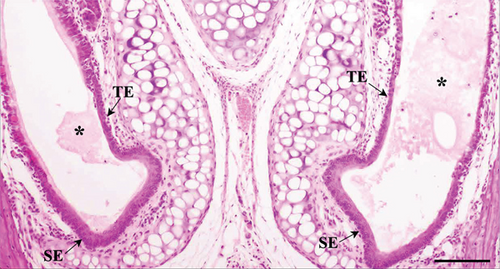
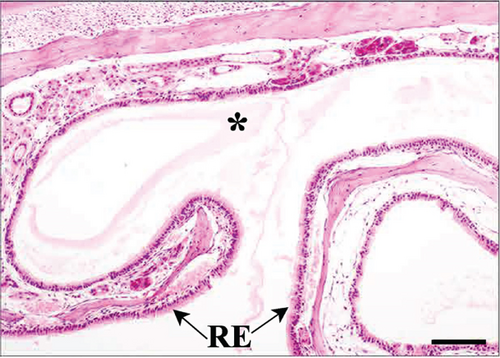
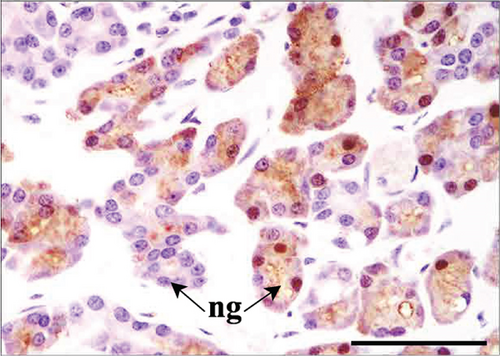
As suggested above, in both control and Advanced AP-exposed groups, no major lesions were noted in murine nasal mucosa tissues. In the second plane, excessive fluid was seen in two specimens from the control and two specimens from the Advanced AP-exposed group. The fluid was observed in the nasal cavity near the vomeronasal organ (Figure 4a) and near naso- and maxilloturbinates (Figure 4b). Moreover, in one specimen from the control group, thickening of septal mucosa was noted along with eosinophilic substance accumulation near the vomeronasal organ (Figure 4c). All specimens from the control group and one from the Advanced AP-exposed group had NF-κB positive cells in nasal tissues; however, it occurred mainly in cellular cytoplasm. Positive nuclear NF-κB reaction was noted only in the septal glands of a single specimen from the Advanced AP-exposed group (Figure 4d) and was not observed in any of the evaluated epithelial tissues. The strongest positive cytoplasmic reaction was observed in squamous epithelium (SE) in one specimen from the control group (in the first plane) (Figure 4e). In the rest of the epithelia, namely, in RE, transitional epithelium (TE), and OE, the cytoplasmic reaction, if detected, was very weak. It was detected in the RE of two specimens, one from the control and one from the Advanced AP-exposed group (Figure 4f), while in OE, it was noted in three specimens from the control group only (Figure 4c). Moreover, a weak cytoplasmic reaction was often seen in lamina propria underneath nasal epithelia (Figure 4f,g).

4. Discussion
Due to the lack of literature on devices identical to the Advanced AP technology, the comparative analysis of the literature was carried out mainly in relation to PCO air purification technologies consequences. Photocatalytic systems generate oxidants that react with VOCs, which consequently leads to the production of an array of unintended byproducts, including aldehydes, phosgene, and chlorinated VOCs. Therefore, the safety assessment of Advanced AP will be discussed in the context of the harmful effects of reactive oxygen species (ROS) and some byproducts present in the air.
4.1. Environmental Condition Parameters
The biological load, measured in the number of animals present in the room, as well as the airflow, temperature, and humidity, was maintained at a constant level throughout the entire experiment. These conditions enabled the maintenance of a relatively stable negative ion concentration, that is, Advanced AP output (please see Table 1). Studies conducted by Dexter et al. [17] in a certified research facility confirmed the effectiveness of similar doses of negative ions in the air in reducing the bacteriophage MS2 and the gram-positive bacterium Staphylococcus epidermidis in aerosol form (S1). These studies were conducted in accordance with the stringent guidelines outlined in the Association of Home Appliance Manufacturers (AHAM) AC-5 and aligned with both AHAM and the American Society of Heating, Refrigerating and Air-Conditioning Engineers (ASHRAE) 241 criteria. In addition, Selitrennikoff et al. [12] confirmed that AP technology does not produce ozone, which is also supported by other studies on this technology [19, 20].
4.2. Haematological Status and Serum Basic Biochemical Parameters
Advanced AP technology exposure for 90 days did not change haematological parameters in mice. Acute ozone exposure (3 ppm) increases RBC, Hb, and Ht levels [21]. VOCs could potentially increase MCV by causing RBC swelling, as seen in formaldehyde-exposed rats [22]. Rats exposed to polluted air showed increased WBC and neutrophil levels and decreased lymphocyte levels [23]. Ozone exposure significantly increased WBCs in mice [21]. In contrast, Advanced AP devices do not affect any of the Advanced AP-exposed mice haematological indicators except for albumin concentration. Potential VOCs and their derivatives, including ROS, should be considered for AP toxicity. These could induce insulin resistance and increase blood glucose levels [24]. Miller [25] found increased blood sugar and abnormal glucose tolerance in Wistar rats exposed to ozone (0.5–1.0 ppm). AP technology generates stable, less reactive hydrogen peroxide at much lower concentrations than ozone. Studies found no difference in blood glucose levels in rats exposed to formaldehyde [26]. This study also found no glucose concentration differences by Day 90. Plasma triglycerides are potential indicators of hepatotoxicity [27]. No changes in triglyceride levels were observed in rats with formaldehyde or ozone exposure [26, 28]. This study also noted no differences in plasma triglyceride levels between groups by Day 90. Albumin concentration increased in Advanced AP-exposed mice, potentially indicating liver function alterations. Elevated albumin may result from dehydration, chronic inflammation, or liver hyperactivity. High ozone concentrations are needed to increase this plasma marker, while VOC byproducts like formaldehyde do not affect these biochemical markers [28, 29]. The Advanced AP device’s ultralow hydrogen peroxide doses did not induce oxidative mechanisms, and individual mouse variability might explain the observed differences in biochemical markers between groups. However, several factors suggest that the observed increase in albumin levels was not a consequence of dehydration, inflammation, or oxidative stress. First, there was no evidence of dehydration among the animals, as their water intake was not restricted, and body weight measurements showed no significant reductions. Additionally, no significant changes were observed in total protein levels, hematocrit, or RBC counts, which are commonly used indicators of hydration status. If dehydration had been a factor, we would have expected an increase in total protein levels alongside albumin. Second, chronic inflammation is also unlikely, as inflammatory markers, including TNF-α, IL-6, and IL-8, showed no significant differences between the control and Advanced AP-exposed groups. Additionally, histological evaluations did not indicate inflammatory changes in the liver or other tissues.
Given these observations, the slight increase in albumin levels in Advanced AP-exposed mice may be attributed to individual variability rather than a direct physiological response to Advanced AP technology.
4.3. Oxidation and Reduction Status
Devices such as ionizers, hydroxyl radical generators, and ozone generators produce reactive species that result in oxidized VOCs and PM. These oxidants and newly formed compounds often have pro-oxidative, proinflammatory, and carcinogenic effects [2]. The Advanced AP system produces low doses of H2O2, which have not shown negative health effects [13, 30]. The body’s redox state, indicated by various markers, can shift towards oxidative stress, leading to inflammation and organ dysfunction. In this study, the redox homeostasis of mice exposed to the AP system remained stable. VOCs from PCO systems can have strong pro-oxidative effects. Studies show decreased levels of GSH, vitamin C, and β-carotene in organs of rats exposed to air pollution [23]. Formaldehyde exposure increased total GSH and TBARS in lungs [31], and ozone inhalation increased lung GSH [32]. Notably, SOD expression decreased in lungs exposed to ultralow H2O2 concentrations from the AP system. Lungs are protected by antioxidants, including SODs, which convert superoxide radicals to H2O2. In a cellular model, H2O2 treatment reduced intracellular GSH and SOD activity [33]. Although H2O2 can inhibit SOD activity [34], numerous enzymatic mechanisms degrade H2O2 in the lung. The stability of redox homeostasis in this study is evident as there were no increases in lipid peroxidation or lung proinflammatory factors. MDA, a marker of oxidative lipid damage, indicates ROS’s mutagenic and carcinogenic effects [13, 35]. In this study, TBARS and 8-oxo-dG levels in lung and blood plasma did not differ between the Advanced AP-exposed and control groups. Exposure to 0.1 mL of 20 mM H2O2 increased MDA in rat lungs [36]. In vitro lung cell studies commonly recognize H2O2 as a pro-oxidative agent [37]. Air pollution exposure increased TBARS in all organs of rats [23]. Ozone exposure increased lipid oxidation products in lung cells [28]. Formaldehyde exposure increased ROS and MDA in all examined organs [38].
4.4. Inflammatory State
Previous studies reported secondary pollutant formation from ionizers, PCO systems with UV lamps, electrostatic precipitators, and plasma systems [4, 9, 10]. Secondary VOC oxidation products forming secondary organic aerosol have been shown to induce cellular ROS generation, inflammatory cytokine production, and oxidative modification of RNA [39]. The induction of inflammatory mediators is regulated by the activation of redox-sensitive transcription factors, such as NF-κB, which are stimulated in response to oxidants and inflammatory cytokines like TNF, IL-8, and IL-6. These proinflammatory mediators released during inflammation play crucial roles in the recruitment and activation of immune and inflammatory cells. Results showed no induction of proinflammatory processes (TNF, IL-6, and IL-8) or cellular stress (HSP) in the lungs of animals after 90 days of Advanced AP exposure, aligning with the organ’s oxidative status (TBARS). Advanced AP technology is designed to eliminate pollutants without producing proinflammatory agents. In high concentrations, hydrogen peroxide induces oxidative states and proinflammatory compounds. Moodie et al. [40] found that 100 μM H2O2 increased IL-8 and IL-6 release and NF-κB activation in alveolar epithelial cells. Zhang et al. [36] reported that H2O2 in rat lungs induced TNF-α, IL-6, and IL-1β expressions. Zmijewski et al. [41] showed that high H2O2 levels have anti-inflammatory effects by inhibiting proteasome activation and reducing NF-κB-dependent cytokine expression in neutrophils. VOCs from POC systems, like ozone and formaldehyde, induce inflammation dose-dependently. Ozone triggers oxidative stress, activating Nrf2, HSP 70, and NF-κB and increasing proinflammatory cytokines and chemokines. Bornholdt et al. [42] observed a 150-fold IL-6 mRNA increase in lung homogenates of mice exposed to ozone. Kumarathasan et al. [43] detected reactive metabolites in mice exposed to ozone and air particles. Silva MacEdo et al. [44] reported formaldehyde inhalation induced COX-2 in rat lungs. Zhang et al. [45] found formaldehyde induced NF-κB, TNF-α, and IL-1 in mouse bone marrow tissues after exposure.
4.5. Histological Evaluation
In our study, the histopathological analysis focused on tissues that had direct contact with ROS generated by Advanced AP technology. Due to their high reactivity and short half-life, the effects of ROS are limited to the sites of direct exposure [46]. Consequently, the analysis was concentrated on organs whose epithelia could be directly exposed to external ROS produced by Advanced AP technology, specifically the eye and upper respiratory tract. The cornea is one of the outer barriers of the eye and, as such, is exposed to damaging ocular toxicants from the environment to the highest extent [47].
To verify if Advanced AP can cause eye injury, the cornea was histologically examined. In mice, OE constitutes around 45%–50% of the nasal surface area while RE covers up to 46%; hence, most toxicological studies focus on these epithelia [48]. The nasal mucociliary apparatus, built by mucus and cilia, exhibits a range of responses to inhaled agents and can be a sensitive indicator of toxicity. It is one of the first lines of defense against inhaled pathogens, dusts, and irritant gases, compromising the defense capabilities of the apparatus, which could lead to a higher nasal infection rate and increased susceptibility to lower respiratory tract diseases [47]). Nevertheless, the possibility of systemic histopathological effects of ROS generated by Advanced AP technology in other organs cannot be excluded, although it is considered unlikely.
In the studied mice, very mild alterations in cornea tissues were observed in both groups, and there is no evidence that they are directly or indirectly related with Advanced AP exposure. Slight desquamation observed in the control and Advanced AP-exposed groups did not result in any erosion of the epithelial layer and no epithelial hypo- or hyperplasia or degenerative or regenerative changes were noted. Moreover, total cornea thickness in both groups was not statistically different and was within the range observed by other authors [49]. The corneas of mice exposed to ROS-generating UV-light display epithelial hyperplasia and dysplasia and also stromal thinning, and collagenolysis [50]. In the present study, no such morphological changes were observed. However, vacuolization was seen in the corneal endothelium of the majority of specimens; it was most likely related with the endothelium function, which takes part in water and electrolytes transport between the corneal stroma and the anterior chamber [51].
In air contaminated with ethanol, exposure to UV-PCO leads to the formation of acetaldehyde and formaldehyde [52]. Moreover, in livestock housing where animals are present, increased concentrations of dimethyl sulfide (DMS) are observed, which, under the influence of UV-PCO, can also transform into formaldehyde and acetone [53]. These compounds may cause irritation of the eyes, nose, throat, mucous membranes, and respiratory tract. Long-term exposure to these substances induces neoplastic processes [54] that are associated with oxidative stress and inflammation. In this study, no clear evidence was found as to whether Advanced AP exposure caused histopathological alterations in nasal mucosa tissues. The only difference between the Advanced AP-exposed and control groups was noted in the RE epithelial thickness covering maxillary sinuses. In the Advanced AP-exposed group, it was slightly thinner than in the control group, which might suggest hypoplasia or that AP treatment prevents epithelial hyperplasia. Nasal mucosa tissue hypoplasia is a highly infrequent occurrence, and most described toxic agents induce epithelial hyperplasia [55]. Some studies showed that hydrogen peroxide may negatively impact RE function, causing epithelial cell death and disorganization in epithelial structure [56, 57]. However, the observed variance in RE height was not associated with an altered tissue morphology; therefore, it can be concluded that it was most probably a result of differences between individuals or discrepancies arising from the precision of the cutting plane.
In the present study, single cases of cytoplasmic NF-κB reactions in the nasal cavity were found. Generally, mice from the control group displayed a higher tendency for the occurrence of this factor in the cellular cytoplasm. However, in the one from the Advanced AP-exposed group, the reaction was observed with translocation to the nucleus, which suggests the activation of the transcription function of NF-κB. The studies showed that exposure to ozone increased inflammation in a dose-dependent manner by, for example, the activation of NF-κB [58], while for its secondary ROS, hydrogen peroxide, the effect is much weaker even at high doses [59]. Considering the fact that the Advanced AP device used in this study does not emit ozone and the emitted levels of hydrogen peroxide were very low, the observed process in the septal gland was most probably not connected with the treatment. Other cases of NF-κB detection were characterized mainly by weak cytoplasmic epithelial and dermis reactions, which are probably connected to the constitutive NF-κB activity in airway epithelia. It was previously demonstrated by the comparison of normal mucosa and chronically inflamed polyps that NF-κB activity in nasal epithelia is not always connected with the inflammation process, and it may be activated without apparent stimulation [60]. Most likely, independently from the inflammatory state of the tissue, the constitutive activity of NF-κB takes part in airway defense, given its role regulating genes involved in the immune response [61].
Additionally, ROS exposure can cause irritation and airway hyperreactivity [62]. According to Larsen et al. [63], mucus production significantly increased in the respiratory tract in mice exposed to ozone in a dose-dependent manner. Hydrogen peroxide can also be irritating to the mucous membranes in the airways [64, 65]. In this study, mildly increased production of fluid in the nasal cavity was found in subjects from both groups at the same frequency; therefore, it does not indicate an association with the use of the experimental agent. Also, a singular case of accumulation of eosinophilic fluid is most probably not related to the studied agent, as it was observed in the control group. Currently, there is no documented correlation between ROS exposure and the accumulation of the eosinophilic substance. This substance is usually noted in the nasal septum, as it is mainly produced by nasal gland cells [66–68]. The grade of its deposition increases with age, and it mainly applies to males [67]. The physiological significance of this substance is not clear. However, it was suggested that it dissolves nonvolatile chemical stimuli to facilitate the reception of chemical signals and to purge secretions [69]. It is also supposed that it may be deposited to fill the interspaces of the nasal glands [67].
5. Conclusion
Advanced AP technology may be regarded by many as potentially risky, even hazardous, due to its emission of oxidative compounds, which can raise concerns. This concern is linked to the environmental release of ROS through photocatalytic transformations. Moreover, active oxygen, when reacting with VOCs, can be a source of many compounds hazardous to the health of humans and animals. The overall health status of animals exposed for 90 days to therapeutic levels of Advanced AP took into account morphologic and biochemical blood factors. Regarding both the percentage of white and RBCs, as well as the overall biochemical profile of plasma, including the total antioxidative–oxidative potential, mice exposed to Advanced AP were just as healthy as the animals in the control group. The animals were evaluated at their most sensitive sites to irritant/oxidative actions. Eye and nasal cavity examinations revealed no histopathological changes, including inflammatory processes, from therapeutic levels of Advanced AP. Likewise, the respiratory system tissues were free from changes.
In summary, as detailed above, we did not observe any negative changes in the health status of the animals after 90 days of exposure to Advanced AP.
While this study provides a comprehensive assessment of inflammation and oxidative stress markers, it is important to acknowledge its limitations. The analysis focused primarily on these parameters and did not extend to other potential long-term risks such as endocrine disruption, organ dysfunction (e.g., cardiac, hepatic, renal, reproductive, neuronal, and metabolic effects), or carcinogenicity. The absence of adverse effects in the analyzed variables suggests a lack of major health risks, but it does not exclude the possibility of other biological impacts outside the measured endpoints. Future research should incorporate a broader scope of physiological and pathological assessments to ensure a complete safety evaluation of Advanced AP technology.
Disclosure
The funder had no role in the study design, data collection and analysis, decision to publish, or in the preparation of the manuscript.
Conflicts of Interest
The authors declare no conflicts of interest.
Funding
This work was supported by Contract Number PB 14/2021 from ActivePure Manufacturing, Dallas, TX, United States. The publication fee was financed by the Science Development Fund of the Warsaw University of Life Sciences—SGGW.
Open Research
Data Availability Statement
The data that support the findings of this study are available from the corresponding author upon reasonable request.


