Assessment of Air Curtain Control Efficacy in Preventing Contaminant Transmission in Cleanrooms
Abstract
Maintaining high air cleanliness in cleanrooms is crucial in manufacturing processes and scientific research. However, personnel movement can breach the sealed environment, allowing contaminant to enter cleanrooms due to disturbance created. Air curtains are a traditional solution to limit air exchange, but their control efficacy in preventing contaminant transmission into cleanrooms requires careful evaluation. In this study, factors influencing the air curtain control efficacy such as the air curtain’s supply area, personnel movement speed, and temperature difference were evaluated using computational fluid dynamics with dynamic grid technology. The results indicated that increasing the air curtain’s supply area reduced contaminant concentration in cleanrooms; however, the effectiveness in blocking contaminant transport did not improve beyond a certain supply area (0.4 m2). High personnel movement increased contaminant influx, and maintaining a low speed (0.25 m/s) significantly reduced the overall influx. As the personnel movement speed increased from 0.25 to 1.50 m/s, the total amount of contaminant increased from 2.5 × 10⁻⁸ to 7 × 10⁻⁷ kg/s. When the temperature difference decreased from 7°C to 1°C, the average dimensionless concentration of contaminant in cleanrooms after personnel movement decreased from 8.5 × 10⁻³ to 1 × 10⁻⁴. Generally, air curtains perform well but require precise design. On the basis of these findings, future research can further complement overlooked factors and enable more detailed design and control, thereby improving the efficiency and sustainability of cleanroom design and control strategies.
1. Introduction
Cleanrooms are artificial environments where parameters such as air cleanliness, temperature, humidity, pressure, and bioaerosols are strictly controlled to meet specific manufacturing or scientific research requirements [1]. Cleanrooms are widely used in industries like semiconductors, electronics, aerospace, and biomedicine to ensure products remain uncontaminated, prevent malfunctions, and protect personnel from hazards [2, 3]. Maintaining clean conditions is essential to prevent product contamination, malfunctions, and potential harm to personnel. The International Organization for Standardization (ISO) has established different levels of cleanrooms based on the concentration of particulate matter in the air; the lower the particulate concentration, the higher the cleanliness level. These levels are critical indicators for assessing environmental cleanliness [4].
To ensure strict control of air cleanliness, it is essential to eliminate indoor contaminant and external disturbances. Indoor contaminant is primarily addressed through airflow pattern design, which significantly impacts air circulation and energy consumption. Some have adopted local high-efficiency filters, which are highly effective in removing contaminant but can affect airflow velocity and the control of temperature and humidity within the cleanroom [5]. More importantly, these methods cannot isolate the room from external influences. Cleanrooms are typically isolated from external impacts by creating a highly sealed environment. This airtightness is mainly achieved through the use of efficient filtration of incoming air in the HVAC system and the maintenance of a pressure differential between the cleanroom and the outside environment. The ventilation system of the laboratory generally relies on high-efficiency filters to ensure the cleanliness of the incoming air. These filters effectively remove particulate matter, bacteria, and other contaminant from the air [6]. External contamination is primarily controlled through pressure differential management. Pressure differential control prevents contaminant from entering the cleanroom through gaps or door seams by maintaining a pressure difference between the interior and exterior [7]. This method effectively blocks contaminant, stabilizes airflow, and is suitable for graded area management. Researchers have developed a data-based model linking cleanroom air supply volume to residual air compensation coefficients, enabling the cleanroom to maintain a fixed leakage airflow under a specified pressure gradient [8]. However, the necessity for personnel ingress and egress can compromise this sealed environment and induce air mixing. To prevent such occurrences, the installation of buffer rooms between cleanrooms and corridors has been proposed [9]. The presence of a buffer room can effectively reduce the potential for air mixing between the cleanroom and the corridor. However, Hang et al. found that when the door of cleanrooms is fully open, temperature differences and concentration gradients on both sides of the door can lead to bidirectional flow and transport of contaminant [10]. The longer the door between buffer rooms and cleanrooms remains open, or the lower the ventilation rate, the greater the amount of contaminant entering the cleanroom. Additionally, the movement of personnel is a significant factor in the spread of contaminant [11–16], particularly when entering and exiting buffer rooms and cleanrooms. Therefore, it is necessary to research and develop methods to reduce the air mixing effects caused by personnel movement from buffer rooms to cleanrooms.
The air curtain device effectively mitigates airflow disturbances and material transport caused by personnel movement. It has been widely applied across various fields. Research has demonstrated the effectiveness of air curtains in preventing air infiltration and wind effects at building entrances [17, 18], heat and moisture transfer at cold storage room doors [19, 20], dust separation and control within the coal mining industry [21], and smoke movement and heat transfer during fires [22–24]. These studies indicate that air curtain devices can reduce energy consumption and heat transfer, making them cleaner and more cost-effective than other devices.
Research on air curtains’ role in managing contaminant transmission in cleanrooms primarily focused on establishing barriers to partition internal areas [25–28]. Shih et al. proposed installing air curtains in cleanrooms to prevent cross-contamination between areas, demonstrating excellent performance at an emission speed of 5 m/s and a discharge angle of 15° for the polluted source subarea [25]. Shen et al. studied the use of recirculating air curtains based on mixed ventilation to cover the entire width of a room. The maximum temperature difference between the two areas could be maintained at 7.4°C [28]. However, research on using air curtains to prevent contaminant transmission during entry and exit from cleanrooms was limited. Further exploration of air curtain devices for contaminant isolation is warranted.
To address this issue, this study evaluates the efficacy of air curtain control in preventing contaminant transmission into cleanrooms. Chapter 2 provides a detailed description of the model, including the computational fluid dynamics (CFD) methods and the grid division. Numerical simulation using CFD with dynamic grid technology was employed to simulate the movement of personnel, a technique effectively used to model airflow variations caused by people or objects in environments [29–32]. Furthermore, Chapter 3 focuses on both scenarios of the air curtain device being open and closed considered, exploring the effectiveness of different air curtain supply areas, personnel movement speeds, and temperature differentials inside and outside the cleanrooms. We have also analyzed the underlying causes and discussed the implications of the results for future applications in different scenarios. This research is aimed at strengthening the effective integration of air curtain devices with cleanrooms and improving understanding of contaminant transport between cleanrooms and buffer rooms.
2. Methodology
2.1. Scene Description
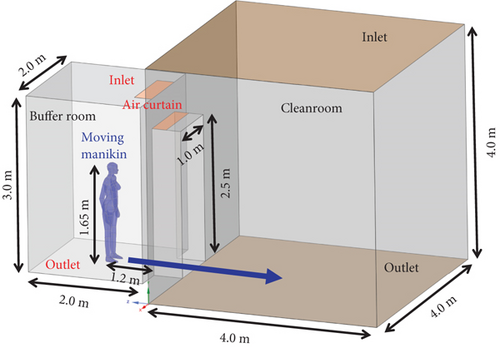
The model is based on cleanrooms in a specific location, with nonessential equipment considered as irrelevant factors and thus ignored. On this simplified basis, an air curtain device is installed, as is shown in Figure 1, and the model includes the cleanroom, buffer room, a person, and the air curtain. The buffer room serves as the only entrance to the cleanroom, and when a person enters the cleanroom from the buffer room, contaminant is dispersed. The air curtain device mainly consists of a fan, air filter, air outlets, casing, and supports. The fan draws air from the cleanroom, passing it through the filter to remove impurities and ensure air cleanliness during the operation of the air curtain. The fan accelerates the air and expels it through the air outlets (long slits at the top) at a specified speed. The air forms a vertical or inclined airflow barrier at a particular angle and wind speed [33]. This effectively prevents contaminant, dust, odors, or other external gases from entering the clean area or prevents the loss of cleanroom air [34, 35]. The air curtain device is positioned at the interface between buffer rooms and cleanrooms, with a return air system located on the buffer room floor. Cleanrooms feature vertical unidirectional airflow from the ceiling, with clean air supplied downward and exhausted through the floor return vents. The system adopts a make-up air unit (MAU) + fan filter unit (FFU) + dehumidification and cooling coil (DCC) air supply configuration. The MAU primarily controls the indoor humidity and maintains positive pressure in the room, the FFU ensures cleanliness by circulating and filtering the air, and the DCC removes latent heat to regulate the indoor temperature [36–38]. The dimensions of the cleanroom are 4 m × 4 m × 4 m, and the buffer room measures 2 m × 2 m × 3 m. There is a fully open door between the cleanroom and the buffer room, measuring 1 m × 0.5 m × 2.5 m. Select the movement direction of the personnel as the negative direction of z-axis, the right side of the forward direction of the personnel as the positive direction of x-axis, and the direction from the floor to the ceiling as the positive direction of y-axis. A person stands upright in the buffer room. To simplify the simulation, the person’s arm and leg movements are ignored, representing the person as a thermally uniform object moving in translational motion at a constant speed. The person is modeled with a height of 1.65 m, matching the average height of an adult female, and moves at a constant speed through the doorway into cleanrooms. Wu et al. [39] utilized this simplified approach to simulate the impact of human movement on airflow patterns, comparing the results with experimental data, and found that this method effectively predicts airflow characteristics induced by human movement; this method is still widely used today [40, 41].
2.2. Numerical Methods
This study employed CFD software Fluent 2020 R1 for simulation purposes. The indoor air was treated as an incompressible gas [42]. Turbulence was managed using the Reynolds-averaged Navier–Stokes (RANS) method to solve the continuity, momentum, and energy equations [43, 44].
For most contaminant that affect cleanrooms, whether gaseous, fine particles, or bioaerosols, it can be assumed that they form a single scalar contamination field [45, 46]. The contaminant governing equations of the model included transient terms, convective terms, diffusive terms, and source terms [47]. The simulation involved complex airflow generated by a moving human body model, which causes boundary deformation in the fluid domain and enhances contaminant transport and airflow turbulence [30]. In contrast, other types of RANS models, such as the k–ε model, although capable of describing overall flow characteristics well, perform poorly in near-wall flows, especially in cases of flow separation. By comparison, the k–ω model has advantages in handling near-wall flows, but its description of the overall flow is insufficient [48]. The k–ω shear stress transport (SST) model combines the strengths of both, accurately simulating both large-scale flow separation and complex near-wall flow. This model is particularly suitable for capturing near-wall flow behaviors and related transport phenomena near complex surfaces [48]. Therefore, the k–ω SST model was applied to mitigate issues arising from boundary deformation [49].
Although fluid density variations due to temperature changes are typically small and neglected in the momentum equations, they are accounted for in buoyancy calculations. Hence, the Boussinesq approximation was employed to handle thermal convection in incompressible fluid flow, effectively capturing the impact of buoyancy effects on fluid motion [50]. For the discretization of governing equations, a second-order upwind scheme was used for convective terms, and a second-order accurate central differencing scheme was employed for diffusive terms. The PRESTO scheme was utilized for pressure discretization due to its superior performance in handling steep pressure gradients involved in vortical flows [48]. The coupled algorithm was chosen to solve the pressure–velocity coupling problem. Convergence of all simulation results was verified through residual checks, ensuring mass and energy conservation throughout the entire computational domain. Residuals for velocity, continuity, k, and ω equations were maintained below 10−3, while the energy residual was below 10−6. At the same time, key variables such as velocity, pressure, temperature, and contaminant concentration are monitored during the simulation, with their convergence curves tracked throughout the iteration process to ensure they reach stable values.
2.3. Case Setup
The primary objective of this study is to investigate whether an air curtain can act as a barrier to the transfer of contaminant at the interface between a buffer room and a cleanroom. We have selected three key variables for this research: the area of the air curtain, the speed of personnel movement, and the temperature difference between buffer rooms and cleanrooms. The study focused on discussing the selection of these parameters to determine their optimal values. The air curtain area directly affects its coverage and barrier strength, making it a critical variable in controlling the entry of contaminant. The size of the air curtain’s air supply area determines its effectiveness: if the area is too small, the air curtain will fail; if it is too large, material consumption will increase. Therefore, appropriately setting the air supply area and airflow speed can achieve better contaminant isolation [51]. Personnel movement generates eddies and air disturbances, which may bring contaminant into the cleanroom, especially near the cleanroom door or buffer zone. The higher the movement speed, the greater the disturbance, which significantly impacts cleanliness. Thus, controlling personnel movement speed is a key method to prevent human factors from introducing contamination [52]. The temperature difference between the buffer room and the cleanroom can create a density difference in the air, leading to natural convection. If there is a significant temperature difference between the two rooms, it can cause unstable airflow, disrupt air flow direction, and even introduce contaminant. Therefore, controlling the temperature difference is crucial to maintaining unidirectional airflow and stability in the cleanroom [53].
In all cases, the door remains fully open, the air curtain supply method involves drawing clean air from within cleanrooms, and there is vertical unidirectional airflow in cleanrooms [54–57]. The air supply from the ceiling in the buffer room uses a mass flow rate with a supply velocity of 1 kg/s, while the air supply in the cleanroom ceiling also uses a mass flow rate with a supply flow of 2 kg/s and a temperature of 25°C. The return flow from the floor uses a mass flow outlet, with a return flow rate of 2 kg/s. The cleanroom air exchange rate is 112.5 (1/h). The buffer zone simulates the operation of a real-world buffer zone, where ventilation occurs prior to personnel entering or exiting. This ventilation helps replace the air brought in from the outside by individuals and simultaneously adjusts the pressure difference in the buffer zone. A contaminant concentration of 1e − 5 is applied to the supply air in the buffer zone during this process. Since the system is in a steady state, the concentration of 1e − 5 represents the contaminant concentration in the buffer zone air before personnel enter or exit. After the personnel start to move, no air is supplied to the buffer room. Therefore, the specific value of the air supply speed in the buffer room does not affect the analysis and simulation results.
The simulation scenarios and boundary conditions are detailed in Tables 1, 2, and 3. Table 1 covers Cases 1–6, investigating the effect of air curtain devices located at the buffer room and doorway on obstructing the containment transmission during personnel movement by varying the air curtain area while maintaining constant airflow quality and quantity. Following determination of optimal air curtain areas, Table 2 investigates the impact of these devices on contaminant carried by human wake at varying personnel movement speeds, assuming negligible body sway. This range reflects the natural movement speed of the human body under normal conditions [13]. In a cleanroom, the movement speed of personnel directly affects airflow stability and pollution control [29]. Table 3 examines the effect of temperature differentials within the buffer room on the efficacy of contaminant blocking during personnel movement. Additionally, the surface temperature of the human body is set to 27°C [47]; the supply air temperature in cleanrooms is 22°C [13, 32]. All walls are configured to be adiabatic with no-slip boundary conditions.
| Case no. | Personnel movement speed (m/s) | Buffer room air supply area (m2) | Door air supply area (m2) | Total air supply area of air curtain (m2) |
|---|---|---|---|---|
| 1 | 0.5 | No air curtain | No air curtain | No air curtain |
| 2 | 0.5 | No air curtain | 0.1 | 0.1 |
| 3 | 0.5 | 0.1 | 0.1 | 0.2 |
| 4 | 0.5 | 0.2 | 0.1 | 0.3 |
| 5 | 0.5 | 0.3 | 0.1 | 0.4 |
| 6 | 0.5 | 0.4 | 0.1 | 0.5 |
| Case no. | Personnel movement speed (m/s) | Total air supply area of air curtain (m2) |
|---|---|---|
| 7 | 0.25 | 0.4 |
| 8 | 0.50 | 0.4 |
| 9 | 0.75 | 0.4 |
| 10 | 1.00 | 0.4 |
| 11 | 1.25 | 0.4 |
| 12 | 1.50 | 0.4 |
| Case no. | Cleanroom temperature (°C) | Buffer room temperature (°C) | Temperature difference (°C) |
|---|---|---|---|
| 13 | 22 | 15 | 7 |
| 14 | 22 | 17 | 5 |
| 15 | 22 | 19 | 3 |
| 16 | 22 | 21 | 1 |
| 17 | 22 | 23 | −1 |
| 18 | 22 | 25 | −3 |
| 19 | 22 | 27 | −5 |
| 20 | 22 | 29 | −7 |
2.4. Verification and Comparison
2.4.1. Grid Independence Verification
CFD analysis requires precise numerical models to obtain reliable results [58, 59]. The room is meshed with an unstructured tetrahedral grid, with mesh refinement applied near the surface of the human body and the contact walls. Grid density is a crucial factor affecting accuracy. Selection of appropriate grid size significantly impacts analysis outcomes [60].
A smooth transition boundary layer with a growth rate of 1.2 and a target grid size of 20 mm was applied around the walls to improve solution accuracy in areas with significant gradients. Grid refinement was implemented in key regions, such as the mouth of the mannequin, personalized exhaust outlets, and ventilation openings, to enhance grid resolution and improve the accuracy of airflow and thermal predictions in regions with complex flow characteristics. The minimum face mesh size is 60 mm, the maximum face mesh size is 80 mm, and the maximum volume mesh size is 100 mm, with a growth rate of 1.2, using tetrahedral meshes. The boundary layer growth rate is set to 1.2, and the minimum face mesh size is 20 mm, which enhances the accuracy of airflow and thermal predictions in regions with complex flow characteristics. The maximum skewness is 0.84, the minimum skewness is 1.2e − 6, the minimum orthogonal quality is 0.35, and the maximum orthogonal quality is 1. The y+ values range between 0 and 4, which is suitable for simulations requiring high accuracy in boundary layer resolution, especially in wall-modeled approaches (e.g., k–ω SST low-Reynolds number models). The low-Reynolds number model directly resolves the turbulent structures near the wall, necessitating very small first-layer mesh elements.
To accurately simulate real-world scenarios, this study employs dynamic grid technology, which differs from the “pseudomotion” method that approximates motion by altering boundaries [61]. Dynamic grid technology is computationally intensive because it frequently rebuilds the entire grid structure at each step or every few steps to accommodate changes in distance and position due to object movement [61]. The commonly used generated hexahedral and polyhedral meshes save a lot of computational resources and are often used in static simulation. However, the mesh reconstruction method used in this study is limited to tetrahedral mesh in complex scenes, which requires a large amount of computation.
In specific setups, diffusion is chosen as the smoothing method, as it better prevents negative volumes in the grid during rapid motion compared to spring smoothing. The grid redefinition method utilizes the local cell method. For grid partitioning parameters, the minimum length is set to 5.5 mm, the maximum length to 130 mm, the maximum cell skewness to 0.9, and the maximum face grid skewness to 0.846. These parameters were determined after multiple trials to ensure that the grid avoids negative volumes while reducing computational load. The grid reconstruction interval is set to 1, meaning the grid is rebuilt every single time step. This reconstruction speed is rapid, allowing the grid to deform quickly over time.
This study identified an optimal grid size suitable for human body modeling, comprising 1.7 million grid cells. To validate the model, comparisons were made using coarse (900,000 cells), medium (1.7 million cells), and dense (3.6 million cells) grids. Figure S1 shows the verification of grid independence when the air curtain is not opened along the direction of personnel movement in the model. Compare the three meshes using the change of the average dimensionless concentration with distance. Results indicated that the medium and dense grids performed similarly, both superior to the coarse grid, with noticeable differences in certain locations. Considering computational efficiency, this paper opted for the medium grid size of 1.7 million cells for simulation calculations.
2.4.2. Model Validation
In this study, the complex air flow mainly includes two flow mechanisms, namely, the human wake caused by motion and the jet caused by the wind curtain. Therefore, the above CFD model needs to be validated in the simulation of these two cell flows. Poussou conducted a small-scale experiment with a 10:1 scaled model to investigate airflow contaminant transport induced by human movement in an isothermal simplified cabin model [62]. The experiment focused on characterizing human wake in the cabin model. It deliberately lacked a ventilation system, with the body moving along the central axis of the cabin model at a constant speed of 0.25 m/s to validate the feasibility of predicting human wake using the CFD model in this study. Figure 2 illustrates the geometric model used in the experiment, where the cabin model was simplified to a semicylindrical shape and the human body to a rectangular prism. Particle image velocimetry (PIV) was employed to measure velocity distributions with measurement errors below ±0.4%. In simulation, a combined approach of dynamic and steady grids generated over 400,000 grid cells.
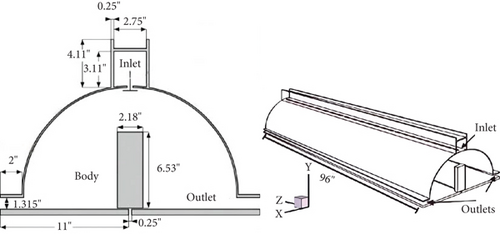
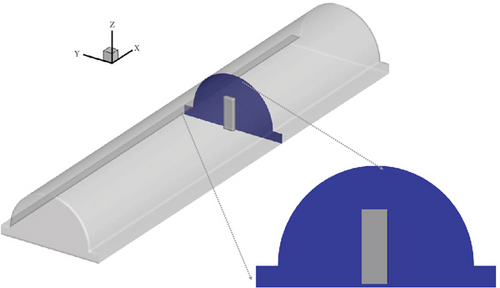
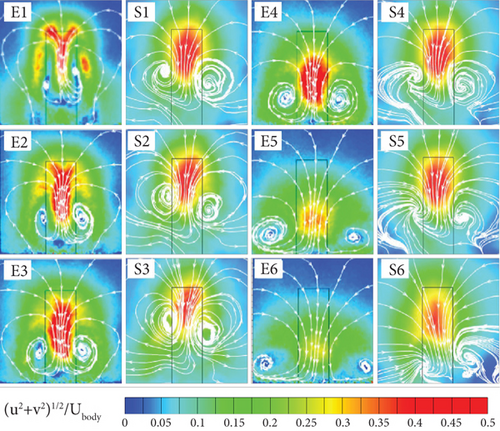
Figure 3(a) shows the cabin model used in the CFD model validation. Figure 3(b) shows a comparison between simulation (S1–S6) and experimental (E1–E6) results. S1–S6 corresponds to the distance between the cross section and the body, increasing from 0.18 to 2.36D (where D is the body width, i.e., 0.58 m). The exact distances are 0.18, 0.62, 1.05, 1.49, 1.92, and 2.36D, respectively. The velocities u and v represent horizontal and vertical components, respectively, with Ubody denoting the personnel’s movement speed. Both sets of results reveal a pair of counterrotating vortices. As the distance increases, the vortices’ axes shift downward and laterally, observable in both approaches. Thus, the selected CFD model can well predict the process of human motion.
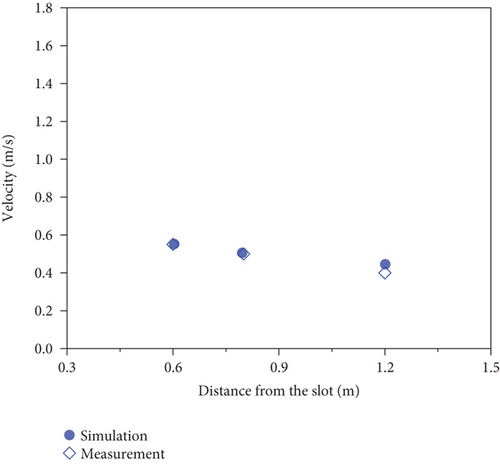
Cao et al. conducted velocity and transient contaminant measurements in a room ventilated by an air curtain [63]. The room dimensions were 4 m (length) × 2 m (width) × 2.65 m (height). A 2-m-long, 10-mm-wide air supply slot was installed on the ceiling to generate a planar air jet (i.e., air curtain jet), with two exhaust outlets located on opposite sidewalls at a height of 2.4 m and a diameter of 100 mm. The average airspeed of the slot was 1.75 m/s (5.9 ACH). Figure 4 shows a comparison between the numerical simulation results and the measurements from this study.
2.5. Performance Evaluation of Air Curtain
3. Results and Discussion
3.1. Influence of Air Curtain Area
Figure 5(a) illustrates the average dimensionless concentration changes with time without the installation of the air curtain device on the symmetric plane perpendicular to the x-axis. It can be seen that with the door open, due to the concentration difference between cleanrooms and buffer rooms, a large amount of contaminant freely diffuses into cleanrooms. During personnel movement, a significant amount of contaminant also enters cleanrooms following the wake of the person. Figure 5(b) illustrates the change of the average dimensionless concentration of containments over time when the air supply area of the air curtain device on the symmetric plane perpendicular to the x-axis is 0.4 m2. At the 2-s mark, the person is in full contact with the airflow emitted by the air curtain. By 4.0 s, the person has completely entered cleanrooms, and a noticeable portion of contaminant can be observed following the person from top to bottom into cleanrooms. At 6.0 s, the contaminant concentration in cleanrooms is significantly lower than when the person first entered, indicating that the application of the air curtain device in isolating contaminant warrants further research. This phenomenon can be explained by the fact that the vertical airflow imposed by the air curtain can significantly block the lateral diffusion of contaminant. As personnel pass through the interface between buffer rooms and cleanrooms, the stable barrier formed by the airflow emitted from the air curtain is disrupted. Consequently, a minimal amount of contaminant follows the wake of the person into cleanrooms, while the vast majority of contaminants are effectively isolated by the air curtain device, maintaining the air cleanliness within cleanrooms. The detailed legend of whether or not installing air curtain equipment changes the dimensionless concentration over time can be found in Figures S2 and S3.
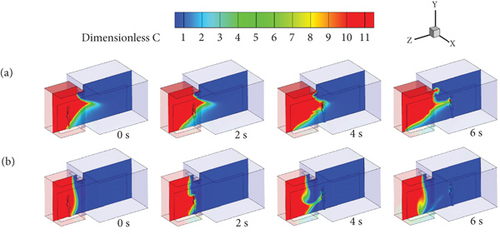
Figure 6(a) illustrates the velocity vector field on the symmetric plane perpendicular to the x-axis for different air curtain supply areas. When the door is fully open and the air curtain is not activated, a noticeable vortex forms behind the person as they move, with streamlines becoming increasingly dense and the vortex shape more pronounced as movement continues. Additionally, it can be observed that before the person begins to move, the vertical unidirectional airflow in cleanrooms has a slight obstructive effect on the contaminant diffusing from the buffer room into cleanrooms. Once the person starts moving, their movement causes contaminant in the buffer room to migrate. At 2.4 s, when the person reaches the interface between cleanrooms and the buffer rooms, the degree of airflow turbulence increases, and a significant amount of contaminant follows the person’s wake into cleanrooms. This results in a sudden increase in contaminant within cleanrooms, which then spread throughout the room, prolonging the presence of contaminant and complicating the cleaning process.

At the 2.4-s mark, vortices form above the head and behind the person, increasing the turbulence of contaminant in the buffer room and interfering with the airflow velocity at the air curtain interface. It can be observed that with an air curtain supply area of 0.1 m2, the vortices are very pronounced, and the flow field in the buffer room is quite chaotic. As the air curtain supply area increases, the vortices gradually diminish, and at an air curtain area of 0.5 m2, the vortices nearly disappear, resulting in a stable flow field both in the buffer room and at the interface. This phenomenon can be explained by the fact that as the air curtain supply area increases, the thickness of the jet interface increases, reducing the extent to which the airflow is affected by personnel movement. Consequently, the air curtain’s ability to block contaminant progressively improves. When personnel pass through the air curtain, the impact of vortices diminishes with the increasing air curtain supply area, significantly enhancing the air curtain’s effectiveness in isolating contaminant [52]. Detailed illustration of the influence of air curtain supply area on indoor flow field over time can be found in Figure S4.
Figure 6(b) illustrates the change of the average dimensionless concentration with different air curtain areas on the symmetric plane perpendicular to the x-axis over time. Without the air curtain activated, when personnel are stationary, the temperature difference and contaminant concentration difference between cleanrooms and the buffer rooms cause contaminant to diffuse into cleanrooms, even though there is vertical unidirectional airflow in cleanrooms. At 5.6 s after personnel movement, it can be seen that in addition to the contaminant that have freely diffused, a significant amount of contaminant has entered cleanrooms following the person’s wake. This is evidenced by the higher contaminant’s concentration at the person’s final position compared to the initial position. As the air curtain area increases, at 2.4 s of personnel movement, it is evident that when the person crosses the barrier formed by the air curtain jet, the original stability at the interface is disrupted, increasing the turbulence of contaminant at the interface. The contaminant concentration remains high behind the person. However, with the increasing air curtain area, the turbulence at the interface decreases, and the amount of contaminant entering cleanrooms along with the moving person significantly reduces. Detailed illustration of the influence of air curtain supply area on the dimensionless concentration over time can be found in Figure S5.
Figure 7(a) illustrates the distribution of the average dimensionless concentration of contaminant along the direction of personnel movement within cleanrooms for different air curtain supply areas. The concentration represents the average concentration of each plane at specific positions. From the figure, it can be quantitatively analyzed that without the air curtain activated, the dimensionless concentration of contaminant is as high as 0.35 at the initial position when the person first enters cleanrooms (Z = 0 m). As the person continues moving into cleanrooms, the contaminant concentration decreases with the movement, stabilizing at 0.02 at the final stop position. When the air curtain is activated and the supply area is set to 0.1 m2, the dimensionless contaminant concentration at Z = 0 m is 0.1, significantly higher than the concentrations at other supply areas. When the supply area is set to 0.4 m2, the dimensionless contaminant concentration at Z = 0 m is only 0.01. As the person continues to move into cleanrooms, the contaminant concentration gradually approaches zero, indicating a very effective blocking action of the air curtain. Increasing the supply area beyond this point does not result in a significant change, suggesting that 0.4 m2 is the optimal supply area for maximum blocking effectiveness of the air curtain.
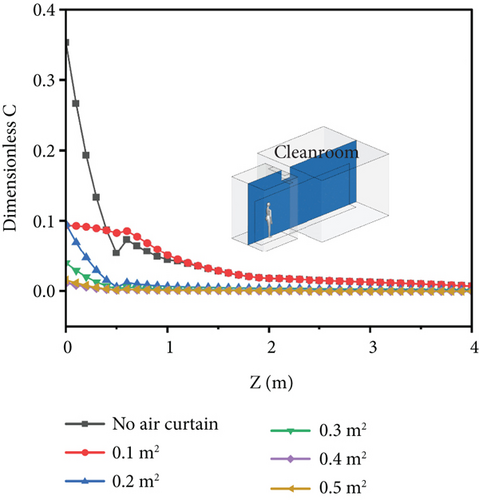
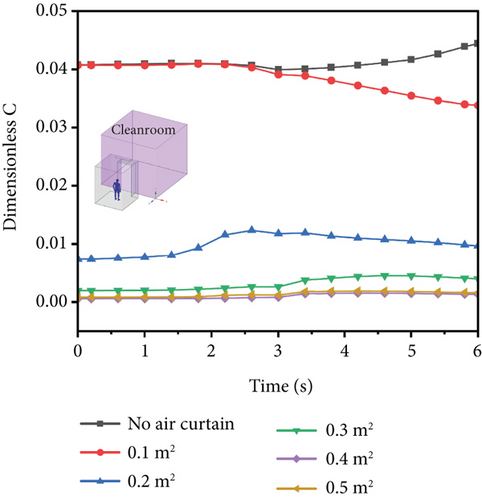
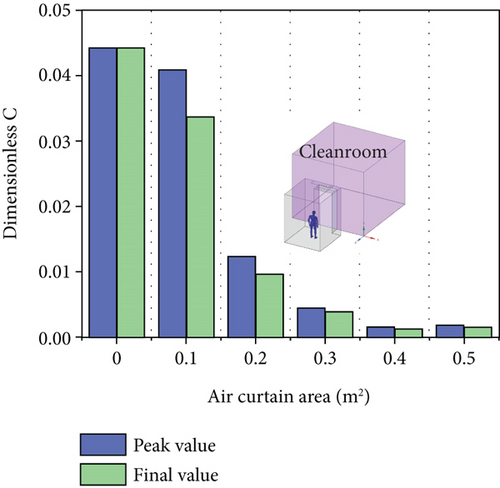
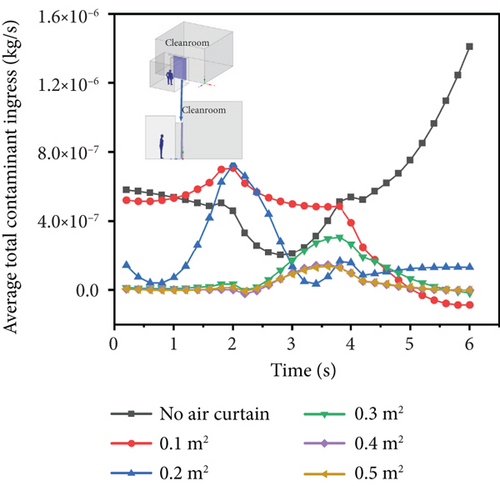
Figure 7(b) illustrates the variation of the average dimensionless contaminant’s concentration in cleanrooms over time for different air curtain supply areas. It can be observed that without the air curtain activated, the dimensionless concentration of contaminant in cleanrooms remains above 0.04 over time, reaching a maximum value of 0.045 at the 6-s mark. When the air curtain is activated, the contaminant concentration in cleanrooms shows a significant downward trend. With an air curtain supply area of 0.4 m2, the dimensionless contaminant concentration remains below 0.001 throughout the process, indicating a very effective sealing effect of the air curtain. Increasing the supply area further does not show a noticeable change in the sealing effect, suggesting that 0.4 m2 is the optimal supply area for maximum blocking effectiveness at this supply velocity. Figure 7(c) illustrates the maximum and final values of contaminant concentration in cleanrooms for different air curtain supply areas. This further verifies the trend of contaminant concentration variation in cleanrooms under different air curtain supply areas.
Figure 7(d) illustrates the average total amount of contaminant passing through cleanroom interface over the course of the process for different air curtain supply areas. It can be seen that within 2–4 s of movement, the average amount of contaminant passing through the interface changes dramatically. When the air curtain is not activated, the mass flow rate through decreases from the initial 6 × 10⁻⁷ to 2 × 10⁻⁷ kg/s and then increases to the initial value and then continues to increase to 1.4 × 10⁻⁶ to reach the highest value. However, with the increase of air curtain area, the mass flow rate of contaminant decreases. When the air curtain area is 0.1 and 0.2 m2, the mass flow of contaminant into cleanrooms still fluctuates greatly over time. When the air curtain area reaches 0.4 m2, the contaminant inlet decreases to 1.5 × 10⁻⁷ kg/s, and further increasing the air curtain area does not cause significant changes in this value. Zhao et al. conducted numerical simulations of contaminant transmission with an air curtain device, investigating the effects of jet speed, shell height, and air curtain width on the sealing effectiveness of the air curtain. They analyzed the impact of air curtain width on the contaminant transmission in the absence of personnel movement, finding a linear increase in sealing effectiveness with increasing air curtain width [42]. In this study, the blocking effect of the air curtain does not increase linearly but stabilizes after reaching a certain level. This phenomenon can be explained by the fact that as the air curtain area increases, the contaminant concentration entering cleanrooms with the person’s wake gradually decreases, and the airflow at buffer room and cleanroom interface stabilizes, resulting in a noticeable blocking effect. When there are only two spaces, placing a single air curtain at the boundary between them can achieve effective sealing and isolation. However, when isolation involves external spaces or different internal areas, the use of multiple air curtains can be considered. Previous studies have thoroughly explored this topic [64, 65].
The contaminant concentration distribution at the initial stage (Figure 7(a)) serves as the starting condition for the temporal evolution (Figure 7(b)), reflecting the effectiveness of contaminant control. The temporal variation indicates that the air curtain effectively prevents continuous contaminant intrusion into cleanroom, as confirmed by the peak and final values in Figure 7(c). The contaminant concentration distribution and temporal evolution results in Figures 7(a) and 7(b) are summarized here. The bar chart clearly illustrates the quantitative relationship between the air curtain area and contaminant control efficiency. The contaminant concentration patterns in Figures 7(a), 7(b), and 7(c) ultimately lead to differences in contaminant transmission shown in Figure 7(d). The air curtain’s control effect is reflected not only in concentration.
3.2. Influence of Personnel Moving Speed
Figure 8 illustrates the change of the average dimensionless concentration with distance on the symmetric plane perpendicular to the x-axis under different moving speeds. It can be observed that when the personnel movement speed is 0.25 m/s, there is almost no contaminant following the person’s wake into cleanrooms between Z = 1.0 and Z = −1.6 m. As the personnel movement speed increases, the amount of contaminant following the person’s wake into cleanrooms significantly increases. At a movement speed of 1.50 m/s, some contaminants do follow the person’s wake into cleanrooms between Z = 1.0 and Z = −1.6 m, and the concentration of contaminant following the person’s wake into cleanrooms is highest at this speed. This phenomenon can be explained by the fact that the airflow barrier created by the air curtain device effectively blocks contaminant diffusion [66]. However, the movement of personnel disrupts the stability of the air curtain jet interface, increasing the turbulence of the airflow at the interface. Therefore, as the personnel movement speed increases, the wake velocity also increases, leading to intensified airflow disturbances and consequently promoting greater transport of contaminant.
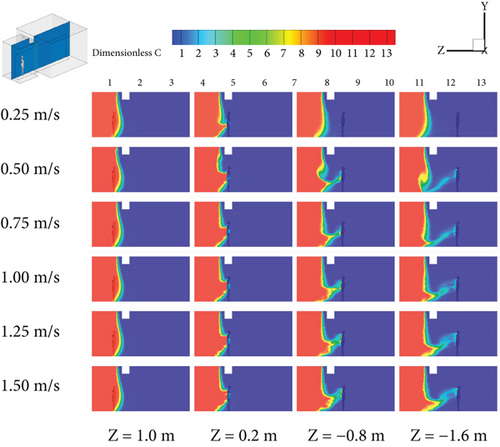
Figure 9 illustrates the change of the average dimensionless concentration of containments in cleanrooms with time under different personnel moving speed. It is evident that at a personnel movement speed of 0.25 m/s, the contaminant concentration in cleanrooms stabilizes around 6 × 10⁻⁴. This indicates that at this speed, the person’s movement through the air curtain’s airflow barrier does not significantly disrupt the airflow stability at the interface, with only a small amount of contaminant being carried in, and the airflow barrier quickly resumes its original blocking effect. In contrast, at a personnel movement speed of 1.50 m/s, the contaminant concentration in cleanrooms rises rapidly within 2 s, reaching a final dimensionless concentration of 3.25 × 10⁻³, which is significantly higher compared to the concentration of 6 × 10⁻⁴ at 0.25 m/s.
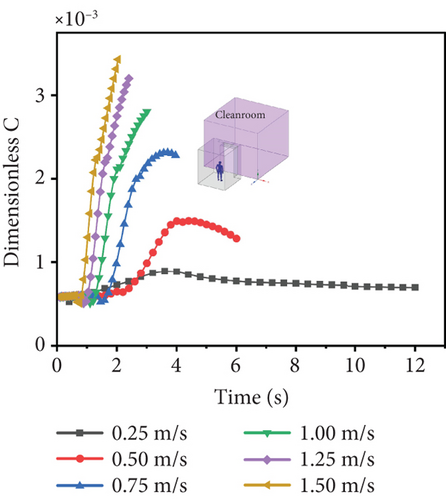
As the personnel movement speed decreases, the contaminant concentration in cleanrooms gradually decrease after movement stops. This phenomenon can be explained by the fact that at a speed of 0.25 m/s, the person’s movement through the air curtain’s airflow barrier does not significantly impact the stability of the barrier, allowing it to effectively block contaminant. As the movement speed increases, the disruption to the airflow barrier’s stability becomes more significant, and since the air curtain’s airflow barrier cannot quickly recover its stability, the amount of contaminant carried into cleanrooms increases over time. In other scenarios with regard to air curtains, Jha et al. also found that increasing personnel movement speed diminishes its sealing effectiveness [67].
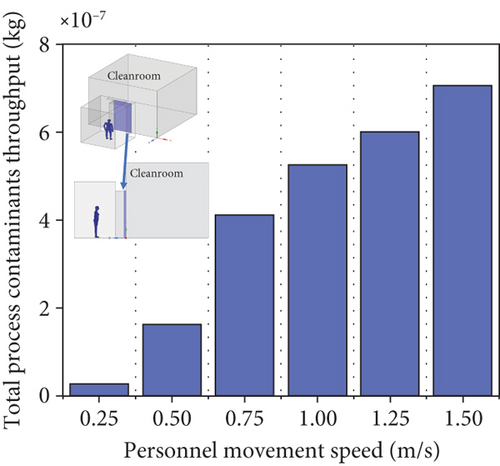
Figure 10 illustrates the total amount of contaminant passing through cleanrooms’ interface over the entire process for different personnel movement speeds. It is observed that the total amount of contaminant entering cleanrooms increases with the increase in personnel movement speed. Specifically, as the personnel movement speed rises from 0.25 to 1.50 m/s, the total amount of contaminant increases from 2.5 × 10⁻⁸ to 7 × 10⁻⁷ kg/s. This indicates that the effectiveness of the air curtain in blocking contaminant diminishes with higher personnel movement speeds. Therefore, in order to improve the cleanliness of cleanrooms, the entry speed should be reduced to the greatest extent before entering cleanrooms.
3.3. Influence of Temperature Difference
Figure 11(a) illustrates the variation of velocity vectors over time on the symmetric plane perpendicular to the x-axis under different temperature differentials. It can be seen that when the temperature of cleanrooms is 7°C higher than that of the buffer room, the airflow barrier formed by the air curtain tends to recess into the buffer room. The high temperature air flow from cleanrooms flows into buffer rooms from the upper part, while the low temperature air flow from buffer rooms flows into cleanrooms from the lower part. In this case, the air flow into the buffer room destroys the stability of the air flow in the buffer room and increases the degree of contaminant chaos in the buffer room. Therefore, a large amount of contaminant flows into cleanrooms with the chaotic air flow, resulting in an increase in contaminant in cleanrooms. When the temperature difference decreases gradually, the sag trend of the air barrier formed by the air curtain into the buffer gradually decreases, and the interference degree of the air flow in the buffer room also gradually decreases. The contaminant affected by the interference flow into cleanrooms gradually decreases, but some contaminants still enter cleanrooms during the movement of personnel. On the contrary, when the temperature of the buffer room is 1°C higher than that of cleanrooms, the airflow barrier formed by the air curtain has a tendency to concave into cleanrooms. With the increase of temperature difference, this trend is gradually obvious, which may reduce the interference to the airflow in the buffer room, but will aggravate the situation of contaminant entering cleanrooms.
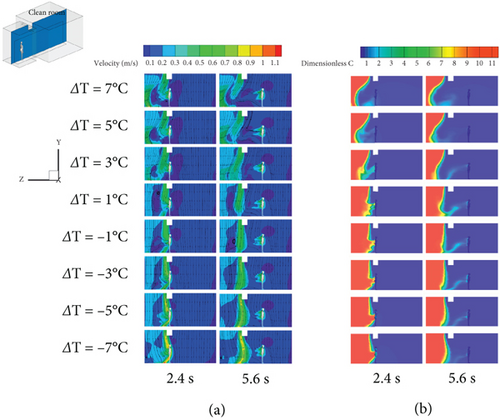
Figure 11(b) illustrates the change of the average dimensionless concentration of containments with different temperature differences on the symmetric plane perpendicular to the x-axis over time. It can be observed that when cleanroom temperature is 7°C higher than the buffer room temperature, the combined effect of the temperature differential and the air curtain results in a larger blocking range. However, some contaminants are still drawn towards the lower part of the body due to the airflow, and when the person begins to move at 5.6 s, more contaminants are carried into cleanrooms, with a continued tendency for contaminant to spread forward. As the temperature differential decreases, it is observed that by 5.6 s, the contaminant concentration behind the person in the buffer room gradually increases. This phenomenon can be explained by the fact that after the air curtain is activated, a larger temperature differential drives some contaminant to migrate into cleanrooms even in the absence of personnel movement, causing air contaminant inside cleanrooms. As the temperature differential decreases, the amount of contaminant migration driven by the temperature differential also reduces, but the contaminant following the person’s trajectory into cleanrooms increases. When the temperature of the buffer room is higher than that of cleanrooms, with the increase of temperature difference, the temperature difference drives some contaminant to move to cleanrooms by themselves. Due to the existence of the air barrier emitted by the air curtain, the migration of some contaminant can be blocked. However, when the temperature difference is too large, the migration of contaminant is more affected by the temperature difference than the movement of personnel. Jha et al. suggest that the wake of personnel movement creates a turbulent flow field that disrupts the organized buoyancy-driven exchange flow, thus explaining this phenomenon [67]. Detailed illustration of the effect of temperature difference on the dimensionless concentration of containments over time can be found in Figure S6.
Figure 12(a) illustrates the distribution of average dimensionless contaminant concentration along the direction of personnel movement in cleanrooms at the final time under different temperature differentials. When people enter cleanrooms (Z = 0 m), when cleanroom temperature is higher than the buffer room temperature, at the temperature difference of 7°C, the dimensionless concentration of contaminant is around 0.172. With the increase of people’s moving distance, the dimensionless concentration of contaminant decreases rapidly, and the dimensionless concentration of contaminant approaches 0 when people move 0.8 m. When the temperature difference decreases to 5°C, the concentration at Z = 0 m drops to 0.122, and the dimensionless concentration of contaminant tends to 0 at the moving position of 0.5 m. As the temperature difference continues to decrease, the dimensionless concentration of contaminant in cleanrooms does not change significantly, and the influence of temperature difference on the air tightness of the air curtain is getting smaller and smaller, which can be attributed to the weak convection effect under the small temperature difference, resulting in the slow propagation speed of contaminant carried by personnel. When the buffer room temperature is higher than cleanroom temperature, the dimensionless concentration of contaminant in the four cases is around 0.02 when Z = 0 m, and the dimensionless concentration of contaminant gradually approaches 0 when moving 0.1 m.
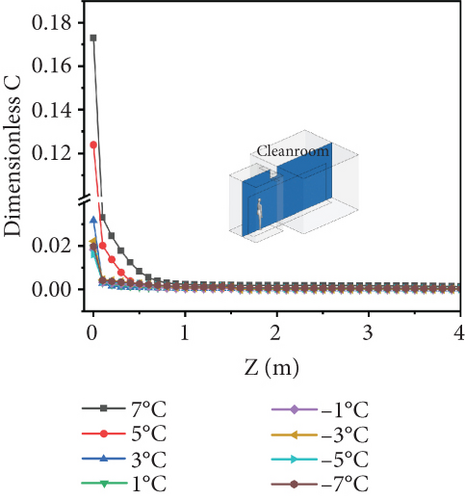
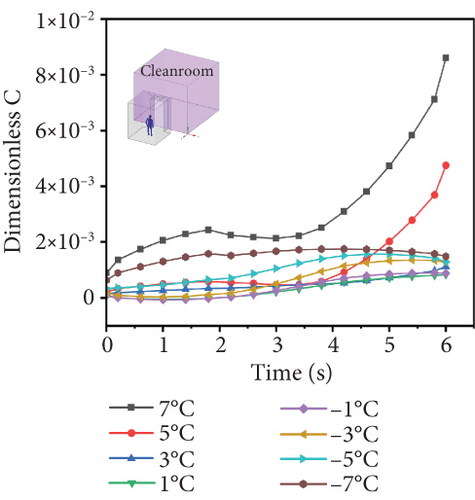
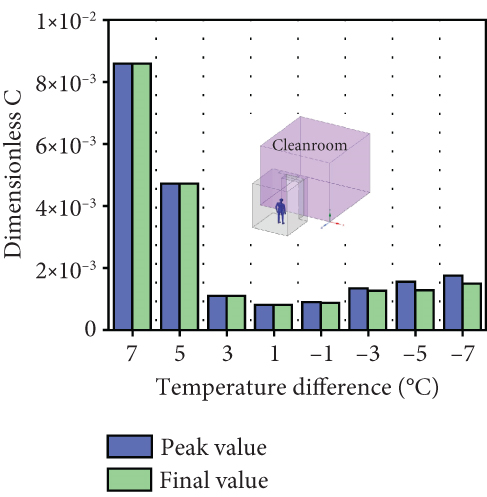
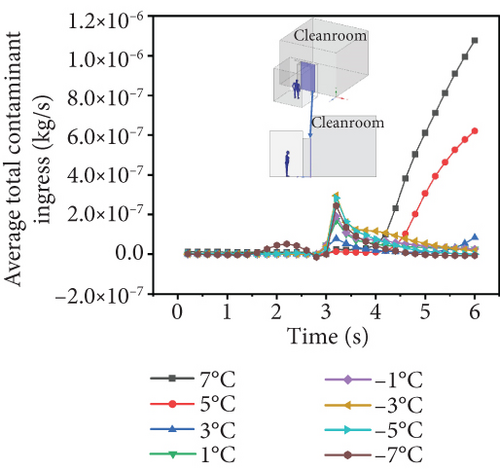
Figure 12(b) illustrates the variation in the average dimensionless concentration of contaminant in cleanrooms over time under different temperature differentials. It can be seen that when cleanroom temperature is higher than the buffer room temperature, at a temperature difference of 7°C, the average dimensionless average concentration of contaminant in cleanrooms begins to increase slowly with time and turns to a rapid increase after 3.5 s of movement, reaching 8.5 × 10⁻³ at the final moment, which is significantly higher than the average dimensionless concentration of contaminant under other temperature differences. At the temperature difference of 5°C, the contaminant in cleanrooms was less before 3.5 s of movement, but the dimensionless average concentration of contaminant increased rapidly after 3.5 s of movement. At the temperature difference between 3°C and 1°C, the average dimensionless concentration of contaminant in cleanrooms did not change significantly and was all around 1 × 10⁻⁴. This shows that in the case of personnel movement, when cleanroom temperature is higher than the buffer room temperature, a large temperature difference is not conducive to the effective operation of the air curtain. When the buffer room temperature is higher than cleanroom temperature, when the temperature difference is −1°C, the average dimensionless concentration of contaminant in cleanrooms slowly increases to around 2 × 10⁻⁴ when people move to cleanrooms, and with the increase of temperature difference, the air tightness of the air curtain gradually decreases.
Figure 12(c) illustrates the maximum and final values of contaminant concentration in cleanrooms under varying temperature differentials. It can be concluded that with the increase of temperature difference, the average dimensionless concentration of contaminant in cleanrooms also increases. When cleanroom temperature is higher than the buffer room temperature, the contaminant diffused into cleanrooms are higher than the buffer room temperature is higher than cleanroom temperature.
Figure 12(d) illustrates the average amount of contaminant passing through cleanrooms’ boundary throughout the process under different temperature differentials. It can be observed that when cleanroom temperature is higher than the buffer room temperature and when the temperature difference is 7°C, the average amount of contaminant entering cleanrooms increases rapidly after 4 s of personnel movement until it stops, reaching 1.1 × 10⁻⁶ kg/s. When the temperature difference is 5°C, it has the same curve trend, but the maximum value drops to 6 × 10⁻⁷. With the decrease of temperature difference, when the personnel moved through the interface between the buffer room and cleanrooms, that is, when the personnel moved 3.25 s, the contaminant passing volume began to increase first and then decrease and finally gradually recovered to a stable trend. The fluctuation peak of contaminant passing amount is around 1 × 10⁻⁷. When the buffer room temperature is higher than cleanroom temperature, when the personnel move 3.25 s, there are fluctuations in the amount of contaminant passing through, and the values are around 2 × 10⁻⁷. Therefore, the temperature difference between cleanrooms and the buffer room should be controlled within the range of 3°C, and cleanroom temperature should be higher than the buffer room temperature.
The distribution characteristics of contaminants in Figure 12(a) provide a spatial foundation for the temporal variation in Figure 12(b) and peak behavior in Figure 12(c). Analysis reveals that the temporal evolution aligns with the distribution in Figure 12(a), further elucidating the mechanism by which temperature differences influence contaminant. Figure 12(c) quantitatively illustrates the correlation between temperature differences and contaminant concentration. Figure 12(d) reflects the cumulative impact of contaminant transmission.
4. Conclusions
- 1.
The effectiveness of the air curtain in blocking contaminant transport does not continue to increase beyond a certain airflow area. As the air curtain’s airflow area increases, the concentration of contaminant carried into cleanrooms by the trailing airflow of the moving person gradually decreases. When the airflow area is set to 0.4 m2, the dimensionless concentration of contaminant at Z = 0 m is only 0.01. Further increases in the airflow area do not result in significant additional improvement in blocking effectiveness.
- 2.
Increasing the personnel movement speed leads to a higher amount of contaminant entering cleanrooms. As the movement speed increases from 0.25 to 1.50 m/s, the total amount of contaminant increases from 2.5 × 10⁻⁸ to 7 × 10⁻⁷ kg/s. Therefore, it is advisable to slow down the movement before reaching the air curtain and pass through it at a significantly reduced speed to enhance the effectiveness of the air curtain system.
- 3.
The temperature difference between cleanrooms and the buffer room should be controlled within the range of 3°C, and cleanroom temperature should be higher than the buffer room temperature. When the temperature difference decreased from 7°C to 1°C, the average dimensionless concentration of contaminant in cleanrooms after the personnel movement process decreased from 8.5 × 10⁻³ to 1 × 10⁻⁴. When the temperature difference is −1°C, the average dimensionless concentration of contaminant in cleanrooms slowly increases to about 2 × 10⁻⁴, and with the increase of temperature difference, the air tightness of the air curtain gradually decreases.
From a practical application perspective, the research results indicated that the design of air curtain systems should take into account both the air supply area and the movement speed of personnel to achieve optimal contaminant barrier performance. Additionally, temperature control was a critical factor in optimizing the performance of air curtains, and the temperature difference between the cleanroom and the buffer zone needed to be precisely regulated. In our study, we also found that the jet angle of the air curtain is a key factor worth further investigation, which will be a focus of future research. Based on these findings, future studies can further explore neglected factors such as changes in air velocity, energy consumption, the impact of human limbs (such as legs and arms), and the effects of door opening and closing on airflow. Refining airflow simulations can facilitate more detailed design and control strategies, thereby enhancing the efficiency and sustainability of cleanroom design. Applying these conclusions to the practical operation of cleanrooms can help optimize their use in different settings, thereby strengthening contaminant control strategies.
Conflicts of Interest
The authors declare no conflicts of interest.
Author Contributions
Junzhou He: funding acquisition (lead), formal analysis (equal), supervision (lead), methodology (equal), writing–original draft (supporting), writing–review and editing (equal), conceptualization (lead). Hongtao Xu: writing–original draft (lead), writing–review and editing (lead), software (lead), methodology (equal), programming (lead), data curation (lead), visualization (lead), data analysis (lead). Mingrui Cao: formal analysis (equal), writing–review and editing (equal). Qianshun Liang: software (equal), methodology (equal). Saichong Zhang: visualization (equal), data analysis (equal). Miao Yu: formal analysis (equal), writing–review and editing (equal). Haiyang Liu: software (equal), methodology (equal). Zhijian Liu: formal analysis (equal), supervision (equal). Jingwei Liu: supervision (equal), data curation (supporting), visualization (supporting).
Funding
This work was supported by the National Natural Science Foundation of China (No. 52208107), the National Key R&D Program of China (No. 2023YFC2605300), the Natural Science Foundation Program of Hebei Province (No. E2024502012), and the Fundamental Research Funds for the Central Universities (No. 2023MS116 and 2024MS146).
Open Research
Data Availability Statement
The data that support the findings of this study are available on request from the corresponding author. The data are not publicly available due to privacy or ethical restrictions.


