Evaluation of Airborne Transmission Mitigation in a Naturally Ventilated Humanitarian Emergency Tent Using a Novel Single-Gas Tracer Decay Technique
Abstract
The rapid deployment of emergency tents for airborne disease containment necessitates effective and sustainable approaches. This study introduces an innovative emergency tent prototype, developed within the INITIATE2 project by WFP and WHO, that leverages natural ventilation to mitigate airborne transmission risks when humanitarian tents are deployed in response to epidemics. The tent features a two-zone design with a transparent barrier separating the patient area from the healthcare operator zone and exploits a suitable airflow path to reduce cross-contamination. In order to overcome the constraints imposed by the logistic of the on-site measurements, a novel asynchronous single-gas tracer decay methodology combined with a multizone gray box model was developed, enabling both on-site experimental testing of ventilation effectiveness and estimation of airborne pathogen concentrations for infection transmission risk analysis. This approach allowed for the quantification of interzonal exchanges and ventilation rates under various window configurations, simulating different natural ventilation regimes. Multiple ventilation scenarios were evaluated, revealing that partial windows opening (Scenario 2, with Scenario 1 being windows closed) optimized airflow, achieving up to 15 air changes per hour (ACH), a value aligned with CDC and WHO guidelines. Instead, fully open windows (Scenario 3) increased the ACH in the patient area but compromised, to a certain extent, the containment of the pathogens in the healthcare operator zone. Results highlighted, for all the tested scenarios, an unintended air recirculation between the patient and the doctor zones. While the gray box model effectively estimated flow rates across scenarios, it encountered limitations at ACH > 20 due to the photoacoustic equipment’s sampling constraints. The relatively slow acquisition time impacted on the data accuracy during rapid decay phases, where ventilation time constants were on the order of minutes. The design of the transparent barrier reflects a deliberate trade-off between airtightness and operational functionality, with the field methodology enabling an evidence-based assessment of its performance. These findings emphasize the need for refined airflow management and highlight the potential of natural ventilation in emergency healthcare settings. Future research directions include the development of high sampling rate, multigas, and multipoint monitoring tools, as well as enhanced tent designs that improve airtightness of the transparent barrier.
1. Introduction
The rapid spread of epidemic-prone diseases, particularly in vulnerable and impoverished populations, poses a significant challenge to emergency healthcare infrastructure, demanding prompt and effective responses from the medical sector during crises [1]. Airborne diseases, in particular, strain the design of emergency shelters, requiring them to adhere to Infection Prevention and Control standards [2–4], promote sustainability and resilience, and uphold human dignity [5–9]. While research on thermal comfort in humanitarian shelters has grown over the past two decades [10–14], limited attention has been given to natural ventilation’s role in both thermal control [15] and airborne disease prevention [4]. Emergency humanitarian tents, especially in remote areas, offer practical solutions for managing healthcare needs during pandemics, yet access to mechanical ventilation in these settings remains a challenge. Indeed, the use of electricity in remote conditions is often prioritized toward medical equipment for surgery, reanimation, and respiration assistance. Global organizations like the World Food Programme (WFP) and WHO are supporting new design strategies to be implemented on humanitarian tents in contingency scenarios [16], supporting pandemic responses while relying on passive and sustainable solutions.
A resilient design strategy for a humanitarian tent in an emergency context requires specific actions against pathogens carried by bioaerosols and emitted through respiration [17]. The role of aerosol transport in the spread of airborne diseases such as influenza and tuberculosis has long been recognized [18–22], and ventilation and air purification are essential methods for improving indoor air quality and for reducing the risk of cross infection, second only to direct pathogen elimination.
The foundational work of Wells–Riley (W-R) on tuberculosis transmission [23, 24], and later of Gammaitoni–Nucci (G-N), laid the groundwork for current infection control measures and models that relate infection probability to exposure time and emission rates, inversely linked to indoor ventilation rates. These models have provided strategies for managing indoor air quality and reducing transmission risks in real outbreaks within indoor environments [19–21, 25, 26].
These theories attribute airborne transmission to droplet nuclei generated from respiratory activities. Close contact with an infected individual’s respiratory cloud can expose others to infection through larger droplets expelled by coughing or sneezing [27–30]; these droplets rapidly evaporate, shrinking to less than 5 μm. Once reduced in size, the droplets are less influenced by gravity, allowing them to remain suspended in the air for minutes to hours [18, 31–34]. The prolonged airborne lifetime of smaller particles enables them to diffuse over greater distances, potentially reaching surfaces far from their point of origin. Consequently, the infection pathway extends beyond direct contact, shifting to the air people breathe. Without adequate ventilation [33], airborne particles containing pathogens can accumulate and remain active for hours or even days [35–38], increasing the risk of long-distance transmission of infections.
In this context, the probability of infection is largely influenced by the time a susceptible person spends in an enclosed space (volume V) containing dispersed droplet nuclei and ventilated with a certain rate (measured through the air change per hour, ACH).
The W-R model quantifies this probability using a Poisson distribution, based on the concept of quanta (q with units as 1/h), assuming the presence of at least one infectious individual, a constant viral load, homogeneous quanta distribution in the space, and a steady removal of pathogens via ventilation. While the W-R model is effective for quick assessments in steady-state conditions, the G-N model expands on this by allowing for dynamic conditions, such as varying quanta concentrations due to previous exposure [34]. Computational fluid dynamics simulations can further refine predictions by modeling quanta distribution in indoor spaces [39, 40] by studying the indoor air movements among the different areas of a room or a building. In contrast to W-R and G-N modeling, the more recent dose–response models [39, 41] offer a more empirical approach by assessing infection probabilities based on the observed effects of specific pathogen doses on test populations. Both modeling approaches have strengths and limitations, but they consistently highlight the importance of keeping pathogen concentrations low. This can be achieved either by “encapsulating” the source of quanta and physically separating the infected individuals by potential susceptibles and/or by diluting and removing the pathogens by means of a proper ventilation and airflow path structure (both these measures, as it will be shown later on, are implemented in emergency tents).
Effective ventilation is critical for mitigating airborne pathogen transmission in high-risk environments such as intensive care units. Organizations like the CDC and WHO recommend ventilation rates of at least 12 ACH or 160 L/s per patient, far exceeding standard levels, to reduce the concentration of airborne particles [42–50].
These recommendations underline the importance of managing air quality, especially in enclosed spaces designed for infection control, such as emergency humanitarian tents. One of the key features of these premises is the presence of physical barriers separating different operational zones, such as the area where medical staff work and the patient isolation space. However, even in a sophisticated and high-tech isolation room within permanent hospital settings, some air leakages may always occur, leading to interzonal air exchange that can transport hazardous pathogens to medical personnel [22]. Interzonal air movements due to human movements, door-opening actions, and differential pressures existing between the different zones can migrate between 2% and 20% of risky particles from the insulation wards toward the operational zones of doctors [51]. Such eventuality becomes more and more likely and severe in emergency nosocomial environments, because materials like plastic sheeting are typically used to keep the costs low and to improve the easiness of on-site construction. Although these barriers are fundamental to protect medical staff, while allowing for essential visual contact and emergency procedures, they are frequently unable to provide an effective airproof and are prone to let interzonal air changes take place. Therefore, the “encapsulation” measures must always be coupled with a suitable ventilation system to lessen the cross-infection risks. Considering that emergency tents are typically employed in underdeveloped and remote areas, with no or low-quality energy infrastructures, the use of mechanical ventilation systems do not represent a reliable and robust solution and natural ventilation is preferable. Nevertheless, this strategy, being based on natural driving forces (that vary stochastically), is inherently not capable of providing consistent, stable, and continuous air flow rates and air paths. Therefore, it is necessary to carefully test and verify its performance on the field.
Tracer gas (TG) techniques are a commonly used procedure to assess and quantify ventilation in indoor environments. These techniques involve the release and the concentration monitoring of a nontoxic, not flammable, and odorless TG absent in the normal composition of the air (e.g., sulfur hexafluoride, SF6) [52–58]. For example, with the decay method, a short burst of SF6 is injected in the room, and subsequently, the TG concentration is recorded (ensuring continuous and uniform gas dilution throughout the space) [57]. It is a well-established procedure for evaluating the fresh air flow rate entering a room and in addition a considerable amount of studies carry out experimental activities using TG as proxy to identify infections path due to airborne particles [59–61].
- -
interzonal air exchanges are superimposed to the fresh air flow rates
- -
the air flow rates become very high (as in the case of intensive care units with ACH exceeding 12 1/h). In such conditions the decay of the concentration is very fast and it becomes difficult, or impossible, to collect a sufficient number of measurement points due to the slowness of the existing gas analyzers [62]
The emergency tent case shows both of these characteristics and introduces the additional challenge of requiring the measurements to be done in the field and in an open area with few supporting facilities.
In light of these research open questions, a study was done aimed at designing, making, and testing a novel emergency tent that utilizes natural ventilation as a sustainable and resilient strategy to fight long-distance airborne transmission. This design effectively reduces the spread of airborne diseases by harnessing the dilution effect of natural airflow.
Moreover, as the available testing methods were unsuitable for the tent prototype, a specialized on-field technique was developed to assess the ACH and the interzonal air exchanges between patient and doctor areas was proposed and developed. This technique involves asynchronous measurement of the TG decay in both rooms, combined with a gray box approach for the data processing. This method allows for the evaluation of interzonal flow rates and the estimation of cross-contamination risk between different areas of the tent in the event of airborne pathogens.
The newly proposed TG method was employed during the experimental campaign performed on a full-scale prototype of the tent operating under actual working conditions. The study evaluated the tent’s performance in terms of protection of the healthcare operators and cross-infection risk mitigation. Finally, the measurement results are critically analyzed, discussing advantages, weaknesses, and possible improvements of the tent design. It is important to note that, given the lack of similar approaches, this study does not aim to compare the proposed tent with existing solutions or to provide generalized design recommendations. Rather, it focuses on testing a specific prototype developed within the INITIATE2 project and on introducing a tailored on-site methodology suitable for evaluating ventilation performance and airborne transmission risk in realistic, resource-limited field conditions.
2. Design Rational and Functional Trade-Offs in an Innovative Emergency Humanitarian Tent for Airborne Risk Mitigation With Natural Ventilation
In June 2021, the WFP and WHO launched INITIATE2, a 5-year initiative to unify emergency response organizations, research institutions, and academia to develop innovative, standardized solutions and training programs to enhance preparedness and response to health emergencies. As part of this effort, the Politecnico di Torino in Italy, in collaboration with international institutions and humanitarian organizations, contributed to designing, simulating, and testing an advanced infectious disease treatment module for early deployment in health crises. A key focus of the design was optimizing natural ventilation to prevent and control airborne transmission within the module’s indoor spaces and across internal partitions.
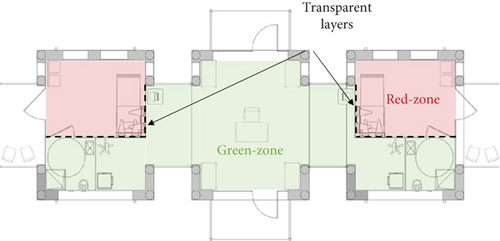
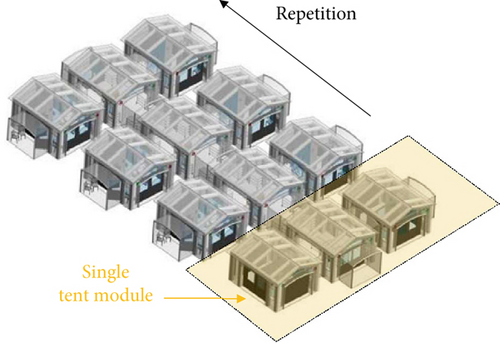
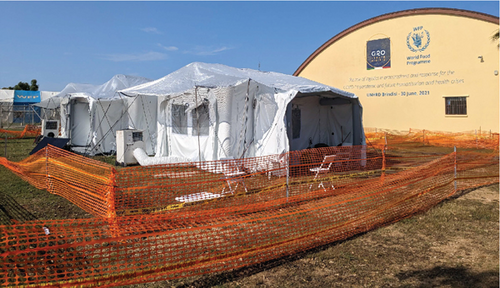
Figure 1a illustrates the layout of the tent module, divided into two primary zones: the infected patient area (referred to as the red zone) and the medical staff area (green zone), where the air must ideally remain contaminant-free. The modular design enables the repeated assembly of individual tent units in symmetrical configurations, creating a multiroom structure analogous to an inflatable field hospital (Figure 1b,c). A transparent barrier separates the green and red zones. It is equipped with tools such as medical gloves, pipes, and pockets, allowing healthcare personnel to perform interventions without entering the red zone. This barrier maintains essential visual contact between medical staff and patients, which is crucial for various medical procedures (Figure 1d). The barrier serves as a critical interface between the patient and staff, making it essential to evaluate the potential for contamination across this boundary and investigate the role of natural ventilation in preventing or minimizing cross-contamination. Regarding the barrier’s airtightness, it was designed with standard tent construction solutions, including zippers, while sophisticated airtight sealings (that would have led to more expensive and complex arrangements) were avoided. This approach aligns with typical manufacturing standards for tents rather than specialized isolation facilities, recognizing that performance could be improved by introducing a more airtight version if needed. However, this would compromise the compatibility with standardized supply chains. Despite this design choice, the current model remains a valuable solution, balancing practicality with reduced pathogens exchange between the patient and doctor rooms.

Given the multiple functional roles of the transparent barrier (e.g., patient interaction, access to medical equipment, and rapid assembly in emergency contexts), complete airtightness was not technically feasible nor aligned with the field-oriented and production-cost savings goals of the INITATE2 project. The design therefore reflects a balance between operational practicality and pathogen containment. To address the performances implications of this permeability, the study did not merely assess whether the barrier was airtight but instead focused on quantifying the actual interzonal air exchange and evaluating how natural ventilation could mitigate associated transmission risks. This motivates the development of a dedicated on-site methodology capable of measuring ventilation effectiveness and supporting future design optimization under realistic field conditions. Indeed, all results related to air exchange between zones could be further optimized if a more airtight barrier was introduced.
The red zone was designed to introduce an extended amount of openings (six different windows) at different heights (Figure 1a depicts the windows’ location), exploiting ventilation driven by natural buoyancy. The vertical distance between the upper and lower apertures is equal to 2 m, and the total window opening is 10 m2. The total volume of a single red zone is around 32 m3.
3. Airborne Risk Mitigation—Experimental Assessment of the Performance of the Tent Prototype
3.1. Air Flow Structure and Pollutant/Pathogen Mass Balance
Minimizing interzonal airflows is crucial for reducing the risk of cross-infection and protecting medical personnel. As highlighted in the previous sections, the two key measures implemented in the tent prototype for this sake are represented by the use of a transparent sheet separating the patient and the healthcare operator rooms and the adoption of a natural ventilation system.
The first creates a physical barrier against the pathogen’s spread; the second provides a sort of fluid dynamic “shield.” The mechanisms through which the ventilation operates are two. Firstly, it keeps the concentration of pathogens low by means of dilution and removal. Secondly, it may hinder the spread of the pathogens from the infected areas toward the susceptibles by creating suitable air paths that flow from the doctor’s room to the patient’s room.
Figure 2 shows the ventilation model and the general structure of the air flows that is expected to take place in the tent.
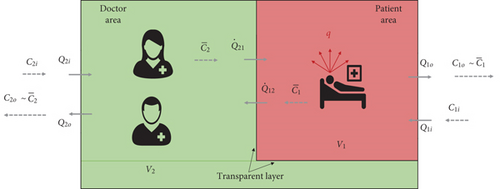
The two rooms exchange air with the outdoor environment. The entering flow rates are equal to, respectively, Q2i and Q1i, and the exiting flow rates are equal to, respectively, Q2o and Q1o. Moreover, in case the transparent sheet dividing the red and green room is not perfectly air proof, an exchange may occur between the two environments, with an airflow rate Q21 passing from the doctor to the patient room and Q12 in the opposite direction.
The doctor’s room would be in overpressure with respect to the red room, and the effectiveness of the natural ventilation would be optimal, with a risk of cross-infection virtually equal to zero (being ).
In a realistic situation, however, a certain leakage from the red to the green room has to be expected, and recirculation between the two environments is going to occur.
Therefore, some pathogens would be conveyed to the healthcare operators by the flow Q12, as shown in Figure 2. In the hypotheses of perfect mixing and assuming that the transparent shield has no filtering capacity over the droplet nuclei2, the concentration of quanta in this air stream would be equal to the mean room concentration of quanta in the red room (e.g., ).
As a result, a buildup of pathogens will occur, and a nonnull concentration of quanta will be present in the doctor’s room.
In this circumstance, a further additional measure to reduce the infection risk is represented by dilution and removal, achieved by assuring high enough flow rates entering from the outdoors, for example, Q2i and Q1i.
- −
the air flow rate Q12
- −
the fresh air flow rate, Q1i, in the red room, which is going to keep the concentration low (at constant production of quanta)
- −
the fresh air flow rate, Q2i, in the green room, which is going to lessen the concentration
To achieve the goals of minimizing Q12 and maximizing Q1i and Q2i, the NV system must be able to create stable and unidirectional airflow paths and to produce sufficiently high and continuous airflow rates.
Such features, typical of isolation wards/rooms within healthcare facilities, can easily be obtained by using mechanical ventilation systems (whose behavior is “deterministic” and provides performance stable and consistent over time), but they are far trickier to be achieved by means of natural ventilation systems.
Natural ventilation is driven by passive processes, like temperature differences between the indoors/outdoors and wind speed/direction, and its behavior is, therefore, largely “stochastic.”
Depending on the boundary conditions, which are strongly variable and unpredictable, the airflow rates produced by a NV system vary significantly over time, and the airflow paths are more difficult to control, with the risk of having, for a certain period of time, reversed flows compared to the planned/desired ones.
Indeed, a proper design of the system and the adoption of suitable measures that promote the formation of sufficiently high air flow rates and more stable air flow structure (e.g., wide open sections properly positioned on the walls/roof, air stacks, and wind catchers) can reduce the risks of a poorly ventilated environment; however, it is always advisable to experimentally test the final design of the system under realistic operative conditions and for various scenarios.
For this reason, a full-scale tent prototype was built and installed outdoors at the WFP-managed UN Humanitarian Response Depot (UNHRD) hub in Brindisi, southern Italy (Figure 1c,d), a site that simulates a remote area with poor services.
The tent was studied both in relation to the healthcare operations that must be carried on by the doctors during a potential outbreak and also to the infection risk mitigation and prevention of the cross-spread of pathogens. About the last topic, the two main objectives of the study were (i) to measure the ACH in the two rooms and (ii) to quantify the interzonal airflows between the red zone and green zone for various operative scenarios.
3.2. Asynchronous Single-Gas Tracer Decay Technique for the Multiroom Ventilation Based on a Gray Box Model
In this study, SF6 gas was selected as the tracer for evaluating air movement and interzonal exchange due to its complete absence in both indoor and outdoor environments, ensuring reliable measurement of airflow pathways. Unlike synthetic aerosols or particles—which better mimic respiratory droplets but require strong assumptions about size distribution, viability, and emission profiles—gaseous tracers offer a more generalized and conservative approach. In field conditions where the tent is in open exchange with the atmosphere, background aerosols are abundant and unfiltered. This makes clean decay tracking of particles virtually impossible and invalidates key modeling assumptions such as zero incoming pollutant concentration (). Furthermore, even advanced particle monitors cannot chemically distinguish tracer particles from ambient dust, limiting their utility for air exchange quantification. Gases, in contrast, are not subject to deposition or filtration, and their high mobility makes them suitable for “worst-case” scenario analyses. For these reasons, TG—despite not replicating all phases of droplet transmission—remains the most robust and conservative tool for natural ventilation performance testing.
A TG technique was used to investigate the effectiveness of the transparent partition and the NV system in controlling interzonal mass exchanges.
TG techniques are a family of well-known and largely used experimental methods to analyze ventilation systems and their performance in terms of both flow rates and air distribution [52–54].
While their application is rather straightforward when measurements are done in a single room ventilated with typical air flow rates (e.g., from 0.3 to 10 1/h), in case of multiroom measurements and high flow rates, their application becomes much more difficult and tricky.
The complexity lies in the fact that the quantification of the airflow rates in a two-zone room configuration, including interzonal airflows, requires the simultaneous use of two different TGs [58]. This implies that either two measurement apparatuses or a multipoint sampler with a multigas monitor must be used.
In fact, in a multizone environment with N rooms, the total number of air streams is N(N + 1), requiring the same number of mass balance equations. To apply the TG decay method optimally, several different TGs equal to the number of rooms would be required, and an equipment able to measure the gas decays simultaneously in different locations should be used.
For example, Miller [63] developed an approach using decay measurements of two different TGs. By combining these measurements with theoretical mass balance equations and applying a nonlinear least-squares minimization fitting, airflow profiles were inferred with an error of about 8%. Despite the methodological clarity of this approach, it presents logistical and practical challenges.
Other studies have studied interzonal mass exchange using a single TG decay method combined with computational techniques, such as Monte Carlo simulations. These methods still require simultaneous measurements of TG concentrations in both zones [64, 65].
Additionally, if the airflow rate is very high, the gas concentration needs to be measured with a significantly high scan rate (from a sampling every few seconds to a sampling every fraction of a second).
At present, the gas monitors available on the market, and typically used to perform TG measurements, are characterized by sampling rates slower than a measurement every 30–45 s. Consequently, if the points to be sampled become numerous, two subsequent measured concentrations in the same location are separated by some minutes. The resulting time history of the concentration turns out to be extremely coarse, and the data analysis results are unsatisfactorily inaccurate, especially when the nominal time constant of the ventilation is low (e.g., the airflow rate is high). Moreover, these instruments are costly and rather delicate.
The logistics complexity of performing a multigas/multipoint measurement is one of the primary challenges in assessing interzonal flows in multizone environments, particularly in field experiments [66–68].
In the case of the tent prototype, the accurate assessment of interzonal airflow (Q12 and Q21) would have required the use of two different TGs and multipoint sampling to simultaneously monitor the average gas concentrations over time in both the doctor’s and patient’s rooms.
However, given the practical constraints of the experimental campaign, this method, which is the usual one [58], was not applicable. Firstly, the measurement had to be conducted quickly and completed within a few days due to the limited availability of the tent prototype. Secondly, just one gas analyzer was available (with a scan rate no faster than about 40 s/sample), tests were done outdoors in a countryside and rather remote area with poor infrastructures. This condition was a necessary requirement for the simulation tests conducted during the INITIATE2 activities, which aimed to validate the tent prototype in a realistic operational environment (open field and a remote area with limited resources). It was, hence, impossible to assemble a sophisticated experimental setup. For all these reasons, a modified tracer decay procedure was conceived, implemented, and applied.
It consists of a series of “asynchronous” SF6 gas decay measurements taken separately and sequentially, first in the patient’s and then in the doctor’s rooms.
Each single experiment (related to a certain tent scenario) is constituted by two different types of tests. The first typology (referred to as Test “Type A”) involved injecting SF6 gas into the red zone and monitoring its concentration in the same room during a decay period. The second typology (Test “Type B”) began after Test A, with the SF6 still injected into the red zone, but this time, the gas decay was monitored in the green zone.
In order to reduce the inaccuracies introduced by the nonsimultaneous monitoring of the tracer concentration in the two environments and to minimize eventual fluctuations of the boundary conditions (air temperatures, wind speed, and direction), Tests “A” and “B” were repeated many times within each experiment (that is, under the same windows scenario and with similar and consistent operative conditions), as schematically shown in Figure 3. Before each new test, the TG was reinjected and thoroughly mixed in the red zone using portable fans. Every time, the injection was such to achieve a consistent and similar initial concentration. Outdoor temperature and wind intensity and direction were measured during the tests. The observed ranges of values among the tests were compared, checking for similar outdoor conditions. This check is a fundamental aspect to ensure comparable testing conditions during the asynchronous measurements and to have the closest condition to a controlled testing environment (such as within a lab or with mechanical ventilation). In particular, wind direction and speed had been significantly stable throughout the tests within 1.5–2 m/s with a south–west direction (detailed measurements of wind intensity, wind direction, and solar radiation during the testing campaign are reported in the Supporting Information, Sections S7 and S8).
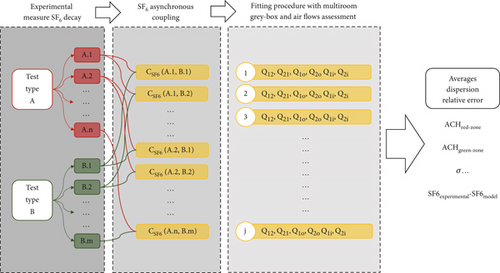
The TG samples were taken in a way to assure sufficient accuracy in measuring the gas room mean concentration without the necessity of using mixing fans (which would interfere with the airflow paths created by the natural ventilation mechanisms, introducing perturbations to the phenomenon under investigation). This sampling procedure will be described in Section 3.3.
The air change rates and interzonal airflows were then estimated using a gray box model based on the mass conservation of the TG.
- −
the source term (or the quanta emission rate) q is equal to zero (the TG is injected, mixed, and then the injection is stopped)
- −
the TG is absent from the normal composition of the outdoor air; hence, C2i = C1i = 0
- −
well mixing occurs in the two rooms
This system contains four unknown air flow rates Q and only two known variables ( and obtained from the experimental measurements). Therefore, it was solved numerically, assuming that the systems of Equation (3) are a gray box model of the tracer concentration evolution in the tent prototype. The model parameters that need to be identified are the air flow rates: Q1o, Q12, Q2o, and Q21.
The two additional unknowns of the problem, represented by the two fresh air flow rates coming from the outdoor and ventilating the patient’s and doctor’s room (Q1i and Q2i, Figure 2), can subsequently be found using the two mass conservation equations for the air (Equation (2)).
The iterative algorithm for minimizing the error function is based on the generalized residual gradient (GRG2) nonlinear method, applied with a residual tolerance of 10−8. Further, the minimization of the error function in [5] was bounded with a conservation constraint on the volumetric air flow rate in each room derived from the system of Equation (2).
Although the proposed asynchronous single TG method is less rigorous and less accurate than traditional multigas, multipoint procedure, it was selected due to its practicality and adaptability to real field conditions. The method significantly simplifies logistics, requiring only one TG and one analyzer, with sequential sampling between the red and green zones. This approach emerged as the only viable solution for field testing within the constraints of the INITIATE2 project, where rapid deployment, minimal personnel, and limited instrumentation were necessary. Moreover, the development of this methodology responds to broader limitations of currently available measurement equipment, which are typically slow, complex, and not suited for short-duration campaigns in low-resource environments. While not optimal, this solution provided robust and actionable insights into ventilation dynamics under realistic conditions. Building on these results, further research has been launched to develop low-cost, fast-response TG networks for extended monitoring and improved accuracy. More detailed tests and refined prototypes will follow in the next phases of the tent’s design and validation process.
3.3. The Experimental Campaign
The experimental campaign was done on the tent prototype shown in Figure 1c,d. Three different scenarios were investigated as far as the natural ventilation system is concerned (Figure 4). In the first, all the windows in the patient rooms were closed. In the second, two of the smaller windows were open, and finally, in the third, all the windows were opened (maximum potential ventilation of the red zone). The configuration of the doctor’s area remained unchanged for all the tested cases, with closed windows/doors.
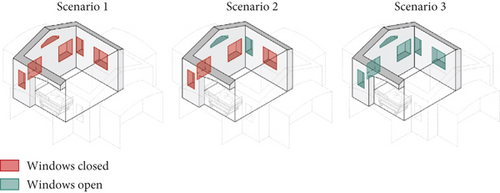
Measurements were done in June, and the testing activity lasted 2 days in order to gather comprehensive data for all the scenarios. In total, 10 tests were performed/repeated for Scenario 1 with analogous boundary conditions, 11 tests for Scenario 2, and 8 tests for the Scenario 3.
The SF6 concentration was measured by means of a photoacoustic gas monitor (Lumasense Innova 1512) equipped with a 16-bit analog/digital converter that provides a ±0.25% zero drift, ±0.5% full-scale accuracy, and 1% repeatability. The gas sampling was carried out simultaneously in four different locations within the same room by means of a 6-mm Rilsan tube. The flow rates coming from these four branches were thoroughly mixed and sent to the gas analyzer to obtain a measurement of the gas room mean concentration without using mixing fans. The SF6 was injected into the patient’s room for a duration of 10 s using a 10-L vessel pressurized to 11 bars. This resulted in an initial concentration of the decay (C0) between 100 and 160 ppm in most tests (Table 1). The decay time varied across scenarios: in the first scenario, it took 20–24 min to reach half of C0, while in Scenario 2, the time decreased to 2–5 min due to increased ACH, and in Scenario 3, it fell to under 1 min. As mentioned in Section 3.2, the cases with large airflow rates are challenging to test because a very fast sampling would be needed, and the gas monitor was struggling to keep pace with the decay. As a result, few measured points of the exponential decay were available for the fitting procedure.
| Scenario | Window status | Test label | Monitoring room | C0 (ppm) | Cmax | Test duration (minutes) | Time for C/C0 = 0.5 (minutes) | Time for Cmax (minutes) |
|---|---|---|---|---|---|---|---|---|
| — | — | — | — | |||||
| 1 |
|
A.1 | Red | 156.5 | — | 56.4 | 19.8 | — |
| A.2 | 181.3 | — | 60.2 | 20.9 | — | |||
| A.3 | 174.1 | — | 71 | 23.4 | — | |||
| A.4 | 136.5 | — | 78.3 | 20.9 | — | |||
| A.5 | 131.4 | — | 56.3 | 19.5 | — | |||
| A.6 | 132.2 | — | 85.9 | 24.3 | — | |||
| B.1 | Green | — | 29.7 | 119.7 | — | 19.9 | ||
| B.2 | — | 31.4 | 135.5 | — | 20 | |||
| B.3 | — | 37.6 | 140 | — | 23.4 | |||
| B.4 | — | 29.3 | 126.1 | — | 25.6 | |||
| B.5 | — | 30.5 | 122.4 | — | 13.7 | |||
| 2 |
|
A.1 | Red | 116.6 | — | 35.4 | 3.9 | |
| A.2 | 112.7 | — | 31.5 | 3.9 | ||||
| A.3 | 102.2 | — | 26.4 | 2.9 | ||||
| A.4 | 179.5 | — | 28.3 | 2 | ||||
| B.1 | Green | — | 9.0 | 82.3 | — | 4.9 | ||
| B.2 | — | 11.3 | 60.5 | — | 4.9 | |||
| B.3 | — | 7.4 | 50 | — | 2.9 | |||
| B.4 | — | 9.3 | 70.2 | — | 8.2 | |||
| B.5 | — | 7.7 | 57.4 | — | 9.7 | |||
| 3 |
|
A.1 | Red | 52.1 | — | 3.9 | 1 | |
| A.2 | 87.4 | — | 3.9 | 0.9 | ||||
| A.3 | 114.6 | — | 4.9 | 1 | ||||
| A.4 | 144.5 | — | 4.9 | 0.9 | ||||
| B.1 | Green | — | 7.4 | 22 | — | 4.9 | ||
| B.2 | — | 5.0 | 22.5 | — | 2.9 | |||
| B.3 | — | 7.8 | 22.8 | — | 2 | |||
| B.4 | — | 4.7 | 34.4 | — | 2.9 | |||
The experimental campaign generated numerous fitting functions, C(t)1, C′(t)1, ⋯ and C(t)2, C′(t)2, ⋯, which were subsequently coupled using the asynchronous method shown in Figure 3. By repeating the fitting procedure across different combinations of virtually identical tests within the same scenario, the robustness of the data analysis was enhanced, enabling quantification of result uncertainty and improving the accuracy of the results. For example, in Scenario 1, five test repetitions were done for each test type: A (labeled from A.1 to A.n) and B (labeled from B.1 to B.n). Using a combinatorial approach, all possible pairings of Test A and Test B were analyzed. The gray box model was applied to each combination, producing estimates of the interzonal airflows (Q12 and Q21) as well as of the other ventilation parameters (Q1o, Q2o, Q1i, Q2i). This resulted in a comprehensive table of airflow rates based on different test pairings. By analyzing the dispersion of these values across all combinations, the average value and the standard deviation were calculated, also providing a measure of the uncertainty for the estimates. This approach not only validated the model’s robustness but also highlighted the reliability of the experimental setup despite the inherent limitations of using asynchronous single-gas decay techniques. Such a combinatorial analysis provides insights into the variability of the results, offering a more in-depth understanding of the system’s ventilation performance, as will be discussed in the next sections.
4. Results and Discussion
4.1. Experimental Results—Concentration’s Time History
Figure 5 shows the tracer decay of the various sequential Tests A and B (detailed test reported in Supporting Information S1, S2, and S3) for each of the three scenarios (the various curves in a single chart represent the several repeated decay tests done for the same configuration). Despite the nonideal measurement setup using single-gas, single-point monitoring rather than multigas, multipoint method, the majority of concentration trends showed a rather good repeatability, with few exceptions.
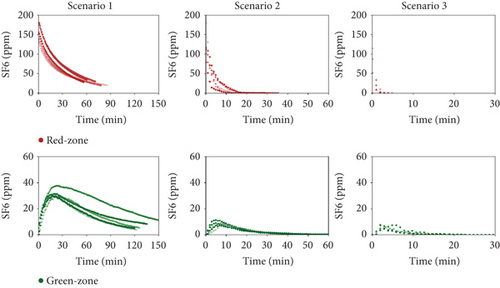
In the red zone, where the SF6 was injected, the decay consistently followed an exponential pattern after the injection stopped. Conversely, the green zone displayed a more complex fluid dynamic behavior. Theoretically, a perfectly airtight transparent partition between the red and green zones would prevent any TG from entering the doctor’s room. However, as shown in Figure 5, the SF6 concentration in the green zone “mirrors,” with some delay, the concentration in the red zone.
The air leakage that—evidently—occurs between the patient and the doctor areas determines an airflow from the red to the green room with a consequent transport of TG (room one is characterized by a very high value). This causes a rise of SF6 concentration in the doctor’s rooms at the beginning of the test, with peak values, Cmax, that are reached after 3 min for Scenario 3 and about 20 min for Scenario 1, from the start of the decay (Table 1). After this initial growth, the dilution/removal effect due to the fresh air flows (e.g., Q2i and Q1i in Figure 2) takes over, and the SF6 concentration in the doctor’s room begins to follow an exponential decay pattern.
It is worth noting that, on average (among the different trials), the ratio between the peak value in the green zone and the initial concentration of the tracer in the red zone (C0, that is, the peak concentration in the red zone) is equal to ~21% for Scenario 1, ~7% for Scenario 2, and ~6% for Scenario 3. The results for Scenario 3 appear to be incoherent with the expected trend. That is, peak concentration values in the green zone should, predictably, become lower and lower as much as the opened area of the windows (and, hence, the ventilation flow rates) in the patient room increases. This indeed occurs passing from Scenario 1 to Scenario 2 but does not happen for Scenario 3.
Such a result could be due to the definitely lower accuracy of the measurements for Scenario 3 (the decay is very fast and, hence, there are fewer experimental points available for the fitting procedure), but it could also be a real behavior of the tent prototype. In fact, when the open area of the windows is large (as for Scenario 3), the wind-driven air flow entering through such wide apertures could determine an overpressure in the red room with respect to the green room, thus increasing the leakages and partly hindering the effectiveness of the dilution process. This behavior requires to be investigated in a further phase of the research and the tent design will have to consider such risk.
Nevertheless, even if there is ample room for future improvements, it must be noted that the conditions in the doctor’s room are far better compared with those in the patient’s room, with lower tracer/pollutant concentrations and absorbed doses (e.g., the concentrations are high for shorter times).
The dilution and removal mechanisms, although not exploited optimally in Scenario 3, allow anyway to keep the concentration in the doctor’s zone rather controlled, with a Cmax value that decreases from 31.7 ± 2.4 ppm in the first scenario to 8.7 ± 1.2 ppm in the second scenario and to 6.2 ± 1.4 ppm in the third scenario. Increasing the surface of open windows promotes stronger natural ventilation, helping to reduce contaminants and, consequently, lowering the risk of infection from airborne pathogens (though some cautions have to be taken due to the potential drawbacks highlighted in Scenario 3).
The relatively high tracer concentrations found in the doctor’s room during the experiments were, to some extent, unexpected and definitely an undesired outcome. The concentration profiles plotted in Figure 5 for the green area indicate that, despite all the design efforts, casual openings in the transparent partition, such as those used for gloves, patient access, or equipment wiring, allowed for significant air exchange between the two rooms and that the natural ventilation system was not able to assure a constant and consistent unidirectional air flow path from the green to the red zone, thereby compromising the isolation of airborne pathogens to some extent.
In order to assess the level of criticality of such air exchange in relation to the infection control, the interzonal air flow rates (Q12, Q21) and the air flows exchanged with the outdoor (Q2i, Q1i, Q2o, Q1o) must be quantified. For this sake, the gray box model illustrated in the previous section was applied.
4.2. Air Flow Rate Assessment
Based on the simplified multizone gray box model, the six unknown ventilation flow rates were assessed by applying the fitting procedure highlighted in Section 3.2. The model parameters were identified using the experimental tracer decay curves discussed in the previous section.
Figure 6 shows, as an example, the comparison between the measured and predicted concentration–time profiles for one combination of decay experiments and for each scenario (it has to be reminded that for each scenario, experiments were repeated many times under analogous boundary conditions). Thanks to the greater number of measured points collected during Scenario 1 (where the tracer decay lasted longer), the agreement between numerical and experimental data is quite remarkable (Figure 6a). The faster decay of the tracer concentration during Scenario 2 reduced the number of available experimental points roughly to one-half (Figure 6b), worsening the quality of the fitting. Finally, the extreme speed of decay of the concentration during the analysis of Scenario 3 made the identification accuracy quite poor (Figure 6c). When the ventilation air flow rates are as high as in the case of Scenario 3 (with ventilation time constants in the order of magnitude of 1–2 min), the instruments available on the market become unsuitable for the study because their maximum sampling rate is too slow to be able to properly follows the phenomenon in an accurate way.
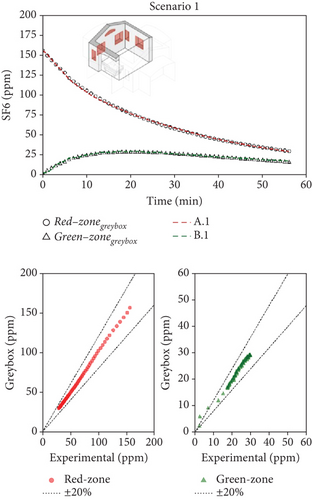
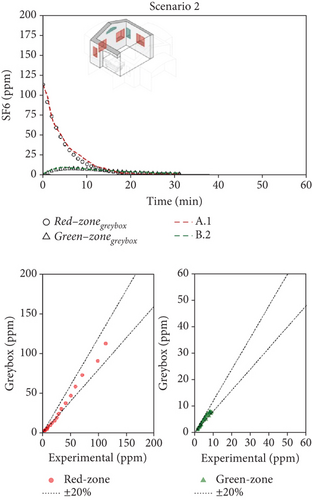
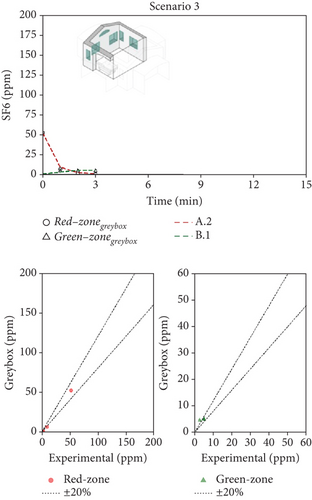
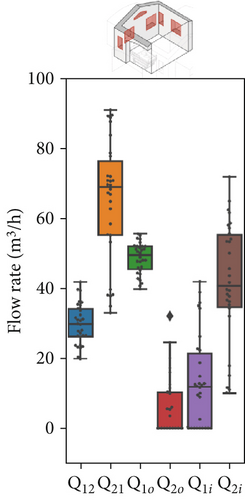
The model/experiment comparison shown in the lower part of Figure 6 indicates that the simulation agrees with experimental data within ±20% across all tests for Scenarios 1 and 2. However, limited data availability for Scenario 3 prevents a broad conclusion. Additional details, including the complete set of fitting results for each scenario, all available tests, and their combinations, are provided in Supporting Information S4, S5, and S6 for Scenarios 1, 2, and 3, respectively. The average (mean values across various tests) airflow rates measured for the three scenarios are summarized in Table 2. Considering Scenario 1, the interzonal airflow rate from the red zone to the green zone (Q12) was, on average, 30 m3/h. Considering all the various repeated measurements done with this window configuration, Q12 ranged from about 20 to 40 m3/h. Because the volume of the green zone is 21.3 m3, the volumetric air change rate, potentially carrying airborne biological contaminants, ranges from 0.94 to 1.9 1/h. It is an unexpected result since this flow rate is rather high, while the design expectations aimed for negligible air exchange between the two zones. Nonetheless, the adverse effects of this high flow rate are partially balanced by the effective dilution of fresh air entering the green zone (Q2i = 41 m3/h). It is worth noting how the fresh air flow rate into the patient room (Q1i) is very low, and the exhaust air flow rate (Q1o) is comparable to the interzonal air flow from red and green zones. It means that, in practice, the ventilation of the patient room happens almost entirely thanks to the air coming from the green zone (Q21 = 65 m3/h).
| Scenario # | (m3/h) | (m3/h) | (m3/h) | (m3/h) | (m3/h) | (m3/h) | ACHred | ACHgreen |
|---|---|---|---|---|---|---|---|---|
| 1 | 13 | 41 | 49 | 6 | 30 | 65 | 2.5 | 3.3 |
| 2 | 0 | 435 | 435 | 0 | 50 | 484 | 15.2 | 22.7 |
| 3 | 1407 | 147 | 1398 | 210 | 69 | 4 | 45.8 | 10.0 |
For Scenario 2, a comparison of Figure 7a,b shows that the interzonal airflow rate from the red to green zone has similar absolute values, with an average rate (Q12) of 40–50 m3/h. However, notable differences are seen in the air exchange rates between rooms and the outdoors. Here, the inflow of fresh air into the green zone () and the outflow from the red zone () are nearly equal at 435 m3/h, indicating a marked shift in flow patterns and a stronger internal airflow from the green to the red zone, averaging 484 m3/h. This airflow configuration is especially advantageous for managing patients with potential airborne infections. Specifically, maintaining an airflow approximately nine times higher from the red to green zone than in the reverse direction creates safer conditions, reducing transmission risk for healthcare workers during emergency operations. However, it has to be noted that, depending on the wind direction/speed and/or indoor–outdoor temperature difference, the airflow path may reverse its direction.
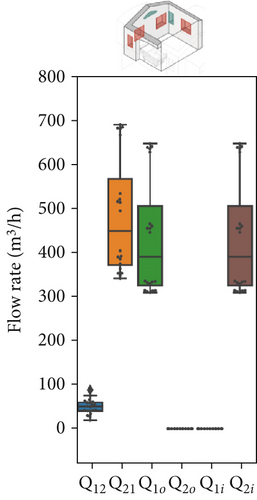
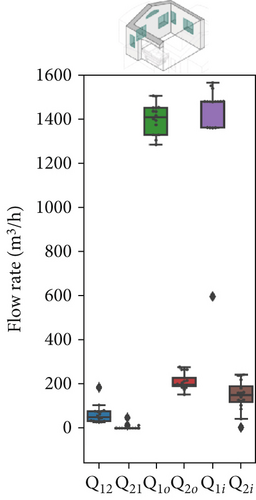
In Scenario 3, fully opening the window significantly increased the airflow exchanges between the red zone and the outdoors (with Q1i and Q1o both around 1400 m3/h). This balance likely influenced the pressure differences between the zones; notably, the interzonal exchange from the green zone to the red zone decreased drastically (with Q21 approaching zero). Meanwhile, the airflow that contaminates the green zone (Q12) remains consistently high, similar to the previous scenario. However, due to the increased dilution in the red zone, even though this contaminated airflow is still substantial, the concentration of contaminants will decrease over time, as suggested by the SF6 trends in Figure 6c.
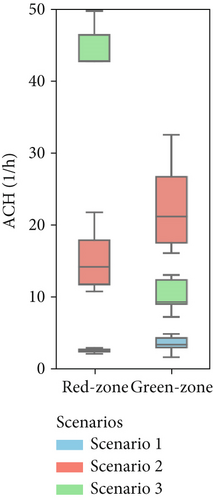
Figure 7 presents the variation in model parameters identified for each asynchronous coupling across scenarios. In Figure 7a, representing Scenario 1 with closed windows, there is a certain fluctuation in fitted flow rates, reflecting slight variations in outdoor conditions like temperature and wind speed throughout the day. Minor temperature and air velocity shifts between tests likely account for the observed fluctuations, as the relative pressure difference between the two rooms is influenced by these factors, leading to variations in airflow rate values and increased data dispersion. However, in Scenarios 2 and 3 (Figure 7b,c), the impact of external disturbances on flow rates progressively diminishes due to higher average values of each flow rate. As a result, fitted values exhibit less dispersion, and data points are more concentrated around the median. The enhanced natural ventilation (Figure 7d) achieved by opening the patient room window increases the fresh air flow rate (ACH rises from approximately 2–3 ACH in Scenario 1 to over 15 ACH), improving contaminant dilution in both rooms.
In this multizone setting with interzonal air exchanges, fresh air dilution cannot be strictly linked to the ACH values. Some pathogenic contaminants may recirculate from the red to the green zone and back, reducing the effective dilution impact of ACH in the red zone. In this case, airflow from the green zone into the red zone does contribute to dilution, as it contains fewer contaminants than the air in the red zone, but it should not be considered “fresh” air. Conversely, in the green zone, only flow rates originating from the outdoors have a dilution effect; any other airflow will increase contaminant concentration rather than reduce it. The partial window opening in Scenario 2 increased the air change rate by an order of magnitude in both zones (from 1–4 ACH to 10–22 ACH as shown in Figure 7d), aligning with CDC and WHO ventilation recommendations. However, fully opening the windows in Scenario 3 significantly altered flow dynamics and recirculation patterns. Although this setup raised the ACH in the red zone considerably (close to 45 ACH), it had a less favorable impact on the green zone, where the ACH dropped to around 10 ACH. We remark that these results have been obtained with a wind direction stably from the sector N-NE. Patient room in the experimental setting was in leeward position (monitored wind direction and intensity reported in Supporting Information S7 and S8).
4.3. Transmission Risk Assessment
- a.
the healthcare worker and the patient stay permanently in, respectively, the green and red rooms
- b.
the patient is emitting a constant rate of quanta, q
- c.
the outdoor and interzonal air flow rates are constant over time
- d.
a perfect mixing is achieved in Rooms 1 and 2 (that means , )
- e.
the concentration of quanta in the outdoor air is zero, neglecting eventual intake of quanta due to possible short-circuit between indoor exhaust, and outdoor fresh intakes
- f.
the quanta are not subject to any settling, and the passage through the transparent separating layer does not affect the quanta concentration (e.g., the effect of separation, filtration, or captation by the transparent layer on the suspended particles in the interzonal air stream is neglected)
Under these assumptions, the quanta-transporting particles behave like a passive tracer, and the mass conservation of quanta becomes analogous to the mass balance equations of TG, represented by the system of Equation (3).
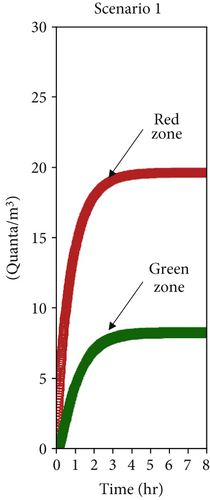
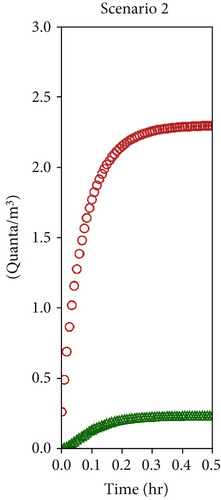
The numerical solution of the system of Equation (10), assuming a single patient in the red zone emitting 1000 quanta/h (equivalent to a light exercise metabolic activity while speaking [69]) and considering the average ventilation air flow rates estimated in Section 4.2 (Table 2), allowed to assess the time evolution of the quanta concentrations in the doctor’s and patient’s room as reported in Figures 8a, 8b, and 8c, respectively, for Scenarios 1, 2, and 3. The resulting steady values of concentration of quanta are reported in Table 3 and are reached, respectively, after 4 h, 30 min, and 10 min, depending on the analyzed ventilation scenario.
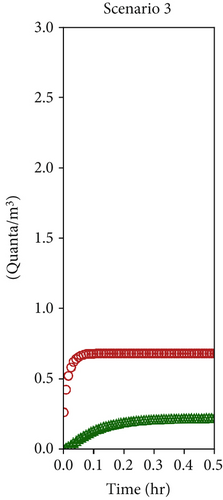

| Scenario # | (quanta/m3) (green room) | (quanta/m3) (red room) |
|---|---|---|
| 1 | 19.6 | 8.2 |
| 2 | 2.3 | 0.2 |
| 3 | 0.7 | 0.2 |
As discussed in the previous section, the most significant differences occur between Scenario 1 and Scenario 2. In Scenario 2, contaminant concentrations decrease tenfold in both zones, and the faster dilution reduces the timeframe from 4 h to just 30 min. Conversely, Scenario 3 does not introduce any substantial improvement for healthcare operators, as the quanta concentration remains unchanged. However, it still positively impacts contaminant reduction in the red zone. While the W-R model assumes steady-state conditions, which may not fully reflect the dynamic nature of real emergency settings, its application here is justified by the study’s focus. The objective was not to provide exact transmission probabilities for specific pathogens but rather to evaluate the relative impact of different natural ventilation strategies on airborne transmission risk. This approach aligns with ISO 16798, which allows dynamic conditions to be segmented into constant intervals for analysis. As shown in the results, the transition to steady-state conditions is scenario-dependent, ranging from 30 min in well-ventilated settings to several hours in poorly ventilated ones. During these periods, real-life variables—such as healthcare personnel entering or leaving the room or wearing varying levels of personal protective equipment—may reduce actual exposure. Therefore, using the final steady-state quanta concentration (Table 3), as done here, represents a conservative estimate. It likely overstates the risk, ensuring a precautionary basis for design and comparison. This strengthens the methodology’s value as a tool to assess and optimize passive infection control strategies in emergency healthcare environments.
From an infection probability perspective, the graph in Figure 8d clearly illustrates the beneficial effect of increased ventilation in lowering the risk. Healthcare operators in the green zone experience the greatest reduction in infection probability in both Scenarios 2 and 3. Specifically, within the first hour of operations, the infection risk in both scenarios is reduced by approximately 90% (with no significant difference between the two scenarios, as previously explained). Meanwhile, operators in the red zone also experience benefits, with differing effects between Scenarios 2 and 3. Taking the first hour as a reference, the infection probability in the red zone decreases by 27% in Scenario 2 and by 68% in Scenario 3.
Although the transparent barrier separating the patient and healthcare areas is not perfectly airtight, this outcome was anticipated due to the multiple functional requirements and constraints inherent to emergency tent deployment. The barrier needed to support essential patient interaction, medical equipment access, and rapid assembly in field conditions. These requirements make fully sealed solutions impractical within the context of cost, logistics, and usability. Rather than aiming for complete air tightness, the study focused on quantifying the actual interzonal airflow and evaluating whether natural ventilation could compensate for this permeability. Results show that despite the nonideal separation, natural ventilation (when properly configured) can play a significant role in reducing airborne transmission risks. This highlights a critical trade-off: instead of pursuing technically complex or cost-intensive barrier solutions, the combination of a carefully designed airflow strategy may provide an effective, low-resource alternative for cross-infection mitigation. The proposed methodology enables such performance to be evaluated directly on-site, supporting future improvements without compromising deployability or scalability in real-world emergency contexts.
4.4. Considerations on the Dependency From Outdoor Climatic Conditions
As highlighted in both the methodology and results, one of the main challenges of conducting on-field measurements is the variability of outdoor weather conditions. For this study, wind intensity and direction were the primary external factors influencing the ventilation regime, with solar radiation also playing a secondary role by inducing thermal gradients that affect airflow (e.g., pressure differences due to temperature-driven density variations). To account for these influences, we continuously monitored wind speed, wind direction, and solar radiation during the decay tests to ensure consistency within each ventilation scenario. Detailed recordings of these conditions are provided in Supporting Information S7 and S8. Maintaining uniform environmental conditions (particularly wind-related parameters) is essential for applying the asynchronous methodology developed in this study. Because the SF6 decay tests in different zones were not performed simultaneously, variability in outdoor conditions across tests would compromise the ability to accurately compare decay curves or perform reliable curve fitting via error minimization.
By ensuring relatively consistent external conditions during testing, we approximated a controlled environment as closely as possible in a real-world setting. However, this also introduces a limitation: the measured ventilation performance reflects only the specific climatic conditions observed during the 2-day experimental campaign (e.g., wind speeds between 1.5 and 2 m/s, predominantly southwestern wind direction, and solar radiation ranging from 700 to 1000 W/m2).
A more comprehensive characterization would require testing across a full range of wind directions and intensities, which is not feasible within a short or prescheduled time window. This constraint is not unique to our study but is common to all research focused on natural ventilation in real-world applications. Factors such as the high cost of TG equipment, the environmental impact of SF6, and the labor-intensive nature of prolonged fieldwork make large-scale variability analysis impractical. These challenges point to the urgent need for alternative approaches, including the development of low-cost, automated systems capable of multigas and multipoint monitoring over extended periods (e.g., several months). Such systems would enable more comprehensive assessments of natural ventilation, particularly in the context of reducing airborne pathogen transmission risk. In this context, the asynchronous single-gas tracer methodology proposed in this study offers a practical and robust approach for evaluating ventilation performance in field conditions—provided that external environmental variability remains within acceptable limits during testing.
5. Conclusions
The evaluation of the tent prototype performance through multizone ventilation analysis has demonstrated notable insights and areas for further refinement in designing emergency response structures for airborne pathogen control. This study used a simplified experimental approach based on an asynchronous decay of TG (SF6) combined with a multizone gray box model, which, despite some limitations, effectively highlighted the variability in airflows and provided meaningful data on interzonal exchanges and overall air change rates across the tent’s different ventilation scenarios.
The multizone model’s analysis of three ventilation scenarios has revealed a substantial variation in interzonal airflows, air change rates, and contaminant dispersion under different operational conditions. The data indicated that under controlled window configurations, significant airflow was unintentionally transferred from the red (patient) zone to the green (healthcare) zone, suggesting a higher-than-expected interzonal exchange rate that could potentially hinder the containment of airborne pathogens. Notably, Scenario 2, characterized by a partial window opening, achieved ventilation conditions aligned with CDC and WHO recommendations, decreasing the risk of airborne infection in both zones. In contrast, Scenario 3, with fully open windows, although it optimized ventilation in the red zone, compromised the green zone’s air change rate. These results apply for a stable wind direction, and patient room in leeward position.
The prototype tent design’s reliance on natural ventilation yielded mixed results. While effective in maintaining fresh air inflow and diluting contaminants, the unintended airflow between zones requires attention. The air exchanges between the red and green zones could be partly due to the nonperfectly air proof transparent shield, but they could also happen because of short circuits of air through the outdoors (that is, contaminated air exhausted from the patient room could re-enter into the doctor room). Although during daytime and clear sky the solar radiation aids pathogen inactivation in these outdoor exchanges, a design that carefully locates the air inlet/outlet of the ventilation system and avoids short circuit and re-entry is necessary.
Moreover, a rethinking and an optimization of the transparent barrier is needed to assure a better airtightness and enhance control over airflow paths and interzonal contamination. The methodology implemented in this study helped identify critical design issues, and optimized solutions are going to be integrated into a new version of the tent prototype. These include tighter sealing systems for wire passages and a redesigned red zone with a unified environment, eliminating the need for internal separation elements.
Finally, since natural ventilation may not be able to provide fully consistent air flows over the time, future refinements of the tent design should also explore the possibility of integrating easy-to-deploy and low-cost mechanical ventilation systems, especially for high-risk, pathogen-exposure applications.
The lab-grade photoacoustic equipment used to monitor SF6 decays provided accurate concentration measurements but requires approximately 1 min per sample, which presents limitations. Given this delay, the equipment captures only an averaged concentration over this interval rather than an instantaneous value, potentially losing rapid concentration fluctuations in high-ACH scenarios. Moreover, especially when the air changes are high and the decay occurs rapidly, the lower sampling resolution led to a scarcity of data points, which reduced the accuracy of the fitting procedure with the gray box model.
This last revealed to be a good solution for providing the possibility of doing a single-gas decay test to assess the interzonal air flow rates. Therefore, from the practical point of view, it was excellent for the given measurement conditions and the for the type of experiments that were needed. However, it also presented higher inaccuracies compared to traditional multipoint/multigas decay tests.
To improve the reliability of this approach, faster, multipoint, multigas apparatuses with higher sampling rates, capturing more granular data and supporting more accurate modeling even at high ACH levels, are required. Such developments would help counteract the gray box model’s tendency to average out rapid concentration shifts, thereby increasing reliability in high-exchange conditions.
Future measurement equipment should prioritize faster sampling rates to capture finer variations in concentration decay, especially for more accurate modeling at elevated ventilation rates.
In this paper, the cross-infection risk assessment was primarily based on the assumption of a TG dispersion rather than particle-based measurements (like it is suggested for example in ASHRAE St. 241-2023).
Particles are able to mimic more closely the behavior of a droplet nuclei (< 5 μm aerosol particles, relevant in cross-room infectious disease transmission) and can account for settling and captation phenomena compared to a gas. On the other hand, these procedures are still less well established and much more difficult to be done compared to a TG measurement. Moreover, the risk analysis done on the base of a passive TG tends to overestimate the infection probability and, therefore, it provides a more precautionary forecast.
Future studies could include tracer decay methodologies tailored to particles comparable in size to droplet nuclei to better approximate real-world infection risks and further support accurate risk assessment in such tent designs.
In conclusion, the findings of this study underline the importance of precise interzonal airflow control, real-time concentration monitoring. These insights, combined with future advancements in fast-response, high-resolution measurement equipment and refined airflow models, will support the development of safer, more effective emergency medical response environments.
Nomenclature
-
- WHO
-
- World Health Organization
-
- CDC
-
- Centers for Disease Control and Prevention
-
- ACH
-
- air change per hour (1/h)
-
- SF6
-
- sulfur hexafluoride
-
- NV
-
- natural ventilation
-
-
- air flow rate (m3/h)
-
-
- average flow rate over time (m3/h)
-
- C
-
- concentration (1/m3, ppm)
-
- C(t)
-
- concentration over time (1/m3, ppm)
-
-
- average concentration over time (1/m3, ppm)
-
- V
-
- room volume (m3)
-
- t
-
- time (s, min, h)
-
- P
-
- probability
-
- I
-
- number of infectors
-
- p
-
- pulmonary ventilation rate (m3/h)
-
- q
-
- quanta rate emission (1/h)
Conflicts of Interest
The authors declare no conflicts of interest.
Funding
All authors acknowledge for the research the initiative INITIATE2 launched by World Food Programme (WFP) and WHO and the WHO-Téchne. Vincenzo Gentile and Marco Perino acknowledge for the research activity presented in this paper the National Recovery and Resilience Plan (NRRP), Mission 4 Component 2 Investment 1.3—Call for tender No. 1561 of 11.10.2022 of Ministero dell’Università e della Ricerca (MUR), funded by the European Union–NextGenerationEU, Award Number: Project Code PE0000021, Concession Decree No. 1561 of 11.10.2022, adopted by Ministero dell’Università e della Ricerca (MUR), CUP E13C22001890001, according to attachment E of Decree No. 1561/2022, project title “Network 4 Energy Sustainable Transition – NEST.”
Endnotes
1In this case, given the very short time constant of the phenomenon, the hypothesis of steady-state regime for the air is done (which is typical in the studies of ventilation).
2In this study the assumption of perfect mixing in the doctor and patient rooms and the hypotheses that the droplet nuclei are integrally transported by the air flows, with negligible filtration and settling phenomena, are done. Further research is needed to also investigate the effect of a nonuniform distribution of the pathogens in the two enclosed spaces and of the filtration effect during the passage through the transparent sheet. This last hypothesis may lead to an overestimation of the quanta concentration with respect to the real phenomenon and is, therefore, more conservative as far as the assessment of the risk of cross-infection is concerned.
Open Research
Data Availability Statement
The data that support the findings of this study are available from the corresponding author upon reasonable request.


