Exploring the Feasibility of Solar-Driven Desalination for Drinking Water in Chabahar, Iran
Abstract
Drinking water of high quality is one of the most important concerns for human survival. Producing potable water through the reverse osmosis (RO) method and powering it with solar energy is suitable for energy consumption, economics, and quality. The goal of this study is to provide drinking water for the city of Chabahar using the RO method powered by solar energy using HOMER V2.81 software. The question of how many solar cells and converters are needed for the required system and the impact of exchanging solar electricity with the grid, considering the incentivized solar electricity purchase tariff, has not been addressed previously. The systems under review utilize grid backup (on-grid scenario) and diesel generator backup (off-grid scenario) and are evaluated in 6 and 12-h power supply scenarios. The results showed that the G-12 system (on-grid with a 12-h power supply) is the most economical option, with the cost of electricity generation being $0.045/kWh. This optimal economic system includes a grid, a 120-kW PV, and a 75-kW converter, and with solar power generation of 206,656 kWh/year, it prevents the emission of approximately 65 tons of CO2 per year. For the off-grid scenario, the most economical option, with a cost of $0.227/kWh, is also the 12-h power supply (offG-12), which includes a 120-kW PV, a 10-kW generator, 75 batteries, and a 25-kW converter. For the offG-12 system, the annual CO2 emissions are about 9.3 tons.
1. Introduction
Given the high levels of pollution produced by fossil fuel power plants, the demand for renewable energy is growing rapidly [3]. Among renewable energies, solar power is the most affordable and accessible, offering a quiet, safe, clean, and renewable energy source, making it an ideal option for achieving clean energy goals [4]. Off-grid power plants are particularly important because they provide solutions to challenges in supplying water to remote areas (especially those prone to drought) or to industrial or residential units where supply is risky or expensive. Solar-powered desalination systems can address these issues.
Providing potable fresh water from the sea for southern regions of the country presents a significant challenge. In this study, a solar-powered system for supplying fresh water via a solar desalination unit is proposed using the hybrid optimization of multiple energy resources (HOMER) software in the city of Chabahar. A review of related studies will follow, with an effort to present the detailed findings of each work to highlight the existing research gap and underscore the necessity and importance of the current study.
In 2020, Tadesse and Merkneh [5] studied a solar-powered groundwater pumping system for domestic water use in Bilate Basin, Ethiopia, using HOMER software. The system had to supply 15 m3/day for 10 households from a depth of 13 m. The optimal system included a 600-W solar panel, a 600-W converter, and 3 MightyMax batteries. The PV-based system produced 241 kg less CO2 per year and had a total net present cost (NPC) that was $267 lower compared to a traditional diesel generator system.
In 2020, Ahsan et al. [6] examined the economic feasibility of seawater desalination in Chittagong using solar energy. Chittagong was chosen due to its lack of access to drinking water and vulnerability to climate change. HOMER and WinFlows software were used for the analysis, which showed a desalination cost of $0.00191 per liter.
In 2020, Rezk et al. [7] optimized and managed a hybrid solar–diesel–battery system for water pumping and treatment in Minya, Egypt, using HOMER software. The optimal system had a total NPC of $207,676 and an LCOE of $0.074, including 120-kW solar panels, a 10-kW diesel generator, 64 batteries, and a 50-kW converter. This system emitted 117,677 kg of CO2 annually.
In 2021, Amoroso et al. [8] simulated solar energy systems to supply power to a desalination system on Floreana Island, Ecuador. They analyzed both on-grid and off-grid systems using HOMER Pro software. The results showed that the off-grid system had an LCOE of $1.08, while the on-grid system had an LCOE of $0.3. The higher cost for the off-grid system was due to an excess production of 11,440 kWh/year of electricity.
In 2021, Mousavi and Iqbal [9] designed a solar–battery system to provide drinking water using an RO system for a household in Sinak, Iran, using HOMER Pro and MATLAB/Simulink software. The energy demand was 1.57 kWh/day for the RO system and 5.42 kWh/day for household electricity. The optimal system had 8.34 kW solar panels and 24 batteries arranged in three rows, producing 4642 kWh/year, with 35.9% excess energy.
In 2022, Uddin and Iqbal [10] conducted desalination using RO and solar energy to produce drinking water in Pakistan. The design and economic analysis of the system were performed using HOMER Pro software. The results showed that to supply 12 kWh/day with a maximum load of 3.63 kW, the system consisting of 4.8-kW solar panels and 20 batteries was the most optimal. The cost of electricity production was calculated at 42.04 PKR/kWh.
In 2022, Bertsiou and Baltas [11] analyzed the technoeconomic–environmental aspects of a hybrid power system for drinking water supply and irrigation on a Greek island. The system included wind turbines, solar panels, batteries, and pumped hydro storage (PHS). The results showed that combining PHS reduced the LCOE but increased CO2 emissions, while the battery combination increased autonomy compared to PHS.
In 2023, Amoroso et al. [12] evaluated the technoeconomic feasibility of powering a rural desalination plant in Pile, Ecuador, using solar energy. HOMER Pro software was used to simulate both on-grid and off-grid systems under 12 and 24-h operation scenarios. The results showed that the off-grid system operating for 24 h had the highest total NPC at $477,378 while reducing the operation to 12 h decreased costs by 23.6%. For the on-grid system, since no batteries were used, costs were the same for both scenarios at $149,177.
In 2024, Sohrabi et al. [13] reviewed the technical and economic aspects of integrating renewable energy sources with a brackish water RO plant in Iran. Solar panels and wind turbines were used to generate electricity, and four scenarios were studied: simple, high brackish water tank, variable frequency drive, and a combination of the last two. The results showed that the solar–wind system produced more water, while the solar-only system had lower specific energy consumption.
In 2024, Adda et al. [14] conducted a technoeconomic feasibility study of RO desalination using solar energy in Algeria. The system had a capacity of 2.016 m3/day, and two scenarios were evaluated: one powered by the grid and the other by solar panels. The results showed that the grid-powered scenario had a cost of $0.38/m3, while the solar panel scenario costs $0.33/m3. They concluded that in arid regions, PV systems are preferable to grid electricity.
In 2024, Kafrashi and Iqbal [15] focused on the economic optimization of an off-grid hybrid system for supplying electricity to an RO system in Canada, using HOMER Pro for simulations. Results showed that the optimal system includes 3.19-kW solar panels, a 2-kW wind turbine, a 3-kW diesel generator, and a 32.3-kWh battery, with a net present cost 3.4 times lower than a traditional diesel generator-only system. They also conducted a sensitivity analysis on diesel prices and average annual load.
In 2024, Samy and Elazazy [16] assessed the technical and economic feasibility of a wind–solar hybrid system to find the optimal size for supplying electricity to a 250 m3/day RO unit in Egypt, using HOMER software. Their results indicated that the optimal scenario had an LCOE of $0.104/kWh, which included 200 kW of solar panels, a 100-kW wind turbine, and a 250-kW generator.
Given that solar energy for RO systems is not only an efficient solution but also contributes to the sustainable development of a region, and based on the above studies, it is evident that no feasibility study has been conducted for the target region in Iran. The scientific gap addressed by this work is finding the optimal scenario for economically viable and cost-effective desalination using solar energy as the main power source. The presence of time-of-use tariffs with incentives for renewable electricity purchases, which closely align with real-world conditions, the use of up-to-date equipment pricing data, and the inclusion of pollutant penalty conditions ensure that the results of this study are highly realistic and can serve as a roadmap for energy and water sector decision-makers and investors. Additionally, no previous studies in the region under consideration have compared the use of diesel generators, grid electricity, and batteries as available backup options. Therefore, in the present work, two solar renewable energy systems, both on-grid and off-grid, have been evaluated in Chabahar. Additionally, two power supply scenarios—6 and 12 h—have been assessed, resulting in a total of four scenarios: G-6, G-12, offG-6, and offG-12. The energy–economic–environmental analyses were performed using HOMER V2.81, and the system with the lowest total NPC will be selected as the final solution.
The analysis then covers the study location, the rationale for choosing the site, and proposed solutions for the water scarcity issue. The methodology is outlined, detailing the various steps of the work and the equations governing the different components of the hybrid system studied. Necessary data for simulating different scenarios, result presentation, and discussion of the findings are also included, followed by the conclusion.
2. Study Location
As shown in Figure 1, Chabahar is located in southeastern Iran along the coast of the Oman Sea. Its geographical coordinates are approximately 25 ′ 27° N and 62 ′ 23° E [17]. This geographical position makes Chabahar an important and strategic port.
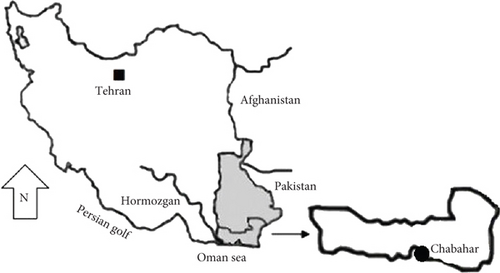
Located in the Sistan and Baluchestan province of Iran, Chabahar had a population of 106,700 according to the 2016 census [18]. The city is recognized as a strategic point in the country due to its geographical and economic significance.
Chabahar has a hot and dry climate, generally characterized by hot summers and mild winters [19]. Due to its high solar radiation, Chabahar has great potential for utilizing solar energy. The average solar irradiation in this region is around 2200 to 2400 h/year, indicating a high capacity for solar energy production.
As one of Iran’s free trade zones, Chabahar holds significant potential for attracting foreign investments and boosting trade. Due to its geographical location, the city can serve as a gateway for trade with neighboring countries.
Given the scarcity of freshwater resources in the region and the need to supply clean drinking water, the use of RO water purification systems is essential. These systems can convert salty or contaminated water into fresh water, helping meet the water needs of residents and agriculture.
3. Methodology
- •
Economic analysis: HOMER allows users to assess investment costs, operational and maintenance expenses, and revenues from energy sales.
- •
Scenario simulation: It enables users to simulate various scenarios for energy system design and select the best option.
- •
Load modeling: HOMER can model electrical loads based on historical or predicted data.
- •
Energy resource optimization: The software determines the optimal mix of energy sources (such as solar panels, diesel generators, and batteries).
In the flowchart shown in Figure 2, the methodology for simulation using HOMER is outlined, covering the various stages of the software’s operation.
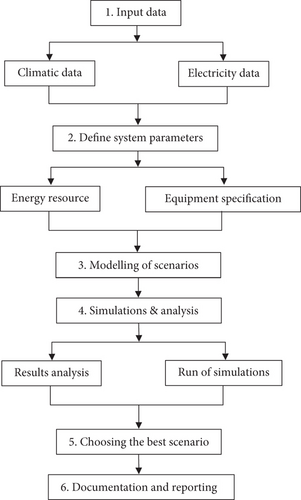
The system studied in this work includes solar panels, electrical converters, and the national grid (in the on-grid mode). In the off-grid mode, the system consists of solar panels, electrical converters, batteries, and diesel generators. Therefore, in Table 1, the equations governing the operation of each of the utilized components are provided. Additionally, since this work includes technical–economic analyses, the equations related to economic calculations are also presented in Table 1.
In Table 1, the governing equations for different parts of the system are presented. Equation (1) represents solar power generation, Equation (2) shows the diesel generator efficiency, Equation (3) depicts the power exchange with the grid, Equation (4) illustrates the battery performance, Equation (5) explains the calculation of the total NPC, and Equation (6) demonstrates the calculation of the LCOE for the system analyzed using HOMER software. Equations (7) and (8), respectively, show the flow rate of permeate water and the specific energy consumption of the RO system water pump.
4. Input Data
Each person needs 3 L of drinking water per day, and desalinating each cubic meter of seawater requires 0.71 kWh of electricity to ensure that the RO system operates properly. Therefore, for the population of 106,700 in Chabahar, 320 m3 of drinking water per day is required. Considering the required water, it is observed that the reviewed system is large scale [30].
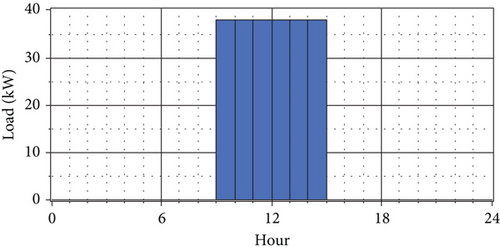
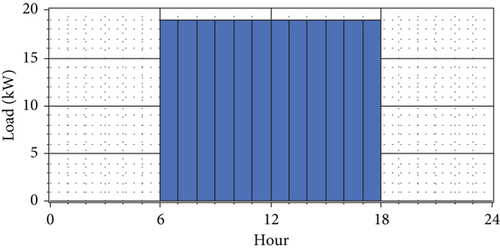
Given the local irradiation conditions and available equipment, it is observed that solar irradiation is possible from 6 AM to 6 PM. To assess the cost-effectiveness of using solar energy during peak hours versus continuous solar electricity production, two scenarios were evaluated. Given that this study considers two scenarios for electricity supply—6 and 12 h—Figures 3(a) and 3(b) illustrate these scenarios. For Scenario (a), the average daily electricity requirement is 227 kWh/day, with a maximum of 96 kW, whereas for Scenario (b), these values are 227 kWh/day and 36 kW, respectively.
Regarding the on-grid and off-grid scenarios, it is important to note that Figure 4 presents the diagram and electricity exchange prices with the grid. According to Figure 4, a three-time electricity tariff is used for balancing with the grid, and renewable electricity purchases are incentivized with a special tariff.

The emissions produced per kilowatt-hour of grid electricity are 632 g of CO2, 2.74 g of SO2, and 1.34 g of NOx, respectively [31].
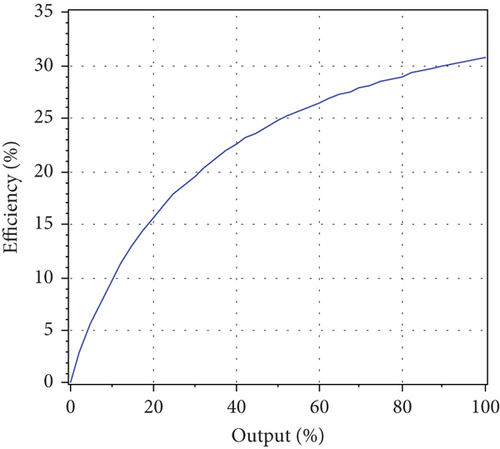
For the off-grid scenario, a diesel generator is used as a backup. Figure 5 presents the power output curve as a function of efficiency for the generator under consideration, with a maximum efficiency of approximately 31%. It is worth noting that this chart is obtained with intercept coefficient and slope parameters of 0.081 L/(h·kW rated) and 0.25 L/(h·kW output), respectively. Regarding the diesel generator and its operation schedule, it should be noted that it operates in an optimized manner, meaning it starts whenever needed.
The emissions produced per liter of diesel fuel consumption for CO, unburned hydrocarbons, particulate matter, sulfurous particulates, and NOX are 6.5 g, 0.72 g, 0.49 g, 2.2%, and 58 g, respectively [32].
| Pollutant type | Emission penalty ($/tons) |
|---|---|
| CO2 | 24 |
| CO | 45 |
| Particular matter | 10,000 |
| SO2 | 4400 |
| NOX | 1400 |
Considering that the system in question is solar based, based on the geographical location and time zone of GMT+3:30, the graph of average monthly solar radiation and air clearness index for the station under investigation is presented in Figure 6. According to Figure 6, the highest solar radiation and clearest air coefficient are observed in May, with values of 7.28 kWh/m2-day and 0.659, respectively. The lowest solar radiation is observed in December with a value of 3.67 kWh/m2-day, while the lowest air clarity coefficient of 0.554 occurs in January.
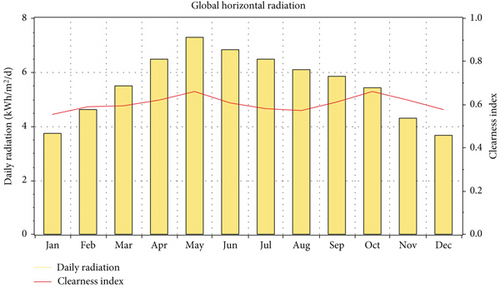
According to the figure, the average daily solar radiation over the year is 5.522 kWh/m2, and the average clearness index is 0.606. The data used for Figure 6 is a 20-year average extracted from NASA’s website. Given that the maximum clearness index is 0.75 [38], it can be stated that the air clearness in the reviewed location is relatively excellent.
The technical and pricing details of the equipment used in this study are presented in Table 3. Additionally, for a better understanding of the systems examined in this work, the schematics of the systems are shown in Figures 7(a) (on-grid) and 7(b) (off-grid). According to the figures, batteries are used to store excess electricity produced in the off-grid system. Since, in the on-grid scenario, excess electricity is sold back to the grid, batteries are not used in the on-grid setup.
| Component | Cost ($) | Specifications | ||
|---|---|---|---|---|
| Capital | Replacement | Operation and maintenance | ||
| PV [39] | 350 | 350 | 10 |
|
| Battery [41] | 174 | 174 | 5 | Type: Trojan T-105, lifetime: 845 kWh |
| Converter [42] | 138 | 138 | 10 |
|
| Diesel generator [43] | 660 | 660 | 0.05 |
|
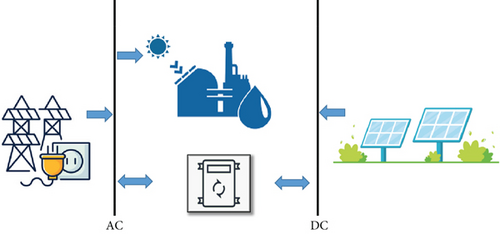
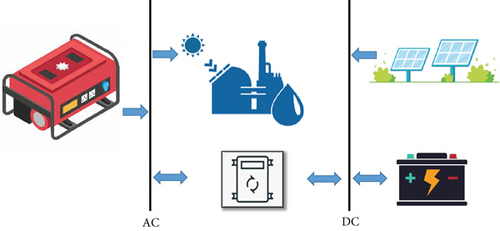
The electrical converter converts AC to DC and vice versa. The goal of evaluating two types of systems is to assess the optimal backup potential among the national grid, diesel generator, and battery. Each scenario is evaluated using 6 and 12-h power supply modes.
In grid-connected systems, excess electricity is sold to the national grid, so there is no need for batteries to store excess electricity. Even if batteries are installed and used in such systems, due to high storage costs, it is not a cost-effective option [44].
5. Results
The results of the different simulated scenarios are presented in Table 4. For the G-6 scenario, it is observed that the total NPC and LCOE are $38,835 and $0.047/kWh, respectively, which are slightly higher than those of the G-12 scenario. According to the results in Table 4, the initial costs of both scenarios are the same, and the difference lies in the operational costs of G-6 and G-12, which are −$3126 and −$3284, respectively. The operational costs result from the electricity sold to and purchased from the national grid. Although the net electricity exchanged in both systems is the same at −102,298 kWh/year, more electricity is purchased from and sold to the grid in the G-12 scenario. Since the selling price of electricity is higher, this benefits the renewable system.
| Scenario | Used equipment | Cost | |||
|---|---|---|---|---|---|
| Initial ($) | Operating ($) | Total NPC ($) | LCOE ($/kWh) | ||
| G-6 | Grid, 120-kW PV, 75-kW converter | 52,350 | −3126 | 38,835 | 0.047 |
| G-12 | Grid, 120-kW PV, 75-kW converter | 52,350 | −3284 | 38,151 | 0.045 |
| offG-6 | 120-kW PV, 35-kW generator, 25 batteries, 50-kW converter | 99,300 | 4988 | 120,865 | 0.261 |
| offG-12 | 120-kW PV, 10-kW generator, 75 batteries, 25-kW converter | 65,100 | 3711 | 81,144 | 0.227 |
Similarly, in the off-grid system, the 12-h electricity supply scenario is economically superior to the 6-h scenario. The LCOE for offG-6 and offG-12 is $0.261 and $0.227, respectively. The optimal offG-6 scenario consists of a 120-kW solar panel, a 35-kW diesel generator, 25 batteries, and a 50-kW inverter. In contrast, the optimal offG-12 scenario includes a 120-kW solar panel, a 10-kW diesel generator, 75 batteries, and a 25-kW inverter. The main difference between these two scenarios is in the initial capital, with offG-12 requiring $34,200 less than offG-6.
In Figure 8, the results of electricity production by various components for the four scenarios under study are presented. The results show that when switching from a 6 to a 12-h electricity supply scenario, there is a greater reliance on backup power. Specifically, for the on-grid scenario, an additional 6245 kWh/year of electricity is needed from the grid, and for the off-grid scenario, an additional 298 kWh/year must be produced by the diesel generator. Given that the capacity of the solar panels is identical in all four scenarios (120 kW), the solar energy produced remains the same at 206,656 kWh/year across all scenarios.
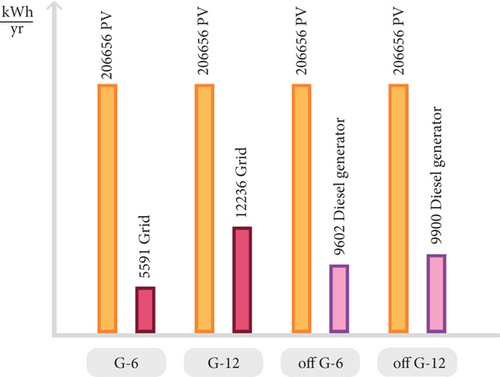
Another observation from Figure 8 is the difference between the 6 and 12-h modes in both grid-connected and off-grid scenarios. It is observed that in the grid-connected scenario, switching from the 6 to the 12-h mode results in a more than 2.1 times reliance on the grid. In contrast, this issue is 1.3 times for the off-grid scenario. In other words, the impact of changing from the 6 to the 12-h mode on the grid-connected system is much greater than on the off-grid system.
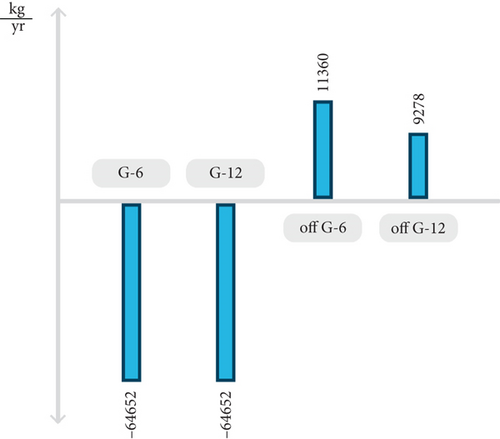
In Figure 9, the simulation results for CO2 emissions across the four scenarios are shown. Since the net electricity sold to the grid (electricity sold minus electricity purchased) in both on-grid scenarios is equal to 102,298 kWh/year, the reduction in emissions is the same for both, preventing approximately 65 tons of CO2 per year. In the offG-6 scenario, due to the additional 57 L/year of diesel consumption compared to offG-12, the emissions are slightly higher in offG-6 than in offG-12.
Based on the results, since the G-12 scenario is the most economically viable, further details of this scenario are explored.
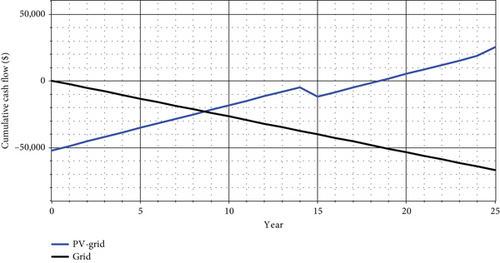
According to Figure 10, the G-12 system is compared with the traditional system (which relies solely on grid electricity). The results show that the payback period for the G-12 system compared to the traditional system is 8.62 years. By the 25th year, the G-12 system is projected to have an economic advantage of approximately $93,000 over the traditional system.
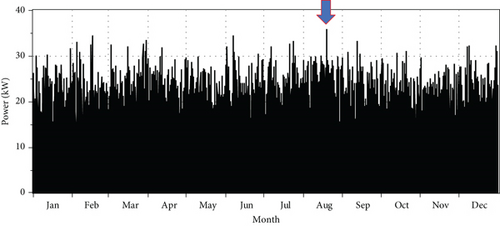
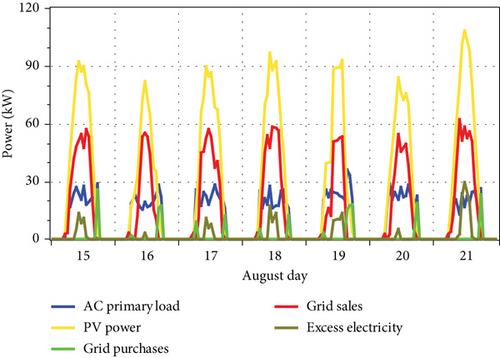
Considering the critical electricity demand during the third week of August (Figure 11(a)), the system’s performance during this week is analyzed (Figure 11(b)). Based on the results in Figure 11(b), it can be observed that solar radiation is quite strong, leading to solar power generation of up to 110 kW on August 21. The required electricity is mainly supplied by solar panels, with the excess energy being sold back to the grid. Electricity is purchased from the grid during periods of lower sunlight intensity. Despite being connected to the grid, there is still some surplus electricity generated, particularly during peak sunlight hours.
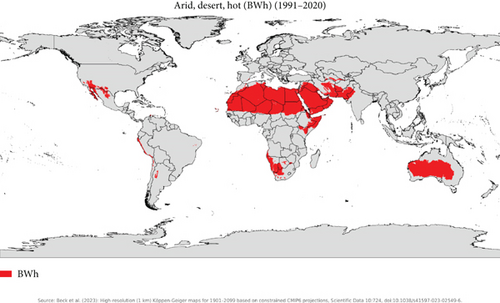
Based on the analyses, the climate of Chabahar is classified as BWh according to the Kӧppen classification, which is a hot desert climate [45]. As shown in Figure 12 [46], a large portion of Australia, Libya, Spain, Chile, Iran, the United Kingdom, Iraq, Algeria, Egypt, Ethiopia, the United States, Qatar, the UAE, Spain, Mexico, Afghanistan, India, Pakistan, Sudan, Kuwait, Peru, Bahrain, Saudi Arabia, Oman, Venezuela, Mali, and South Africa falls under the BWh climate classification.
6. Further Works
- •
Alternative methods for producing drinking water can be explored by utilizing hybrid nanofluids in solar collectors or lithium extracted through renewable energy sources [47, 48].
- •
Instead of solar energy, other renewable energy sources like urban biowaste can be used to produce drinking water [49].
- •
As this study focuses on desalination using RO, it is suggested that other methods also be investigated [30].
7. Conclusion
- •
Scenario G-6: total NPC of $38,835 and LCOE of $0.047
- •
Scenario G-12: offers $158 lower operational costs than G-6, with an LCOE of $0.045, making it the most economically optimal choice
- •
Net electricity exchange: in both on-grid scenarios, it is 102,298 kWh/year
- •
Optimized components of offG-6: 120-kW solar panels, 35-kW diesel generator, 25 batteries, and 50-kW inverter
- •
Optimized components of offG-12: 120-kW solar panels, 10-kW diesel generator, 75 batteries, and 25-kW inverter
- •
Solar electricity generation: in all four scenarios, it is consistent at 206,656 kWh/year
- •
CO2 reduction: both on-grid scenarios result in a reduction of 65 tons/year of CO2
- •
Payback period of G-12: 8.62 years compared to the traditional grid-only system
These results indicate that the G-12 scenario is the most efficient and economical, and it presents a viable solution for ensuring sustainable water supply in Chabahar using solar energy.
Nomenclature
-
- RO
-
- reverse osmosis (-)
-
- G-6
-
- grid-connected mode and 6 h of electricity needed (-)
-
- G-12
-
- grid-connected mode and 12 h of electricity needed (-)
-
- offG-6
-
- off-grid mode and 6 h of electricity needed (-)
-
- offG-12
-
- off-grid mode and 12 h of electricity needed (-)
-
- PHS
-
- pumped hydro storage (-)
-
- NPC
-
- net present cost ($)
-
- LCOE
-
- levelized cost of energy ($/kWh)
-
- HOMER
-
- hybrid optimization of multiple energy resources
-
- Eload served
-
- real electrical load by system (kWh/year)
-
- Pbatt.cmax
-
- maximum power of battery (kWh)
-
- i
-
- annual interest rate (%)
-
- ηgen
-
- electrical efficiency of generator (%)
-
- Pgen
-
- electricity produced by diesel generators (kW)
-
-
- fuel consumption of generator (units/h)
-
- LHVfuel
-
- lower heating value of the fuel (MJ/kg)
-
- A
-
- membrane area (m2)
-
- Qp
-
- permeate flow (m3/day)
-
- Qf
-
- feed flow (m3/day)
-
- SEC
-
- specific energy consumption (kWh/m3)
-
- Cann,total
-
- total annual cost ($)
-
- ηbatt,c
-
- battery charge efficiency (%)
-
- YPV
-
- output power of solar cell under standard conditions (kW)
-
- fPV
-
- derating factor (%)
-
- Pbatt,cmax,kbm
-
- maximum battery charge power base on kinetic battery model (kWh)
-
- N
-
- useful lifetime (year)
-
- Pbatt,cmax,mcc
-
- maximum battery charge power base on maximum charge current (kWh)
-
- PPV
-
- output power of PV cells (kW)
-
- Enet grid purchases
-
- net grid purchases (grid purchases minus grid sales) (kWh)
-
- Pbatt,cmax,mcr
-
- maximum battery charge power base on maximum charge rate (kWh)
-
- Cpower
-
- grid power price ($/kWh)
-
- Csell back
-
- sellback rate ($/kWh)
-
- Cgrid,energy
-
- total annual energy charge (kWh)
-
-
- incident radiation on the cell’s surface on a monthly basis (kW/m2)
-
-
- incident radiation on the cell’s surface under standard conditions (1 kW/m2)
-
- Δπ
-
- osmotic pressure (Pa)
-
- ηp
-
- pump efiiciency (%)
-
- Pp
-
- permeate pressure (Oa)
-
- Pf
-
- feed pressure (Pa)
Disclosure
All aspects of the study, including data collection, analysis, and manuscript preparation, were independently carried out by the authors.
Conflicts of Interest
The authors declare no conflicts of interest.
Funding
This research was conducted without any financial support from external funding agencies, organizations, or sectors.
Open Research
Data Availability Statement
The datasets from this study can be requested from the corresponding author. Requests will be evaluated for ethical compliance to maintain participant confidentiality and adhere to data protection standards, ensuring transparency.


