The Influence of Process Parameters on the Morphology of Laser Wire Additive Manufacturing
Abstract
Laser additive manufacturing (LAM), as direct forming manufacturing technology, can be used to repair, clad, and process components; it is regarded as a revolutionary breakthrough in manufacturing technology. As an important branch of LAM, laser wire additive manufacturing (LWAM) has received extensive attention. However, there is a notable lack of systematic research clarifying the interdependent relationship between the process parameters and the deposited layer morphology of LWAM for 316L stainless steel. In this paper, a complex 6-factor 4-level 316L stainless steel LWAM orthogonal experimental design was conducted with characteristics such as laser oscillation mode, oscillation amplitude, defocusing amount, laser power, scanning speed, and wire feeding speed. Furthermore, the morphological changes of the LWAM deposition layer under different process parameters were analyzed and the interaction effect of process variations on molten pool morphology was investigated by range analysis. Overall, it helps to find a balance between the desired bead shape, surface finish, and molten pool porosity defects to achieve the desired results of the additive demand.
1. Introduction
As an excellent stainless steel with high corrosion resistance, high mechanical strength, and strong weldability, 316L stainless steel has been widely used in the field of nuclear power, biomedical, oil, natural gas, and marine applications in recent years [1]. By using laser beam as the energy source to molten and deposit metal wires to build 3D components, laser wire additive manufacturing (LWAM) has attracted wide attention due to its high forming efficiency, fast cooling rate, good tissue forming, low heat input deformation, pollution-free production process, and high degree of manufacturing flexibility [2]. During the additive process, the selection of LWAM parameters directly affects the geometrical characteristics of the deposited layer morphology, and unsuitable matching of process parameters will lead to defects such as unfused, porosity, cracks, and undercut, which will seriously affect the molding quality of the specimen. Comprehensive understanding of the synergistic effect of complex process parameters on deposition morphology and geometry, optimization of defects, and forming control are important aspects of laser additive manufacturing (LAM) to improve the quality and performance of deposition. Numerous scholars and research teams have conducted a lot of research trying to obtain the best deposition effect of additive samples by optimizing the process parameters in LAM [3–6].
M. Kotar et al. [7] analyzed the influence of process parameters on the geometry of deposited layers and found that as the laser power increased, the molten width increased, molten height decreased and the dilution ratio increased. Caiazzo [8] showed that any increase in the deposited mass led to an increase in width and height, while leading to a decreased in penetration depth and dilution. Ji et al. [9] concluded that the height and dilution of the cladding decreased with the increase of defocusing distance, while the width increased with the increase of defocusing distance. Voropaev et al. [10] showed that a further increase in the oscillation amplitude led to a significant increase in the width of the cladding bead, and that the optimal mode of laser beam oscillation was 1.3 mm in amplitude and 100 Hz in frequency. G. Dai et al. [11] found that laser oscillation can induce significant grain refinement and transition from columnar to equiaxed crystals during the additive process by using oscillation beams. Liu and Long [12] found that a small oscillation amplitude resulted in a high regional temperature and poor forming, while a large oscillation amplitude resulted in the worst spreading wettability and unfavorable stacking of the next layer. Du et al. [13], on the other hand, argued that extremely small height increments would cause the laser to be in negative defocusing, triggering surface defects in thin-walled parts, making it impossible to continue the manufacturing process.
Although many researchers have conducted numerous studies on LAM, there is a significant lack of research specifically on 316L LWAM process parameter optimization methods and systems to clarify the interdependence between process parameters and deposition morphology, and it is still challenging to prepare additive samples that meet the requirements of advanced manufacturing. Facing the numerous process parameters of the LWAM process, a complex 6-factor 4-level LWAM orthogonal experimental design was conducted to analyze the morphological changes of the LWAM deposition layer with characteristics such as laser oscillation mode, oscillation amplitude, defocusing amount, laser power, scanning speed, and wire feeding speed, hoping to provide a reference for further optimizing the forming control of LWAM multifactor coupling.
2. Materials and Methods
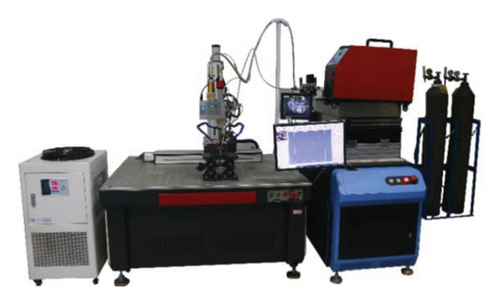
The test equipment is HY-PTBZGQ-1000 fiber LAM system as shown in Figure 1, including MFSC-1000X fiber laser, DI-2000L oscillating laser head, QL-1000 wire feeder, CNC coordinate table, and control system. The maximum power of the laser is 1000 W, the laser wavelength is 1080 nm, the focal length of the oscillating laser head is 200 mm, and the minimum spot area is 0.082 mm2. 40 mm ∗ 40 mm ∗ 8 mm 316L stainless steel plate was selected as the substrate for all experiments, 0.8mm diameter 316L stainless steel wire was used as the wire, and the argon shielding gas flow rate was set to 15L/min. The wire feeder was positioned in front of the laser and the wire feeding angle was 60°, and the spacing between the laser and the welding wire was set at 0.2 mm on the substrate plane.
Firstly, the LWAM sample was treated with stainless steel pickling and passivation paste to eliminate surface oxidation coatings. Subsequently, the topography of the bead surface was documented using a Canon 70D DSLR camera. Following this, specimens deposited in different processes were initially line-cut along cross-sections, and the cutting surfaces were subjected to metallographic mosaic. The specimens were then ground, polished, and etched in 316L special corrosion solution to observe the molten pool. The etchant had a ratio of hydrofluoric acid:hydrochloric acid:nitric acid:water = 1:2:3:4, which allowed for clear observation of the molten pool. Furthermore, metallographic observation of the deposited specimen sections was carried out using an optical microscope (OM), and data extraction from the images was conducted using ImageJ software.
A 6-factor, 4-level orthogonal experiment was designed based on the parameters of the experimental apparatus and the oscillation mode. The laser power (P), scanning speed (Vs), wire feed speed (Vf), defocusing amount (Δf), oscillation mode (M), and oscillation amplitude (A) are the variables, in which the four oscillation patterns of the circular, figure of 8, triangle, and ring were labeled with 1, 2, 3, and 4, respectively. To ensure the accuracy of the experimental data, the deposition experiments of each group were repeated five times, respectively, and the orthogonal experimental design scheme is shown in Table 1.
| No. | P (w) | Vs (mm/s) | Vf (mm/s) | Δf (mm) | M | A (mm) |
|---|---|---|---|---|---|---|
| 1 | 300 | 2 | 6 | −1 | 1 | 0 |
| 2 | 300 | 2 | 7 | 0 | 4 | 0.2 |
| 3 | 300 | 2 | 8 | −1 | 4 | 0.6 |
| 4 | 300 | 2 | 9 | −1 | 2 | 0 |
| 5 | 300 | 3 | 6 | 1 | 1 | 0.6 |
| 6 | 300 | 3 | 9 | 0 | 3 | 0.4 |
| 7 | 300 | 4 | 7 | 1 | 1 | 0 |
| 8 | 300 | 4 | 8 | 2 | 3 | 0 |
| 9 | 300 | 5 | 6 | 2 | 2 | 0.2 |
| 10 | 300 | 5 | 6 | −1 | 1 | 0.4 |
| 11 | 350 | 2 | 6 | −1 | 3 | 0 |
| 12 | 350 | 2 | 7 | 2 | 1 | 0.4 |
| 13 | 350 | 3 | 8 | −1 | 1 | 0.2 |
| 14 | 350 | 4 | 6 | 0 | 2 | 0.6 |
| 15 | 350 | 5 | 9 | 1 | 4 | 0 |
| 16 | 400 | 2 | 6 | 1 | 3 | 0.2 |
| 17 | 400 | 2 | 9 | 2 | 1 | 0.6 |
| 18 | 400 | 3 | 7 | −1 | 2 | 0 |
| 19 | 400 | 4 | 6 | −1 | 4 | 0.4 |
| 20 | 400 | 5 | 8 | 0 | 1 | 0 |
| 21 | 450 | 2 | 6 | 0 | 1 | 0 |
| 22 | 450 | 2 | 8 | 1 | 2 | 0.4 |
| 23 | 450 | 3 | 6 | 2 | 4 | 0 |
| 24 | 450 | 4 | 9 | −1 | 1 | 0.2 |
| 25 | 450 | 5 | 7 | −1 | 3 | 0.6 |
3. Results
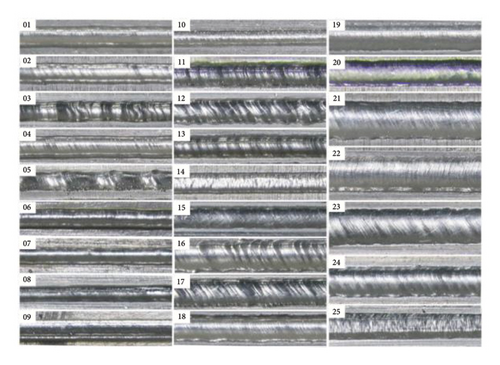
The cross-section of the molten pool in different matching processes is shown in Figure 2, and the LWAM bead geometry for 25 groups of orthogonal experiments is shown in Figure 3.
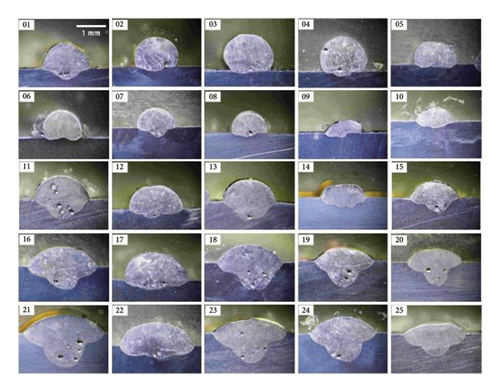
As shown in Figure 2, different matching of process parameters has a greater influence on the molten pool geometry and molten pool porosity defects. Among them, specimen No. 03 and No. 04 have fusion deficiency defects, specimen No. 04, No. 08, No. 11, No. 19, No. 21, and No. 24 have large porosity defects inside the specimen, and specimen No. 09 and No. 18 have molten pool asymmetry defects.
As shown in Figure 3, there was a big difference in the geometry of the deposited layer with different process parameters, and the surface of the deposited layer was characterized by the presence of humps, unsmooth fish scale patterns, and poorly formed defects. The deposited specimens were categorized according to the smoothness of the bead surface, and the surface conditions of different numbered specimens are shown in Table 2.
| Serial no. | Surface condition | Score |
|---|---|---|
| No. 1 | Smooth | Good |
| No. 2 | Fish scale pattern | General |
| No. 3 | Undulate | Poor |
| No. 4 | Smooth | Good |
| No. 5 | Undulate | Poor |
| No. 6 | Smooth | Good |
| No. 7 | Smooth | Good |
| No. 8 | Smooth | Good |
| No. 9 | Smooth | Good |
| No. 10 | Smooth | Good |
| No. 11 | Fish scale pattern | General |
| No. 12 | Undulate | Poor |
| No. 13 | Fish scale pattern | General |
| No. 14 | Fish scale pattern | General |
| No. 15 | Smooth | Good |
| No. 16 | Undulate | Poor |
| No. 17 | Undulate | Poor |
| No. 18 | Smooth | Good |
| No. 19 | Smooth | Good |
| No. 20 | Smooth | Good |
| No. 21 | Smooth | Good |
| No. 22 | Smooth | Good |
| No. 23 | Fish scale pattern | General |
| No. 24 | Smooth | Good |
| No. 25 | Fish scale pattern | General |
As shown in Table 2, for the 25 orthogonal experiments, samples with serial numbers 1, 4, 6, 7, 8, 9, 10, 15, 18, 19, 20, 21, 22, and 24 had relatively smooth surfaces on their sediment layers. Samples with serial numbers 2, 11, 13, 14, 23, and 25 had large and evenly distributed fish scale patterns, while samples 3, 5, 12, 16, and 17 had poor deposition accuracy.
4. Discussion
To specifically analyze the relationship between molten pool defects and process parameters, the measured values of molten height (H), molten width (W), molten depth (D), molten pool area (S), left and right wetting angles (B1 and B2), and the aspect ratio and the dilution rate of the molten pool were used as the dependent variables, and the laser power (P), scanning speed (Vs), wire feed speed (Vf), defocusing amount (Δf), oscillation mode (M), and oscillation amplitude (A) were used as the predictor variables for the range analysis. The R values of the range analysis for each factor are shown in Table 3.
| R (P) | R (Vs) | R (Vf) | R (Δf) | R (M) | R (A) | |
|---|---|---|---|---|---|---|
| H | 0.273 | 0.481 | 0.307 | 0.106 | 0.045 | 0.023 |
| W | 1.25 | 0.349 | 0.172 | 0.095 | 0.138 | 0.143 |
| D | 0.765 | 0.115 | 0.177 | 0.191 | 0.134 | 0.308 |
| B1 | 40.086 | 23.368 | 27.223 | 5.376 | 12.178 | 16.336 |
| B2 | 44.548 | 34.171 | 24.973 | 5.539 | 9.181 | 21.004 |
| S | 1.501 | 1.144 | 0.225 | 0.265 | 0.219 | 0.589 |
| Aspect ratio | 0.127 | 0.17 | 0.107 | 0.143 | 0.084 | 0.146 |
| Dilution rate | 0.434 | 0.137 | 0.134 | 0.122 | 0.047 | 0.095 |
The larger the R value in the results of the range analysis, the more pronounced the effect of influence. Based on the R value of range analysis, the influencing factors of the dependent variable molten height were, in order, scanning speed > wire feeding speed > laser power > defocusing amount > oscillation mode > oscillation amplitude. The influencing factors of molten width were, in order, laser power > scanning speed > wire feeding speed > oscillation amplitude > oscillation mode > defocusing amount. The influencing factors of molten depth were, in order, laser power > oscillation amplitude > defocusing amount > wire feeding speed > oscillation mode > scanning speed. The biggest influence factor of the molten pool area was in the order of laser power > scanning speed > oscillation amplitude > defocusing amount > wire feeding speed > oscillation mode. The weights of the factors influencing the wetting angle were the same as the weights of the molten width, in the order of laser power > scanning speed > wire feed speed > oscillation amplitude > oscillation mode > defocusing amount. The influencing factors of molten pool aspect ratio were, in order, scanning speed > oscillation amplitude > defocusing amount > laser power > wire feeding speed > oscillation mode. The influencing factors of dilution rate were, in order, laser power > scanning speed > wire feeding speed > defocusing amount > oscillation amplitude > oscillation mode.
Based on the results of the range analysis, the main effects of individual process parameters and the dependent variable of the molten pool morphology are plotted as shown in Figure 4.
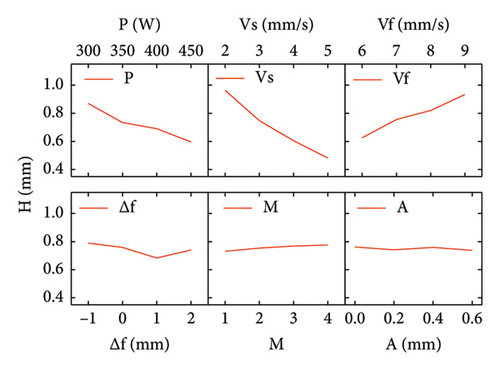
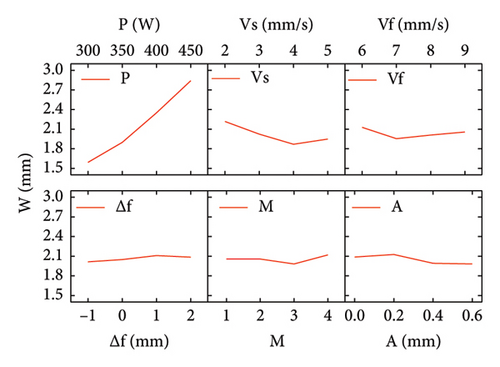
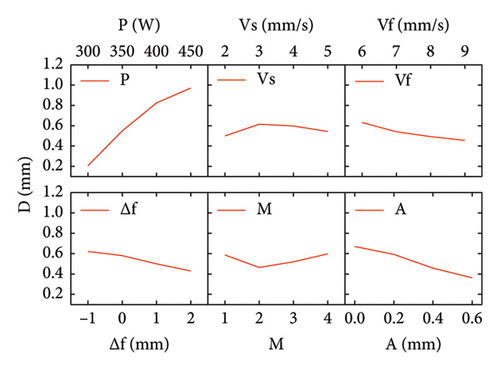
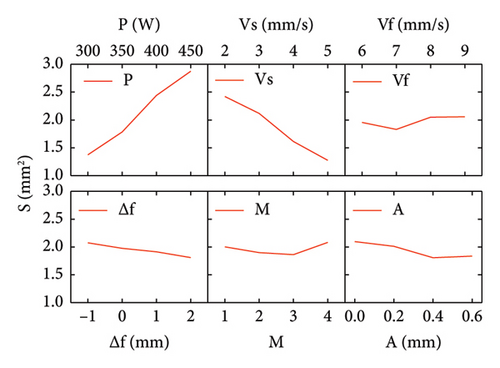
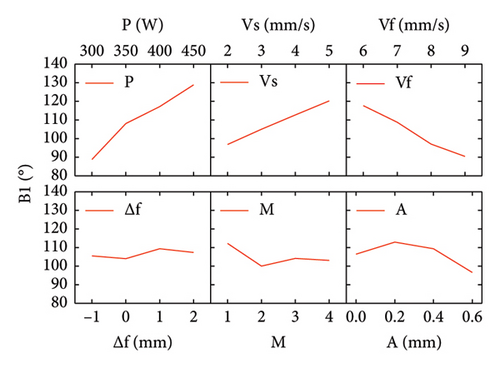

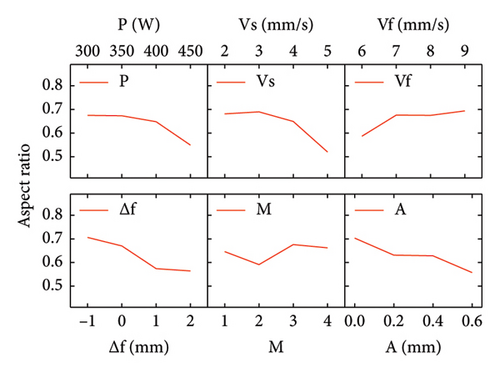
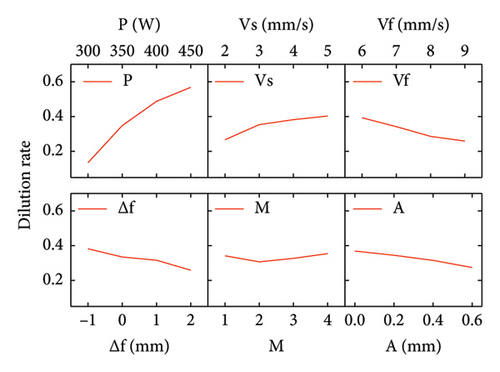
Based on the main effect analysis in Figure 4, it can be seen that there were positive correlations between laser power and molten width, molten depth, wetting angle, molten pool area, and dilution rate and negative correlations with molten height and molten pool aspect ratio. Scanning speed positively affects the wetting angle value and dilution rate and negatively affects the molten height, molten pool area, and molten pool aspect ratio. The wire feed speed positively affects the molten height, molten pool area, and aspect ratio and negatively affects the molten depth, left and right wetting angles, and dilution rate. The amount of defocusing positively affects the molten width and negatively affects the molten depth, molten pool area, molten pool aspect ratio, and dilution rate. An increase in the amount of oscillation positively affects the depth ratio and negatively affects the molten depth, molten pool area, aspect ratio of the molten pool, and dilution rate. The increase of the oscillation amplitude negatively affects the molten depth, the molten pool area, the molten pool aspect ratio, and the dilution rate. The circular oscillation mode helps to obtain the maximum wetting angle and the minimum molten height, while the figure-of-8 oscillation mode helps to obtain the minimum molten depth, the minimum pool aspect ratio, and the minimum dilution rate. The triangular oscillation mode helps to obtain the smallest molten width and the largest molten pool aspect ratio. The ring oscillation mode helps to obtain maximum molten height, molten width, and molten depth, maximum molten pool area, and maximum dilution ratio.
As shown in Figure 4(a), the main factors affecting the size of the molten height were laser power, scanning speed, and wire feeding speed. The ratio of the wire feeding speed to the scanning speed is the wire feed efficiency in a unit length, which determines the cross-section size of the deposited layer, while the melting situation of the deposited layer is determined by the laser power. Too small a laser power results in incomplete melting of the feed material, and as the laser power increased, the molten height size decreased, the molten width increased, and the spreading of the deposited layer became more pronounced.
As shown in Figure 4(b), the largest factor affecting the molten width is the laser power. A low laser power results in a low temperature of the droplet, and after the droplets contact the deposited substrate, the rapid heat transfer from the substrate results in a sudden decrease in the temperature of the molten pool, which is not sufficient to spread out the liquid melting pool. As the power increased, the melting pool temperature increased under thermal accumulation and the surface tension decreased to maximize the molten width.
As shown in Figure 4(c), the largest factor affecting the molten depth is the laser power, followed by the laser oscillation amplitude, the amount of defocusing, and the wire feeding speed. When the laser power is too low, the heat source energy is mainly used to molten the feed wire, so the area of the substrate molten zone is relatively small. Under the action of laser shock and melt evaporation, the liquid molten pool formed small hole. With the increased of laser power, the energy density increased gradually. The higher the energy density of the beam is, the deeper the hole is. An increase in the oscillation amplitude increases the scanning track of the laser spot, decreasing the energy density of the laser beam and thus decreasing the depth of fusion. Increased defocusing leads to an upward shift of the beam focus, which reduces the penetration ability of the laser beam and leads to a decrease in the depth of fusion. Higher wire feeding speeds result in more deposition volume per unit energy density, and excess heat is concentrated in the molting of the wire material, resulting in a reduced depth of fusion.
As shown in Figure 4(d), the biggest factors affecting the molten pool area are laser power and scanning speed. The size of the molten pool area is determined by the heat accumulation, where an increase in laser power contributes to an increase in heat accumulation, while an increase in scanning speed reduces the heat input per unit volume and thus leads to a decrease in the molten pool area. The increase in the defocusing amount leads to a decrease in the depth of the keyhole, which in turn led to a decrease in the Fresnel absorption in the inner wall of the melting pool reducing the heat accumulation in the molten pool.
As shown in Figures 4(e) and 4(f), the change of the wetting angle between the left and right sides is relatively the same, and the larger factors affecting the wetting angle are thus the laser power, scanning speed, and wire feeding speed. The size of the wetting angle is determined by the change in surface tension on both sides of the melting pool. The increase in laser power helped to increase the temperature of the melting pool to reduce the surface tension at the boundary of the melting pool, which spread out the deposited layer to the both sides resulting in a decreased in the wetting angle. The change in scanning speed has the opposite effect to the wire feeding speed, which is due to the difference in wire feeding efficiency, and the reduction of the wire feeding volume under the same power density results in a higher temperature of the melting pool that is easier to spread. An increase in the oscillation amplitude then led to a dispersion of energy in the melting pool, and a decrease in the surface tension at the edge of the pool contributes to a reduction in the size of the wetting angle.
As shown in Figure 4(g), all process factors have a large influence on the variation of aspect ratio. The smaller the ratio, the flatter the overall molten pool profile. The increase in defocusing and oscillation amplitude leads to an increase in the spot irradiation area, and most of the laser heat is concentrated in the upper layers of the molten pool with beam penetration, resulting in a flatter pool profile. The figure-of-8 oscillation mode reduces the transient laser beam energy density due to the largest spot scanning track, resulting in a shallow depth of the molten pool and thus a flat pool profile. The triangular oscillation mode causes the molten pool to be less spread out due to the centralized nature of the spot scanning trajectory.
As shown in Figure 4(h), the largest factor affecting the dilution rate was the laser power. The continuous increase in laser power per unit filament feed rate results in a large amount of heat source energy being transferred to the substrate, increasing the substrate molten pool area and thus the dilution rate. The increase in scanning speed and the decrease in wire feeding rate reduced the deposition efficiency and decreased the absorption of energy in the deposited layer, which in turn increased the dilution rate. An increase in the amount of defocusing caused the laser focus to shift upwards, the depth of the molten pool became shallower, and more energy was distributed above the molten pool, which in turn affected the dilution rate. An increase in the oscillation amplitude also led to a dispersion of the laser energy, reducing the keyhole depth and shifting the energy distribution in the molten pool upwards, which in turn led to a reduction in the dilution rate.
Combined with the analysis of the surface smooth condition of the deposited layer and the cross-section of the molten pool shown in Table 2 and Figure 2, the smoother the deposited specimen surface, the greater the internal pool dilution. Therefore, to obtain a relatively smooth surface of the deposited layer, the heat input should be increased so that the morphology of the deposited layer can be spread out better. At the same time, excessively high laser power leads to more serious porosity defects inside the molten pool. Therefore, to obtain a dense, poreless layer with a small aspect ratio of the molten pool and excellent surface condition of the deposited layer, laser wire deposition should be carried out by using the process parameters of the figure-of-8 oscillation mode with large defocusing amount and large oscillation amplitude, which are capable of homogenizing the laser energy in a wider range.
5. Conclusion
- 1.
The increased of laser power and wire feeding speed positively increased the melt pool area, the increased of wire feeding speed and amplitude positively increased the aspect ratio, and the increased of wire feeding speed positively increased dilution rate.
- 2.
The figure-of-8 oscillation mode is capable of obtaining the minimum molten depth dimension; the triangular oscillation mode is capable of obtaining the minimum molten width; and the ring oscillation mode is capable of obtaining the maximum molten height, molten width, molten depth, molten pool area, aspect ratio, and dilution rate. Maximum wetting angle dimensions and minimum molten height dimensions, aspect ratios, and dilution rates can be obtained in circular oscillation mode.
- 3.
The decrease in the surface smooth condition of the deposited layer showed a consistent trend with the decrease in the dilution rate of the molten pool; thus, in order to obtain a relatively smooth surface of the deposited layer, the heat input should be increased appropriately so that the morphology of the deposited layer is better spread out.
- 4.
The process parameters of the figure-of-8 oscillation mode with large defocusing amount and amplitude is helpful in obtaining a smooth deposition layer with small aspect ratio and poreless.
Conflicts of Interest
The authors declare no conflicts of interest.
Funding
This work was supported by the National Natural Science Foundation of China (51375146), the Ministry of Industry and Information Technology of the People’s Republic of China (2018ZNZX01-02), and the Natural Science Foundation of Henan Province (17A460012).
Open Research
Data Availability Statement
The data that support the findings of this study are available on request from the corresponding author. The data are not publicly available due to privacy or ethical restrictions.


