Differential Impact of Simultaneous or Sequential Coinfections With Borrelia afzelii and Tick-Borne Encephalitis Virus on the Ixodes ricinus Microbiota
Abstract
Ticks, particularly Ixodes ricinus, are significant vectors of pathogens such as Borrelia spp. and tick-borne encephalitis virus (TBEV), which cause Lyme borreliosis (LB) and tick-borne encephalitis (TBE), respectively. Understanding how these pathogens interact within the tick microbiome is essential for developing vector control strategies. This study investigates the impact of Borrelia afzelii and TBEV, as well as their coinfection, on the microbiota composition and structure of I. ricinus nymphs. Using a network-based approach, we analyzed the microbial communities of ticks exposed to infected or coinfected mice. DNA extracted from newly molted nymphs was sequenced for the bacterial 16S rRNA gene, and microbial diversity metrics (alpha and beta diversity) were calculated. Our results showed that TBEV infection increased microbiome diversity compared to the uninfected and Borrelia groups. Co-occurrence network analyses revealed that while microbial structures remained consistent across conditions, TBEV-infected networks exhibited higher robustness to perturbations, indicating a stabilizing effect on the tick microbiome. Furthermore, the hierarchical position and associations of Borrelia varied significantly depending on the infection scenario, highlighting its adaptive role within the tick microbiota. The study demonstrates that pathogen presence alters tick microbial dynamics, with TBEV enhancing stability, suggesting virus-mediated modifications of the microbiome. These findings advance our understanding of pathogen–tick–microbiome interactions and provide insights into the ecological mechanisms underlying pathogen coexistence within ticks. This research underscores the importance of microbial networks in ticks and offers new perspectives for targeted approaches in managing tick-borne diseases.
1. Introduction
Ticks are blood-sucking arthropods globally recognized as vectors of numerous pathogens affecting humans, domestic animals, and wildlife [1]. These ectoparasites belong to the class Arachnida and superorder Parasitiformes, with over 900 species divided into two main families: Ixodidae (hard ticks) and Argasidae (soft ticks) [2]. Among the around 700 hard tick species, Ixodes ricinus is notably abundant and the most common tick species in Europe [3], infesting birds, mammals, and occasionally reptiles [4, 5]. This tick exhibits a biphasic, seasonal activity pattern [6] and undergoes three blood feeding stages: larva, nymph, and adult. Each stage takes a single blood meal before molting to the next stage, or, in the case of an adult female, laying eggs. Adult males feed occasionally in small amounts [7, 8].
Lyme borreliosis (LB) is the most common vector-borne disease in the Northern Hemisphere [9]. Hard ticks of the genus Ixodes are the main vectors of Lyme pathogens and can also transmit Borrelia miyamotoi, the causative agent of relapsing fever (RF) borreliosis [10]. LB is a multisystemic inflammatory disease caused by spirochetes of Borrelia burgdorferi sensu lato (s.l.) complex, which includes at least 18 species [11]. In Europe, eight species from this complex have been reported: Borrelia afzelii, Borrelia garinii, B. burgdorferi sensu stricto (s.s.), Borrelia valaisiana, Borrelia lusitaniae, Borrelia spielmanii, Borrelia bavariensis, and Borrelia bissettii. Depending on the geographical location, the most common genospecies in I. ricinus are B. afzelii and B. garinii [11, 12]. Different animal groups vary in suitability as hosts for different life stages of I. ricinus [13, 14] and as reservoirs for different Borrelia species [15, 16]. For instance, in Europe, B. afzelii is associated with small mammals such as mice (Apodemus species) and the bank vole (Myodes glareolus), while B. garinii is associated with birds [17–19]. Previous studies have shown that B. afzelii establishes chronic infections in its rodent hosts that can last for months or even years [20]. Borrelia spirochetes are typically acquired by larval or nymphal ticks feeding on an infected vertebrate host [19]. Once ingested, the spirochetes colonize the tick’s gut. During the tick’s next blood meal, Borrelia migrates from the gut to the salivary glands and is transmitted to a new host via tick saliva by nymphs or adults [17, 21].
I. ricinus ticks, known carriers of various pathogens, also harbor viruses that cause significant medical and veterinary conditions [22]. One prominent pathogen among these is the tick-borne encephalitis virus (TBEV), Orthoflavivirus encephalitidis, which causes the zoonotic disease tick-borne encephalitis (TBE). This virus belongs to the tick-borne flavivirus group within the family Flaviviridae, genus Orthoflavivirus [23]. TBEV is the most important tick-transmitted arbovirus affecting humans in Europe and Asia, primarily transmitted by I. ricinus and Ixodes persulcatus [24]. In Western Europe, I. ricinus serves as the principal vector for TBEV [25]. Larvae of this tick species are typically uninfected due to the rarity of transovarial (vertical) transmission of TBEV [26, 27]. Instead, larvae or nymphs acquire the virus during a blood meal and maintain the pathogen after molting into the nymphal or adult stages through transstadial transmission. Once infected, ticks carry the virus for their entire life cycle [28].
Tick microbiota includes mutualist symbionts, commensal microorganisms, and pathogens affecting humans and animals [29, 30]. Ticks can acquire multiple pathogens through a single blood meal from a coinfected host or by feeding on different infected hosts during their sequential life stages [31–34]. When tick larvae and nymphs feed on an infected small mammalian host, they can ingest one or more pathogens, which may be transmitted during subsequent blood meals. The mechanisms underlying these coinfection patterns remain unclear, whether due to similar environmental preferences of pathogens, parallel acquisition from host communities, or direct microbe–microbe interactions within ticks [29]. Additional studies in North America have reported coexisting tick-borne pathogens among mammalian hosts. For example, in southern Connecticut, studies found that up to 50% of white-footed mice (Peromyscus leucopus) exhibited concurrent infection with B. burgdorferi s.s., Babesia microti, and Anaplasma phagocytophilum, highlighting the prevalence of coinfections in these reservoir hosts [35, 36]. Pathogenic bacteria transmitted by Ixodes ticks, such as Rickettsia helvetica and B. burgdorferi s.s., have been shown to modulate the tick microbiota, potentially facilitating their colonization and persistence [37, 38]. Mechanistically, colonization of Ixodes scapularis by B. burgdorferi s.s. induces the expression of a tick-secreted gut protein, PIXR, which suppresses biofilm formation by the gut microbiota. This reshaping of the gut environment promotes bacterial persistence in the tick midgut [38]. Not only do coinfections present diagnostic challenges, but also they can involve synergistic, antagonistic, or neutral interactions among pathogens within their hosts, thereby modulating disease severity [39–41]. Moreover, microbial interactions within the tick can influence pathogen establishment, persistence, and potential coexistence by shaping competitive or facilitative dynamics in the shared ecological niche [40, 41]. However, it remains largely unknown how coinfections influence the structure and function of the tick microbiota.
In this study, we examined how infection of I. ricinus larvae with B. afzelii, TBEV, or both pathogens influences the microbial community structure of the resulting nymphs. Larvae acquired these pathogens by feeding on C3H/HeN (C3H) mice that had been experimentally infected or coinfected in the study by Porcelli et al. [42]. We used newly molted nymphs derived from that experiment to investigate microbiome responses to distinct pathogen exposure scenarios. A network-based analytical framework was applied to assess structural and compositional changes in the tick microbiome. In order to evaluate the influence of these pathogen infections on the ‘core bacterial microbiota’ and network properties, we performed an in silico removal of nodes from the networks, simulating the reshaping of bacterial community assembly in I. ricinus nymphs. This work underscores the ecological complexity of pathogen–microbiota interactions in ticks and provides insights relevant to vector competence and pathogen transmission control strategies.
2. Materials and Methods
2.1. Experimental Design
To investigate the effects of single and coinfections with B. afzelii and TBEV on the microbiota of I. ricinus nymphs, we analyzed newly molted nymphs derived from larvae that had fed on infected or coinfected C3H mice in the experimental study conducted by Porcelli et al. [42].
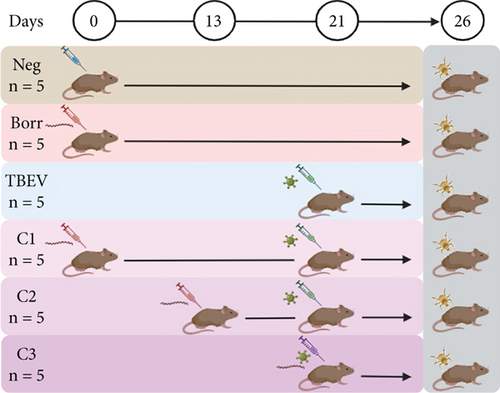
Previously, six-week-old female C3H mice (Charles River Laboratories, France) were allocated into six experimental groups in the study by Porcelli et al. [42]. A negative control group (Neg group, n = 5) received Dulbecco’s modified Eagle medium (DMEM) on Day (d) 0. Two single infection groups were also established: the Borr group (n = 5) was inoculated with B. afzelii on d0, while the TBEV group (n = 5) was inoculated with TBEV on d21 [42]. Three coinfection groups were set up as follows: B. afzelii was inoculated on d0 for the C1 group (n = 5), on d13 for the C2 group (n = 5), and on d21 for the C3 group (n = 5), followed by a TBEV inoculation on d21 for all coinfection groups (Figure 1; [42]). Mice were inoculated with 1 × 10⁶ spirochetes of B. afzelii CB43 strain in BSK-M medium, administered both subcutaneously (100 μL) and intraperitoneally (150 μL). For TBEV infection, the Hypr strain was delivered subcutaneously in a 100-μL suspension containing 1 × 10² plaque-forming units (PFU) per mouse. On d26, I. ricinus larvae were allowed to feed on the mice (two mice from each of the six groups). The larvae were obtained from a colony of the institute of Zoology, Slovak Academic of Sciences, Bratislava Slovakia. Upon engorgement, fully engorged larvae dropped and a batch of larvae from each experimental group were stored in an incubator at 22°C with 95% relative humidity and a 12-h light/dark cycle until molting. Following, 5–10 nymphs from each group were stored at −80°C in a freezer until further use [42]. To measure the presence of the pathogens in nymphs, a reverse transcription-preamplification-digital PCR was used to detect B. afzelii and TBEV RNA [42]. For our analysis, DNA samples were obtained from the newly molted I. ricinus nymphs that had fed as larvae on C3H mice in the previous study [42].
2.2. DNA Extraction and Reagent Controls
Genomic DNA (gDNA) was extracted from newly molted I. ricinus nymphs, which had previously fed as larvae on C3H mice [42]. Prior to DNA extraction, each tick was individually homogenized using the Fast Prep-24 5G homogenizer (MP Biomedicals, Irvine, CA, United States) with six stainless steel beads, in 200 μL of DMEM supplemented with 10% fetal bovine serum (FBS). The homogenization process consisted of two cycles at 5500 rpm for 20 s each; then, samples were centrifuged at 1500 × g for 5 min. DNA was extracted from the supernatant using the NucleoSpin Tissue DNA Extraction Kit (Macherey-Nagel, Hoerdt, France), eluted in 30 μL of DNase-free water, and stored at −80°C for future use. The concentration and quality of the extracted gDNA were determined using the NanoDrop One spectrophotometer (Thermo Scientific, Waltham, MA, United States), targeting an OD260/OD280 ratio between 1.8 and 2.0. Four reagent controls were also processed following the same procedures to monitor for any potential contamination, with these controls subjected to identical DNA amplification steps as the experimental samples.
2.3. 16S rRNA Sequencing and Processing of Raw Sequences
Genomic DNA extracted from nymphs (≥200 ng total, ≥20 ng/μL) was sent for bacterial 16S rRNA gene amplicon sequencing, which was commissioned to Novogene Bioinformatics Technology Co. (London, United Kingdom). A single lane of the Illumina MiSeq system was used to generate 251-base paired-end reads from the V4 variable region of the 16S rRNA gene using bar-coded universal primers (515F/806R) in Neg (n = 12), Borr (n = 11), TBEV (n = 12), C1 (n = 12), C2 (n = 12), and C3 (n = 12) as well as extraction reagent controls (n = 4). The 16S rRNA sequences were analyzed using the Quantitative Insights Into Microbial Ecology 2 (QIIME2) pipeline (v.2022.8) [43]. The demultiplexed raw sequences (obtained in FASTQ files) were denoised, quality trimmed, and merged using DADA2 software [44] implemented in QIIME2 [43]. The reads were then merged, chimeric variants were removed, and taxonomically assigned using a pretrained naïve Bayes taxonomic classifier [45] based on the SILVA database (V. 138) [46]. The resulting taxonomic table was collapsed at the genus level and filtered by removing taxa with less than 10 reads and present in less than 30% of samples. The raw 16S rRNA sequences obtained from tick samples were deposited at the SRA repository (Bioproject No. PRJNA1123907).
2.4. Diversity Indexes and Taxa Abundance
We measured alpha diversity to characterize the microbial community within individual samples. Our alpha diversity analysis included metrics for evenness (species representation), phylogenetic diversity, and richness (number of taxa) [47]. The metrics were estimated using the q2-diversity plugin in QIIME2 environment. The alpha diversity evenness was explored using the Pielou’s evenness index [48], the phylogenetic diversity (PD) with Faith’s PD [49], and the richness with observed features [50]. Differences in the alpha diversity metric between groups were assessed using the pairwise Kruskal–Wallis test (p < 0.05) with QIIME2 and visualized using GraphPad Prism Version 9.0.2 (GraphPad Software, San Diego, California United States).
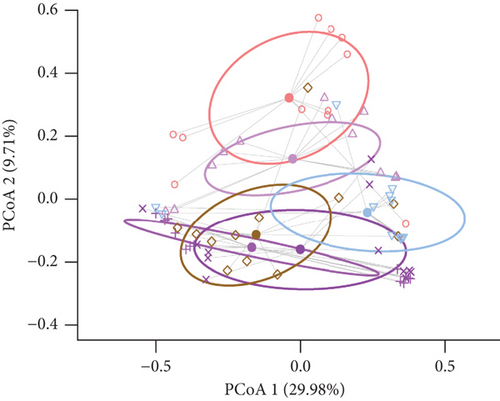
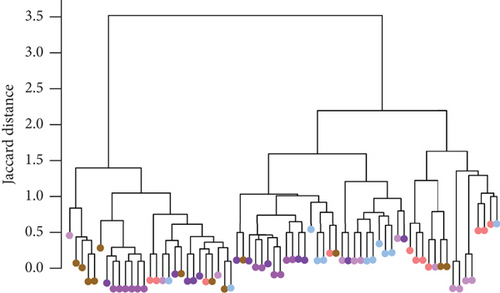
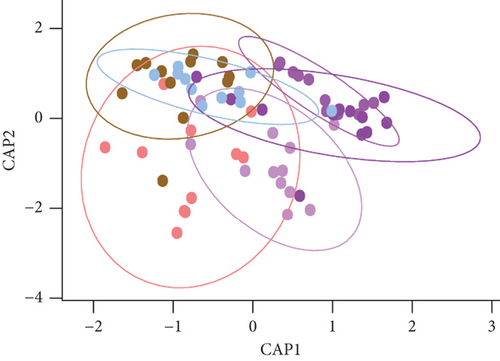
Beta diversity is a measure of diversity between conditions that assesses the similarity of microbial communities. Bacterial beta diversity was assessed using the Bray–Curtis dissimilarity index [51] and visualized in a principal coordinate analysis (PCoA) graph, with the Jaccard distance [52] test, and with the correspondence analysis of principal coordinates (CAP) [53] test. Bray–Curtis and Jaccard distance tests were analyzed with q2-diversity plugin in QIIME2 environment and compared between groups using the PERMANOVA test (p < 0.05). The CAP test was analyzed using the ‘Vegan’ package [54], in RStudio [55], and a PERMANOVA test was conducted with the ‘Adonis’ function [56]. Bray–Curtis, CAP, and Jaccard distance tests were visualized with ‘Vegan’ package [54] implemented in RStudio [55]. Additionally, beta dispersion, a measure of sample variability within a condition, was calculated and analyzed using ANOVA (p < 0.05) with the ‘Vegan’ package in RStudio [55].
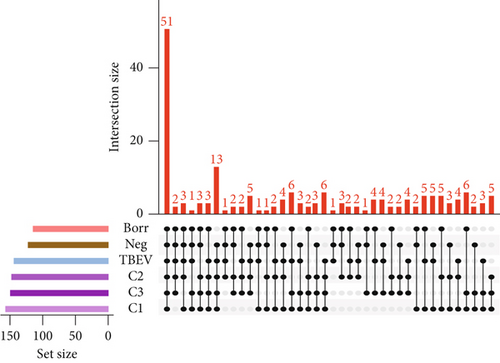
The difference of taxa composition was assessed with an UpSet graph to visualize which taxa are common between the different conditions. This graph was constructed with the ‘UpSetR’ package [57] in RStudio [55]. The taxa abundance differences were assessed to measure statistically different bacterial abundance between the groups. The abundance of taxa was transformed to centered log ratio (clr) value, with ALDEx2 package [58] implemented in RStudio [55]. The statistically different taxa (Kruskal–Wallis test, p < 0.05) were used for representation of the taxa differential abundance. The resulting data were used to construct the heatmap with the ‘heatmap.2’ function from gplots package [59] implemented in RStudio environment [55].
2.5. Bacterial Co-Occurrence Network Construction
Microbial structure and organization were analyzed by co-occurrence network analysis. The networks allow the graphic visualization of the microbial community assemblies. Bacterial taxa are represented by nodes and the significant correlations between taxa are represented by edges. Analyses of significant positive (weight > 0.5) or negative (weight < −0.5) correlations were performed using the SparCC method [60] implemented in RStudio environment [55]. For this analysis, network interactions were calculated with a bootstrap of 1000 and interactions above the threshold of 0.05 were removed. The visualization of the networks was performed using the software Gephi 0.10 [61]. Network topological features were calculated: number of connected nodes and edges (positive and negative), modularity (the strength of the division of a network into modules), number of modules, network diameter (the shortest path between the two most separated nodes), average shortest path, average degree (the average number of links per nodes), weighted degree (the sum of the weight of all the edges connected to a node), and clustering coefficient (the degree to which nodes in a network tend to form clusters).
2.6. Robustness Analysis
The robustness of the microbial networks to perturbation (infection or coinfection) in each experimental group was evaluated using two techniques: loss of connectivity in response to node removal and network resilience to node addition. For node removal analysis, nodes were removed in four ways: high betweenness centrality (frequency with which a node is situated on the shortest path between pairs of other nodes), cascading (high betweenness centrality recalculated when each node is removed), high degree (number of edges that a node has with other nodes), and random removal. The loss of connectivity (IC 95%) was calculated depending on the node removal rate and compared between the conditions. This was performed using Network Strengths and Weaknesses Analysis (NetSwan) script [62] in RStudio [55].
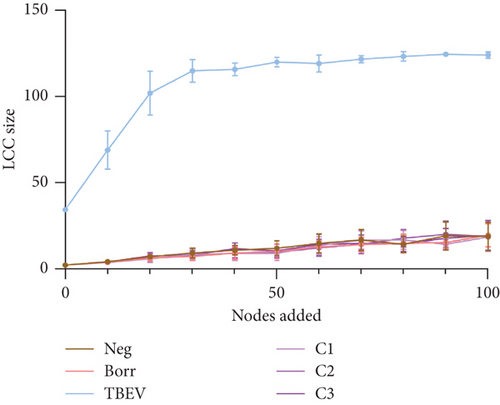
The node addition consists of new nodes randomly selected and connected to the existing network. To this end, we determined the size of the largest connected component (LCC) (largest subset of nodes that are mutually reachable through edges) and the average path length (APL) (average number of steps needed to travel between any two nodes in the network). The LCC and APL are then calculated every 10 nodes added, from 10 to 100. The simulation was repeated 10 times for more strength of analysis. This analysis was described by Freitas et al. [63] and performed with RStudio [55]. The obtained values were plotted using GraphPad Prism 9.0.2 (GraphPad Software, Boston, Massachusetts United States) to visualize the results.
2.7. Network Comparison
To compare the networks’ most central nodes, the Jaccard index was calculated for degree, betweenness centrality, closeness centrality, eigenvector centrality, and hub taxa. The Jaccard index tests the similarity between sets of “most central nodes” of networks, which are defined as those nodes with a centrality value above the empirical 75% quartile. Thus, this index expresses the similarity of the sets of most central nodes as well as the sets of hub taxa between the two networks. Jaccard index ranges from 0 (completely different sets) to 1 (sets equal). The two p values p(J ≤ j) and p(J ≥ j) for each Jaccard’s index are the probability that the observed value of Jaccard’s index is ‘less than or equal’ or ‘higher than or equal,’ respectively, to the Jaccard value expected at random which is calculated taking into account the present total number of taxa in both sets [64]. In addition, the top 10 nodes with the highest degree, eigenvector centrality, and betweenness centrality were compared between conditions using Gephi v.0.10 [61]. The Adjusted Rand Index (ARI) was also calculated to test the dissimilarity of clustering in the networks. ARI values range from −1 to 1. Negative and positive ARI values mean lower and higher than random clustering, respectively. An ARI value of 1 corresponds to identical clustering, and 0 to dissimilar clustering. The p value tests if the calculated value is significantly different from zero [65]. Jaccard index and ARI were calculated between all pair of conditions (Neg-Borr, Neg-TBEV, Neg-C1, Neg-C2, Neg-C3, Borr-TBEV, Borr-C1, Borr-C2, Borr-C3, TBEV-C1, TBEV-C2, TBEV-C3, C1-C2, C1-C3, and C2-C3) with ‘Netcomi’ package [65] implemented in RStudio [55]. A second network comparison was conducted with the core-associated network (CAN) analysis, which analyzes sets of nodes that are similarly connected between different networks [66]. The analysis was performed between all pairs of conditions with the anuran toolbox implemented in Python environment (https://github.com/ramellose/anuran).
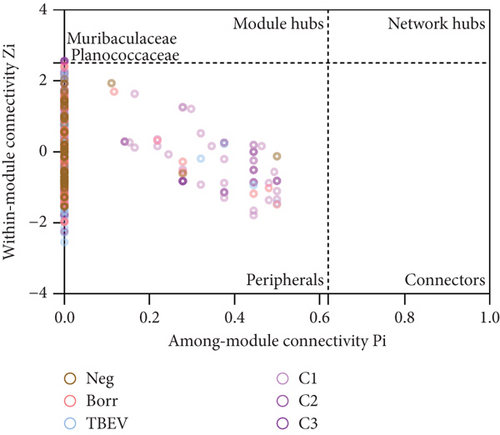
The topology of the taxa in the networks was analyzed using a Pi–Zi test. This test calculates the within-module (Zi) and the among-module (Pi) connectivity of nodes in a network. It ranges nodes in four categories: (i) peripheral taxa (Zi ≤ 2.5 and Pi ≤ 0.62), which contain taxa with few edges in and out of their module; (ii) connectors (Zi ≤ 2.5 and Pi > 0.62), which contain taxa connected to other modules than their own; (iii) module hubs (Zi > 2.5 and Pi ≤ 0.62), which contain taxa highly connected with members of their own module; and (iv) network hubs (Zi > 2.5 and Pi > 0.62), which contain taxa highly connected with members within and among their module. For each taxon, Zi and Pi values were calculated using only positive edges, with the R script “code-zi-pi-plot” described by [67, 68] in RStudio [54], and visualized with GraphPad Prism Version 9.0.2 (GraphPad Software, Boston, Massachusetts United States).
2.8. Borreliella Hierarchical Position in the Microbiota
The position of the Borreliella genus (including B. afzelii) within the tick microbiota was evaluated to assess whether its presence, along with TBEV, influences its interactions and hierarchical position. To compare its position across conditions, the Borreliella node was analyzed within the co-occurrence network and its module. The hierarchical position of Borreliella node was further evaluated by analyzing its direct neighbors and calculating centrality measures (degree, betweenness centrality, clustering coefficient, and eigenvector centrality). These analyses were conducted using Gephi 0.10 [61].
3. Results
3.1. Raw Sequence Quality and Abundance of Taxa Per Reads
After the filtering, denoising, merging, and chimeric removal, our analyzed reads per sample ranged from 29,016 reads, representing 44.53% of the raw number of reads, to 273,783 reads, representing 83.18% of the raw number of reads (Ave ± = 75,187.1 ± 49,154.12 reads representing 78.89 ± 7.90% of the raw number of reads; Table S1). A total of 204 taxa were identified with the number of reads ranging from 12 (Ave ± = 0.17 ± 1) for Solirubrobacter to 916,448 (Ave ± 13,092.11 ± 17,170.22) for Candidatus Midichloria (Table S1).
3.2. TBEV Presence Increases Microbial Alpha Diversity
To examine how infection with B. afzelii alone, TBEV alone, or coinfection with both pathogens affects I. ricinus microbiome, we sequenced the 16S rRNA gene from genomic DNA of newly molted nymphs. These nymphs had previously fed as larvae on either uninfected mice or mice infected with B. afzelii, TBEV, or both pathogens [42]. After sequencing, the four extractions reagent controls did not contain microbial sequences and did not meet the threshold for 16S rRNA amplicon sequencing, confirming that these samples were free from contamination.
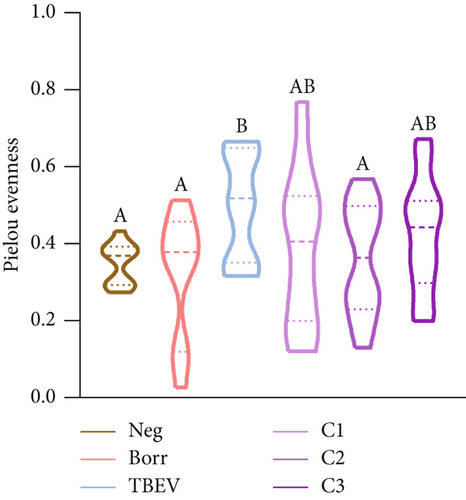
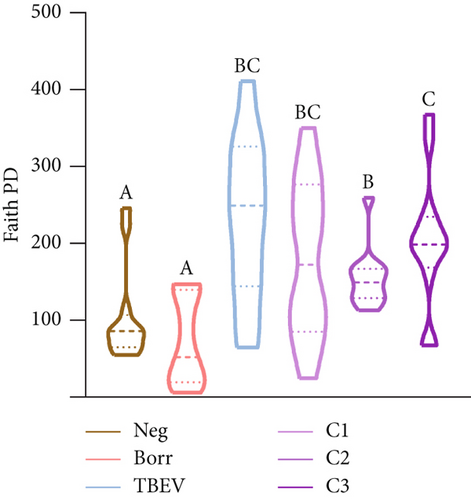
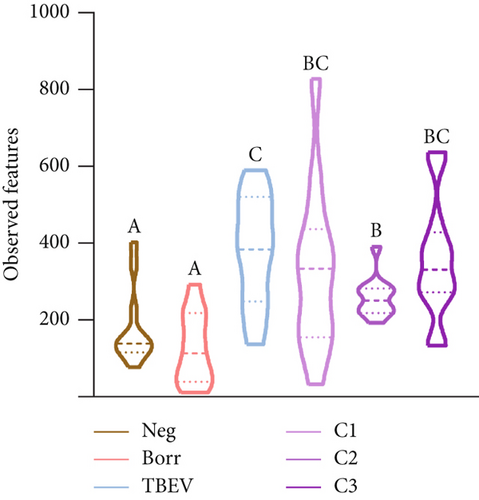
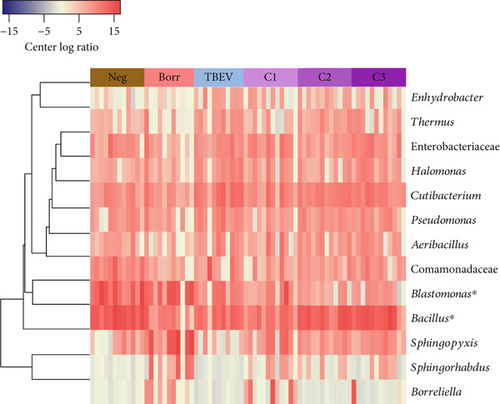
The alpha diversity metrics (Pielou’s evenness, Faith’s PD, and observed features) demonstrated similar results (Figures 2a, 2b, and 2c), with a significantly less rich and even microbiota for Borr and Neg compared to the TBEV group (pairwise Kruskal–Wallis, p < 0.05). Beta diversity metrics demonstrated significant differences between all the conditions except C1 versus C3 and C2 versus C3 for Bray–Curtis test and C2 versus C3 and C3 versus TBEV for Jaccard distance (PERMANOVA, p < 0.05; Table S2; Figure 2d,e). These results suggests that the time of injection of B. afzelii in mice may significantly impact the diversity of microbial communities in I. ricinus nymphs. The CAP test demonstrated significant differences between the different conditions (PERMANOVA, p < 0.001; Figure 2f). In the comparison of the microbial composition, the six conditions shared 51 of 179 taxa (28% of common taxa, Figure 2g) and 13 of 179 taxa (7%) were shared between all the groups except Borr (Figure 2g). The differential abundance test measured 13 taxa with different clr values between the groups (Kruskal–Wallis, p < 0.05, Figure 2h), including Borreliella that was more abundant in the Borr and C1 groups.
3.3. TBEV Presence Increases Network Robustness
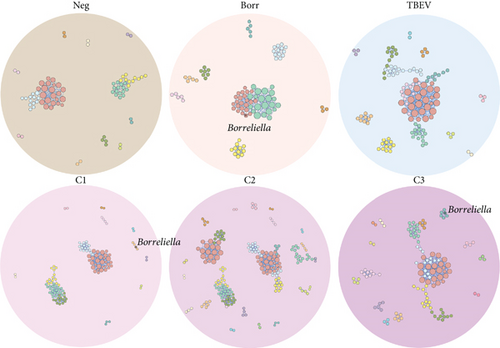
In this study, we also explored the influence of TBEV and B. afzelii infections, as well as their coinfection, on the microbial community assembly of I. ricinus nymphs. To this end, we built the bacterial co-occurrence networks and tested their resilience to perturbations, such as addition and removal of nodes.
Visually, the microbial networks presented similarities, with the number of connected nodes ranging from 81 (Neg) to 128 (C3) and edges varying from 179 (Neg) to 405 (TBEV), essentially positives (Table S3; Figure 3). It is noteworthy that all networks exhibited positive correlations between central modules and peripheral modules, with the latter comprising fewer than 10 bacterial taxa. This observation suggests that the infection or coinfection did not significantly alter the association of taxa within the microbial community. Additionally, networks exhibited a similar modularity value (Ave = 0.71 ± 0.05) and a number of communities proportional to the networks size (Table S3; Figure 3).
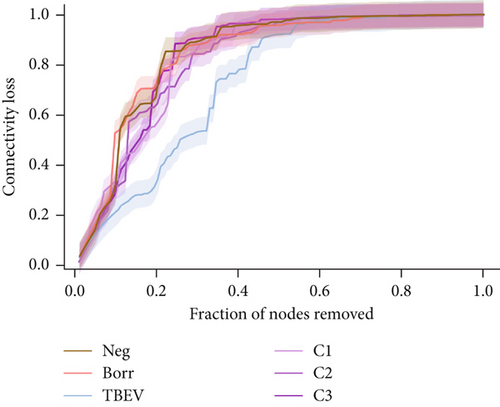
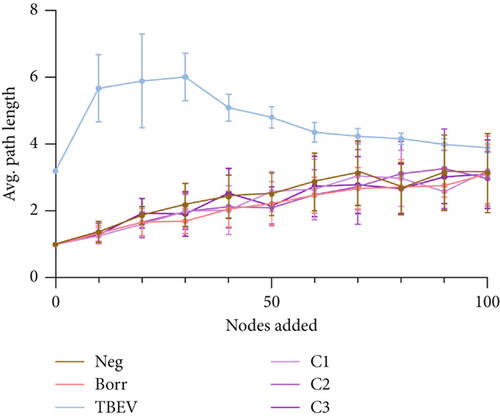
The robustness tests demonstrated a clear shift between the TBEV group and the rest of the conditions. The node removal revealed that TBEV was more robust to degree attack (Figure 4a) and to betweenness (Figure S1), notably. Regarding the node addition metrics, the TBEV group exhibited a higher LCC than the other groups when 0 and 30 nodes were added. Subsequently, its LCC values decreased to similar levels to those of the other groups (Figure 4b). These findings indicate that the TBEV network is more resilient to disruptions than the other groups. However, the APL was higher for the TBEV group compared with the other conditions indicating inefficiencies in the communication between the nodes.
3.4. Microbial Networks’ Hierarchical Composition Varies Depending on Pathogen Coinfection
Next, a comparison was conducted between the networks based on the terms of the distribution of local centrality measures and clustering. The comparison of the most central nodes with the Jaccard index demonstrated that the central nodes exhibited the greatest similarity between C1-C2 for degree (Jacc = 0.32), C1-C3 for betweenness centrality (Jacc = 0.38), Borr-C2 and C1-C2 for closeness centrality (Jacc = 0.34), and C2-Neg for eigenvector centrality (Jacc = 0.36) and for hub taxa (Jacc = 0.36; Table S4). Overall, none of the tested pairs were statistically equal to or more similar than random (p < Jacc; Table S4). The 10 top nodes of degree, eigenvector centrality, and betweenness centrality were compared, and the C1 and C2 groups have only Dongia as a common top node for degree and eigenvector centrality (Table S5). The C3 and TBEV groups had two common top nodes, Pedomicrobium and Alloprevotella, for degree and eigenvector centrality (Table S5). For the top betweenness centrality nodes, Morganella taxa were common between the Borr, C1, C2, and Neg groups demonstrating its importance in the network when TBEV is less present. Simultaneously, Pseudoxanthomonas appeared among the top nodes in the C3, Neg, and TBEV groups, highlighting its significance in the network when Borreliella is less present (Table S5).
The most dissimilar central nodes were between C3-Neg for degree (Jacc = 0.13, p (<Jacc) = 0), Borr-TBEV and C1-TBEV for betweenness centrality (Jacc = 0.23, p (<Jacc) < 0.05), C3-Neg for closeness centrality (Jacc = 0.17, p (<Jacc) = 0), eigenvector centrality (Jacc = 0.11, p (<Jacc) = 0), and for hub taxa (Jacc = 0.11, p (<Jacc) = 0; Table S4). Overall, at least one of the five centrality measures tested was statistically equal to or more different than random (p > Jacc) for Borr-C3, Borr-TBEV, C1-C3, C1-Neg, C1-TBEV, C2-C3, C2-TBEV, C3-Neg, and Neg-TBEV (Table S4). In those group comparisons, Borr-C3 and C1-C3 did not share any taxa among the top central nodes for degree, eigenvector centrality, and betweenness centrality (Table S5). Additionally, the ARI values ranged from 0.05 for C2-C3 and C1-TBEV (p < 0.05) to 0.25 for Borr-Neg (p = 0). The results of the Jaccard index and ARI demonstrated that the microbial networks did not exhibit similarities in the most central nodes or in the clustering, indicating a shift in the hierarchical organization caused by the pathogen infection or coinfection. Moreover, the CAN analysis demonstrated the greatest similarity between C1 and C2 (21 nodes and 14 edges), and the least similarity between Borr and TBEV (6 nodes and 5 edges; Figure S2).
For the analysis of the taxa topology, all taxa were categorized into the peripheral group, except for Planococcaceae and Muribaculaceae in the C3 network, which were included in the module hub group (Figure 5). This could suggest a relevant role of these taxa within the C3 group microbiome.
3.5. Borreliella Hierarchical Position Varies Between Conditions
The position of the Borreliella taxon varied between the conditions (Figure 3). Borreliella node was absent in the Neg, TBEV, and C2 groups, but was in a major module in Borr network, along with 21 other taxa (Figure 3). Moreover, Borreliella taxon was in a peripheral module in C1 (with three other members) and C3 groups (with five other members). None of the module members of Borreliella were common between the conditions, demonstrating dissimilar role, or niche in the tick’s microbiota (Table S6).
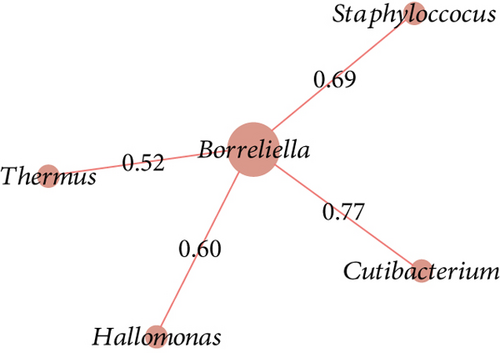
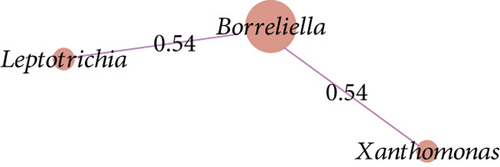
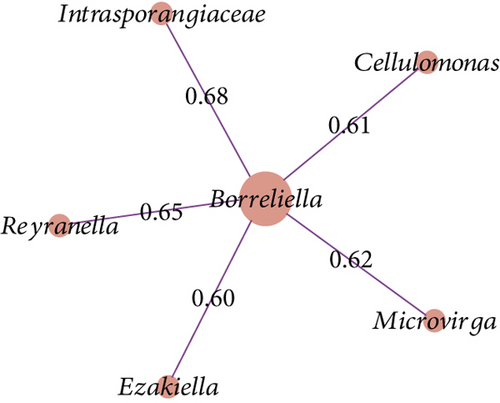
The co-occurrence networks revealed that all direct neighbors of Borreliella were all positive co-occurrence interactions for Borr (Thermus, Cutibacterium, Halomonas, and Staphylococcus, Figure 6a), C1 (Leptotrichia and Xanthomonas; Figure 6b), and C3 groups (Intrasporangiaceae, Cellulomonas, Microvirga, Ezakiella, and Reyranella; Figure 6c). Borreliella taxon was the most central node in the Borr group compared with the other conditions, with the highest eigenvector centrality value (n = 0.13; Table S7); it was also well connected with five microbial taxa in C3 (n = 5; Table S7).
4. Discussion
Recent surveys have reported a higher prevalence of coinfections, with approximately 50% or more of ticks harboring up to five different pathogens [69–73]. LB and TBE are caused by infections with B. burgdorferi s.l. and TBEV, respectively. In Europe, both pathogens are transmitted to humans through the bite of I. ricinus, which may also expose humans to other microorganisms carried by this tick, occasionally resulting in infection [74]. These coinfecting pathogens interact with host symbionts, influencing the utilization of host resources and modulating host immunity [40, 75]. Due to the high levels of coinfection in ticks and hosts, they serve as a useful model to study mechanisms of pathogen coexistence [40, 70, 71, 76]. To date, research on coinfections in ticks has primarily focused on studying the pathogens involved and the immune responses of both the host and the tick. Similarly, the influence of the tick microbiome on pathogen coinfection remains largely unexplored [77, 78]. In the present work, we have developed an innovative strategy to study dual infection in ticks from a microbial population perspective, using microbial co-occurrence networks.
In a previous study, Porcelli et al. [42] developed a model for investigating infections and coinfections with B. afzelii and TBEV in C3H mice. The findings of our research indicate that exposure of I. ricinus ticks to infected animals can influence the composition and dynamics of the microbial community. This was achieved by sequencing the 16S rRNA from nymphs molted from larvae fed on infected and coinfected mice. The infection with B. afzelii demonstrated a reduction in bacterial richness, with no significant differences observed when compared to the Neg group. This result contrasts with the findings reported by Hamilton et al. [79], where nymphs infected with B. afzelii exhibited a less abundant but more diverse bacterial community. Conversely, TBEV infection resulted in significant differences when compared to both the Neg and Borr groups, suggesting a more diverse bacterial community.
The co-occurrence network analysis revealed a similar structure in the community assembly, with positive associations between the taxa of I. ricinus microbiome in all conditions. Our results align with those of a previous analysis of I. ricinus nymphs collected in the field, in which the majority of observed interactions among taxa were positive [80]. Interestingly, the TBEV network exhibited greater resilience to the removal and addition of nodes. While higher diversity and stability are often correlated [81], these findings suggest that the virus exerts a stabilizing influence on the tick microbiome. TBEV infection has been observed to induce metabolic alterations in the host organism, particularly linked to inflammatory responses and immune modulation [82]. Nonetheless, the specific influence of tick-borne viruses on the tick microbiome remains largely uninvestigated [83].
Tick-borne pathogens coexist and interact with various bacterial species within the tick microbiome, forming an ecological unit referred to as the tick holobiont [84]. These interactions impact the vectorial capacity through a bidirectional relationship between the microbiota and pathogens [85]. This relationship may influence other bacteria, potentially explaining the observed shifts in Borreliella associations within the I. ricinus microbiome under different experimental conditions (Figure 6). Previous studies have also demonstrated a robust correlation between the presence of certain pathogens and the structure of the I. ricinus microbiota [80]. These findings lend support to the notion that pathogens need to alter microbial dynamics in order to establish themselves and maintain a persistent presence within the tick.
During viral and bacterial infections, the host organism responds to signaling molecules generated in response to the pathogen’s presence [86, 87]. This response activates leukocytes, which increase the activity of prooxidative enzymes responsible for generating reactive oxygen species (ROS), crucial for the host’s immune defense against pathogens [88]. For instance, coinfection with A. phagocytophilum and B. burgdorferi s.s. has been shown to result in shifts in inflammatory cytokines such as IL-12, TNF-α, and IFN-γ, as well as alterations in the antibody response to A. phagocytophilum in mice [33, 89]. In ticks, specifically I. scapularis, those fed on B. burgdorferi-infected mice have been observed to acquire host IFN-γ, which then activates the tick’s Rho-like GTPase via STAT signaling, resulting in the expression of antimicrobial peptides (e.g., Dae2). This enables the tick to initiate defense mechanisms to control the proliferation of ingested pathogens from the blood meal [90]. It is plausible that this immune activation could also influence the broader microbiome within the tick. The production of ROS and antimicrobial peptides might create selective pressures, potentially modulating the tick’s microbiota composition by impacting microbial survival. This modulation could favor certain symbiotic bacteria while limiting the proliferation of other strains, including opportunistic or pathogenic ones. Our findings, showing shifts in the I. ricinus microbial community structure after exposure to pathogens such as TBEV and B. afzelii, may reflect such immune-driven processes. Although the exact mechanisms remain to be fully elucidated, these interactions suggest a complex interplay where pathogen-induced immune responses could indirectly shape the tick microbiome, influencing both microbial diversity and pathogen persistence. Further studies are needed to unravel the extent and specific pathways through which the tick’s immune system interacts with and modulates its microbiota.
Our sequence data confirmed the dominance of Candidatus Midichloria mitochondrii in I. ricinus: this endosymbiont accounted for >900 k read pairs—nearly an order of magnitude more than any other taxon. Midichloria is a vertically transmitted, intramitochondrial bacterium that has been detected in virtually every I. ricinus population examined to date and is considered part of the tick’s “core” microbiome [91, 92]. Because Figure 2 depicts only those genera whose clr abundance differed significantly between experimental groups, Midichloria—though highly abundant—does not appear in the heat-map; its relative abundance remained statistically unchanged across uninfected, singly infected, and coinfected treatments, suggesting that neither B. afzelii nor TBEV perturbs this obligate symbiont. The stability of Midichloria is consistent with its proposed essential functions (e.g., provision of B vitamins and modulation of oxidative metabolism) and with reports that experimental suppression of Midichloria-like organisms can reduce tick fecundity [93].
By contrast, we did not detect Wolbachia above our filtering thresholds (≥30% of samples and ≥10 reads). Apparent Wolbachia signal in ticks is frequently attributable to DNA from the parasitoid wasp Ixodiphagus hookeri or other arthropod contaminants rather than true infection of the tick itself [94]. Similar Wolbachia-negative results have been obtained for both field and laboratory populations of I. ricinus and I. scapularis when rigorous contamination controls are applied [95]. Together, these findings highlight the importance of stringent quality filters and ecological context when interpreting low-abundance 16S rRNA signatures in tick microbiome studies.
5. Conclusions
This study demonstrates that B. afzelii and TBEV infections significantly impact the microbiome of I. ricinus ticks. TBEV infection was associated with increased microbiome diversity and network resilience, suggesting that the virus may stabilize microbial communities within ticks. In contrast, B. afzelii infection did not significantly alter microbiome diversity, indicating more specific effects on certain microbial taxa. Our findings reveal the complex dynamics between pathogens and the tick microbiome, highlighting that coinfection scenarios can modulate microbial community structure and influence vector competence. The study emphasizes the utility of network analysis in understanding microbial interactions and suggests that viral infections could enhance microbiome stability, potentially affecting pathogen persistence. Future research should explore the molecular mechanisms behind these interactions, as understanding the tick holobiont may inform novel strategies for controlling tick-borne diseases.
Ethics Statement
The authors have nothing to report.
Consent
The authors have nothing to report.
Conflicts of Interest
The authors declare no conflicts of interest.
Author Contributions
The authors confirm their contribution to the paper as follows: Apolline Maitre: conceptualization, writing – original draft, formal analysis, methodology, visualization, and writing – review and editing. Myriam Kratou: writing – original draft, formal analysis, methodology, and writing – review and editing. Ana Laura Cano-Argüelles: writing – original draft, and writing – review and editing. Stefania Porcelli: investigation and writing – review and editing. Lianet Abuin-Denis: formal analysis and writing – review and editing. Elianne Piloto-Sardiñas: formal analysis and writing – review and editing. Lourdes Mateos-Hernández: data curation and writing – review and editing. Dasiel Obregon: software and writing – review and editing. Miray Tonk-Rügen: writing – review and editing. Salma Kaoutar Abdelali: writing – review and editing. Sara Moutailler: resources, supervision, project administration, and writing – review and editing. Alejandro Cabezas-Cruz: resources, conceptualization, supervision, project administration, and writing – review and editing. Apolline Maitre and Myriam Kratou have equal contribution.
Funding
This study was supported by the Collectivité de Corse: SGCE-RAPPORT No. 0300; Junta de Castilla y León: CLU-2019-05-IRNASA/CSIC; Agence Nationale de la Recherche: ANR-10-LABEX-62-IBEID; and European Regional Development Fund.
Acknowledgments
We thank our group members for their valuable discussions, which enhanced earlier versions of the manuscript.
Supporting Information
Additional supporting information can be found online in the Supporting Information section.
Open Research
Data Availability Statement
The data that support the findings of this study are openly available in SRA at https://www.ncbi.nlm.nih.gov/sra/, reference number PRJNA1123907.


