The Relationship Between Waist-to-Hip Ratio and the Risk of Hypertension
Abstract
Background: The association between waist-to-hip ratio (WHR) and hypertension remains controversial, especially among participants with normal BMI. This study attempted to further elucidate the causal relationship between WHR and hypertension through combined NHANES and two-sample Mendelian randomization (MR) analysis.
Methods: Weighted multivariate logistic regression analysis was used to investigate the relationship between WHR and hypertension. Inverse variance weighting (IVW) was used as the primary method. The UK Biobank (UKB) cohort was used as a discovery study. And the Finn cohort was used as a replication study. Multivariate MR (MVMR) analysis was used to further exclude redundant factors.
Results: A total of 45,086,542 weighted records (870 unweighted) with normal BMI were enrolled in the NHANES analysis. After adjusting for potential confounders, subjects in the higher quartiles of WHRs had a higher risk of hypertension (Q2 OR = 2.744 [95% CI, 1.139–6.61], Q3 OR = 3.665 [1.291–10.405], and Q4 OR = 5.58 [95% CI, 1.723–18.068]). The random-effects IVW results showed that higher WHR increased the risk of hypertension in the UKB discovery cohort (OR = 1.0295 [95% CI, 1.0204–1.0387]) and the Finn replication cohort (OR = 1.275 [95% CI, 1.1587–1.4029]). In the MVMR analysis, after adjusting for height and BMI, the IVW results showed that higher WHR increased the risk of hypertension in the UKB cohort (OR = 1.0312 [95% CI, 1.0205–1.0421]) and the Finn cohort (OR = 1.27 [95% CI, 1.1036–1.4615]).
Conclusion: Our study provided sufficient evidence for the causal relationship between higher WHR and hypertension in participants with normal BMI.
1. Introduction
Hypertension is a common chronic disease and an important risk factor for cardiovascular and cerebrovascular diseases [1–3]. Epidemiology has shown that approximately 65%–75% of primary hypertension is due to overweight or obesity [3]. Thus, it is important to identify obesity-related high-risk groups for the prevention and treatment of hypertension [4]. Although BMI is widely used in clinical practice to characterize obesity, a significant limitation of BMI is that it does not distinguish between different body types or body compositions [5]. In addition, BMI cannot be used to determine whether the fat distribution is visceral or subcutaneous, nor can it be used to distinguish between trunk and limb obesity [6]. Other physical characteristics are also associated with the risk of hypertension. Studies that observed a nonlinear risk curve between waist-to-height ratio (WHtR) and hypertension in specific populations, suggesting that the WHtR–hypertension relationship may vary with population characteristics [7]. Waist-to-hip ratio (WHR) is an accurate measure of visceral fat and is considered a more reliable indicator of abdominal fat and body fat distribution [8, 9]. An observational study reported higher WHR associated with the prevalence of hypertension [10]. A prospective study from Korea also showed that WHR could facilitate the prediction of incident hypertension in middle-aged people [11]. Previous studies have found an association between increased WHR and biomarkers of myocardial injury [12]. Compared to traditional obesity indices such as BMI, WHR may better reflect latent metabolic burden, especially in individuals with normal weight. However, another prospective study showed that WHR was not associated with the incidence of hypertension [13]. Observational studies may be limited by small sample sizes, susceptibility to confounders, and reverse causality. Therefore, the causal relationship between WHR and the risk of hypertension remains unclear.
The National Health and Nutrition Examination Survey (NHANES) is a research program that assesses the health and nutritional status of the population in the United States [14]. The NHANES utilizes a stratified, multistage probability sampling method that ensures a representative sample. As a result, the NHANES could provide a large sample and nationally representative data to assess the association between WHR and the risk of hypertension.
Mendelian randomization (MR) is a method that utilizes genetic variation as an instrumental variable to assess the causal relationship between exposure and outcome [15]. As MR is less susceptible to confounding factors, it has also been considered a complementary method to randomized controlled trials [16, 17].
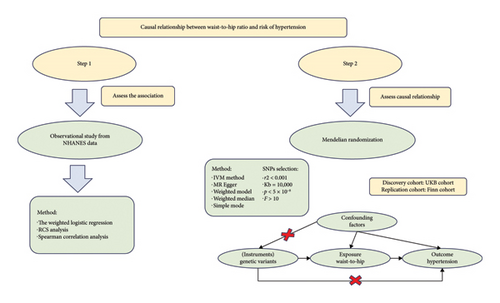
As the relationship between WHR and the risk of hypertension is still controversial, this study explored the causal relationship between WHR and hypertension in participants with normal BMI. In this study, we comprehensively evaluated the relationship between WHR and the risk of hypertension through a large-sample observational study from the NHANES and a two-sample MR analysis, a research process shown in Figure 1.
2. Materials and Methods
2.1. Data Sources
This observational study used data from the NHANES database. Since hip circumference (HC) was not measured in previous survey cycles, this study used data from the 2017–2018 NHANES survey cycle.
2.2. Population Selection
To reduce the impact of antihypertensive medication and secondary hypertension on our analysis, we took effort to exclude this segment of the population. The exclusion criteria for this observational study were as follows: (1) participants were less than 18 years old; (2) participants had no data on hip or waist circumference; (2) participants did not know whether they had hypertension; (3) participants with BMI ≤ 18.5 or BMI ≥ 25; (4) participants with kidney failure, thyroid disease, or COPD; and (5) participants had no data on comorbidities, including heart failure, coronary heart disease, stroke, and liver disease. Finally, a total of 870 participants were enrolled as seen in Supporting Figure 1.
2.3. Definition of Hypertension
All blood pressure measurements were performed in the mobile examination center (MEC). The blood pressure measurement protocol was developed according to the American Heart Association (AHA). After resting for 5 min, a trained certified examiner measured the subject’s blood pressure three consecutive times to obtain blood pressure readings. This study calculated the average of three recordings for each participant. According to the 2017 AHA/American College of Cardiology (AHA/ACC) guidelines, individuals with a systolic blood pressure (SBP) of 130 mmHg or higher and/or a diastolic blood pressure (DBP) of 80 mmHg or higher should be classified as having hypertension [1]. Participants who answered “yes” to the questionnaire “Ever told you had high blood pressure?” were also classified as having hypertension.
2.4. HC Measurement and Calculation of WHR
2.5. Collection of Other Covariates
To further control for potential confounders, we collected demographic variables, including age, gender, race, marital status, and education. In addition, height, BMI, and smoking and drinking status, as well as comorbidities such as diabetes, coronary heart disease, renal failure, stroke, COPD, stroke, thyroid disease, and heart failure, were also collected.
2.6. Summary Statistics for WHRs and Hypertension Patients
Genome-wide association study (GWAS) summary data were obtained from the GWAS catalog (https://www.ebi.ac.uk/gwas/) and the Finn database (https://www.finngen.fi/en). The UK Biobank (UKB) cohort was used as a discovery study. And the Finn cohort was used as a replication study. There were 458,349 samples for WHRs in individuals of European descent. There were 54,358 cases and 408,652 controls for essential hypertension in the UKB cohort. There were 42,857 cases and 162,837 controls for essential hypertension in the Finn cohort. There were 458,235 samples for height and 461,460 samples for body mass index. The summary of GWAS data could be seen in Table S1. To investigate the causal relationship between WHR and hypertension, we identified independent and genome-wide significant SNPs as instrumental variables. The genome-wide significance threshold was set to p < 5 × 10⁻⁸ to screen related IVs for MR analysis. SNPs in linkage disequilibrium (with a r2 < 0.001 within a 10,000-kb range) were excluded from the analysis. In addition, we also excluded SNPs with F-statistics < 10, which are considered weak IVs.
2.7. Statistical Analysis
When analyzing the NHANES data, we first used survey weights for weighted analysis. These weights were used to account for complex survey designs to ensure the reliability of the results. Due to the lack of uniform cutoff points, quartiles were derived based on the distribution within this cohort. WHR was analyzed as a continuous variable and then divided into quartiles according to the WHR (Q1 < 0.82, 0.82 ≤ Q2 < 0.86, 0.86 ≤ Q3 < 0.91, and Q4 ≥ 0.91). The categorical variables were expressed as weighted percentages, and the weighted chi-square test was used for statistical analysis. The nonnormal distribution continuity variables were represented by the interquartile range (IQR), and the rank-sum test was used for statistical analysis. Weighted multivariate logistic regression and stratified analyses were used to investigate the relationship between WHR and hypertension. Significant variables with p < 0.05 were selected for multiple logistic regression analysis. The extended model method was used to adjust the covariates: Model 1 was not adjusted; Model 2 was adjusted for age and gender; and Model 3 was adjusted for age, gender, smoking status, height, and diabetes. Spearman’s test was used to evaluate the relationship between WHR and SBP or DBP.
In the MR analysis, inverse variance weighting (IVW) was used as the primary method to evaluate the causal relationship between WHR and hypertension. The other 4 MR analysis methods, including simple mode, MR Egger, weighted median, and weighted mode, were used to supplement the IVW results. Cochrane’s Q test was used to assess the presence of heterogeneity. If there was significant heterogeneity (p < 0.05), random-effect IVW was used; otherwise, fixed-effect IVW was used. The MR Egger intercept was used to assess the pleiotropy of genetic variation. The MR-PRESSO method was used as an effective means of detecting outliers, and if significantly abnormal SNPs (p < 0.05) were detected, they were eliminated before subsequent MR analysis. Leave-one-out analysis was performed to assess whether genetic variation was driven by a single SNP. Multivariate MR (MVMR) analysis was further used to further exclude redundant factors.
A two-tailed p value < 0.05 was considered significant. All the statistical analyses were performed using R software (Version 4.3.0).
3. Results
A total of 45,086,542 weighted records (870 unweighted) with normal BMI were enrolled in the NHANES analysis. The baseline characteristics of the subjects are summarized in Table 1. Compared to participants with low WHR, those with high WHR were predominantly older, higher, male, and smokers, while there were no significant differences in race, marital status, education level, and alcohol status. In addition, participants with high WHR also had a higher incidence of hypertension and diabetes.
| Total | Weighted percentage/IQR | p value | ||||
|---|---|---|---|---|---|---|
| Q1 | Q2 | Q3 | Q4 | |||
| Age | 0.002 | |||||
| < 65 | 90.1 | 96.5 | 92.2 | 91.5 | 80.6 | |
| ≥ 65 | 9.9 | 3.5 | 7.8 | 8.5 | 19.4 | |
| Gender | < 0.001 | |||||
| Male | 45.5 | 10.9 | 39.5 | 57.9 | 73.2 | |
| Female | 54.5 | 89.1 | 60.5 | 42.1 | 26.8 | |
| Race | 0.171 | |||||
| Mexican American | 5.3 | 5.3 | 5.9 | 5.6 | 4.5 | |
| Non-Hispanic White | 66.8 | 63.8 | 65.2 | 65.4 | 72.2 | |
| Non-Hispanic Black | 9.8 | 14.6 | 12.3 | 8.4 | 4.5 | |
| Other race | 18.1 | 16.3 | 16.6 | 20.5 | 18.8 | |
| Marital status | 0.207 | |||||
| Yes | 55.6 | 50.5 | 49.6 | 57.5 | 63.1 | |
| No | 44.4 | 49.5 | 50.4 | 42.5 | 36.9 | |
| Education | 0.077 | |||||
| < High school | 9.1 | 5.6 | 7.1 | 10.7 | 12.6 | |
| ≥ High school | 90.9 | 94.4 | 92.9 | 89.3 | 87.4 | |
| Smoking status | < 0.001 | |||||
| Yes | 38.8 | 19.6 | 24.0 | 50.7 | 57.5 | |
| No | 61.2 | 80.4 | 76.0 | 49.3 | 42.5 | |
| Drinking status | 0.089 | |||||
| Yes | 13.6 | 6.6 | 14.7 | 14.8 | 19.0 | |
| No | 86.4 | 93.4 | 85.3 | 85.2 | 81.0 | |
| Hypertension | < 0.001 | |||||
| Yes | 26.6 | 8.3 | 21.5 | 29.9 | 46.0 | |
| No | 73.4 | 91.7 | 78.5 | 70.1 | 54.0 | |
| Diabetes | < 0.001 | |||||
| Yes | 3.6 | 0.3 | 0.9 | 1.8 | 10.6 | |
| No | 96.4 | 99.7 | 99.1 | 98.2 | 89.4 | |
| Coronary heart disease | 0.059 | |||||
| Yes | 2.1 | 0 | 1.9 | 0.5 | 5.9 | |
| No | 97.9 | 100 | 98.1 | 99.5 | 94.1 | |
| Heart failure | 0.531 | |||||
| Yes | 0.2 | 0 | 0 | 0.2 | 0.5 | |
| No | 99.8 | 100 | 100 | 99.8 | 99.5 | |
| Stroke | 0.064 | |||||
| Yes | 1 | 0 | 2.0 | 0.4 | 2.0 | |
| No | 99 | 100 | 98.0 | 99.6 | 98.0 | |
| Height (median [IQR]) | — | 163.7 [158.6, 171.1] | 167.6 [159.6, 176.3] | 170.2 [162.2, 176.9] | 171.0 [163.8, 176.3] | 0.001 |
| WHR (median [IQR]) | — | 0.79 [0.76, 0.81] | 0.84 [0.83, 0.85] | 0.88 [0.87, 0.89] | 0.94 [0.93, 0.97] | < 0.001 |
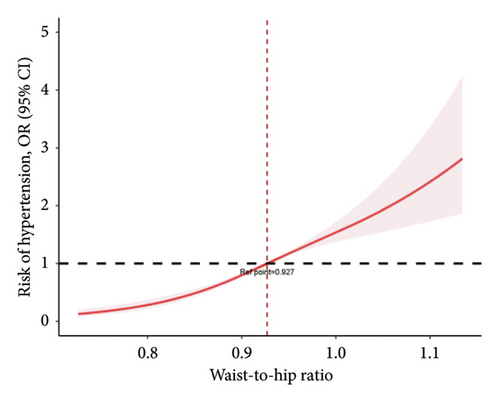
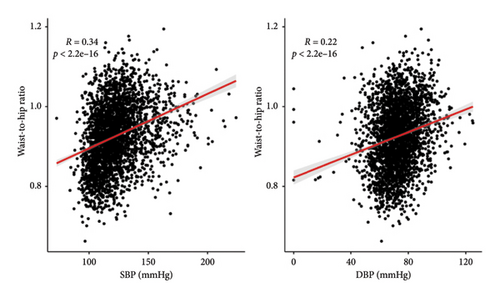
Weighted logistic regression was performed to explore the relationship between WHR and hypertension (Table 2). According to the unadjusted models, higher WHR increased the risk of hypertension in Quartile 2 (OR = 3.035 [95% CI, 1.505–6.12]), Quartile 3 (OR = 4.736 [95% CI, 1.949–11.51]), and Quartile 4 (OR = 9.461 [95% CI, 4.448–20.123]). The covariates included in the multivariate regression model were selected based on (1) established clinical relevance (e.g., age, sex, height, and diabetes, which have been widely demonstrated to influence hypertension progression) and (2) variables showing p value < 0.05 in Table 1. After adjusting for potential confounders, subjects in the higher quartiles of WHR also had a higher risk of hypertension than did those in the lower quartiles (Q2 OR = 2.744 [95% CI, 1.139–6.61], Q3 OR = 3.665 [95% CI, 1.291–10.405], and Q4 OR = 5.58 [95% CI, 1.723–18.068]). In addition, a restricted cubic spline was used to demonstrate the relationship between WHR and hypertension. After adjusting for multiple covariates, it was observed that the risk of hypertension increased with increasing WHR (a cutoff value of 0.927) (Figure 2(a)). WHR showed a similar linear increase in hypertension risk from Q1 to Q4, with a marked inflection point observed at 0.927. WHR showed a significant positive correlation with SBP and DBP (p < 0.001) (Figure 2(b)).
| Model 1 | Model 2 | Model 3 | |
|---|---|---|---|
| Q1 | Ref | Ref | Ref |
| Q2 | 3.035 (1.505–6.12) | 2.752 (1.226–6.178) | 2.744 (1.139–6.61) |
| Q3 | 4.736 (1.949–11.51) | 4.22 (1.521–11.711) | 3.665 (1.291–10.405) |
| Q4 | 9.461 (4.448–20.123) | 7.266 (2.345–22.513) | 5.58 (1.723–18.068) |
| p for trend | < 0.001 | 0.003 | 0.008 |
- Note: Model 1 was adjusted for none. Model 2 was adjusted for age and gender. Model 3 was adjusted for age, gender, smoking status, height, and diabetes.
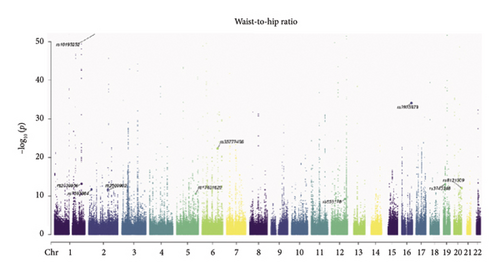
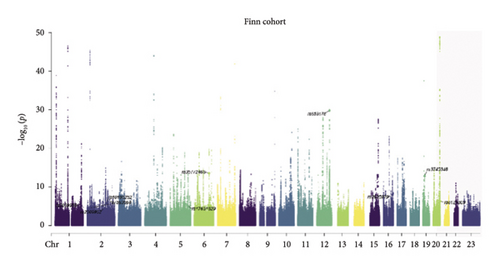
According to the NHANES analysis, weighted multivariate regression analysis revealed that higher WHR increased the risk of hypertension. Therefore, we further performed MR analysis to investigate the causal relationship between WHR and the risk of hypertension. All selected SNPs had F-statistics > 10, with a mean F-value of 70.4 (UKB cohort) and 70.3(Finn cohort). MR Egger analysis revealed no significant horizontal pleiotropy in any of the MR analyses (Figure 3). Since Cochran’s Q test showed significant heterogeneity among MR studies, the random-effects IVW test was selected for subsequent analysis. Whether using IVW or weighted median, all methods yielded effect estimates in the same direction. In the UKB discovery cohort, the random-effects IVW results showed that higher WHR increased the risk of hypertension (OR = 1.0295 [95% CI, 1.0204–1.0387]) (Figure 3). Similarly, simple mode (OR = 1.0247, 95% CI: 1.0021–1.0478), MR Egger (OR = 1.0354, 95% CI: 1.0131–1.0583), weighted median (OR = 1.0265, 95% CI: 1.0175–1.0356) and weighted mode (OR = 1.0247, 95% CI: 1.0101–1.0395) also indicated higher WHR increased the risk of hypertension. A similar trend was found in the Finn replication cohort by the IVW method (OR = 1.275 [95% CI, 1.1587–1.4029]). Simple mode (OR = 1.576, 95% CI: 1.256–1.9775), weighted median (OR = 1.2808, 95% CI: 1.1775–1.3932), and weighted mode (OR = 1.3081, 95% CI: 1.1453–1.4941) also provided evidence that higher WHR increases the risk of hypertension.
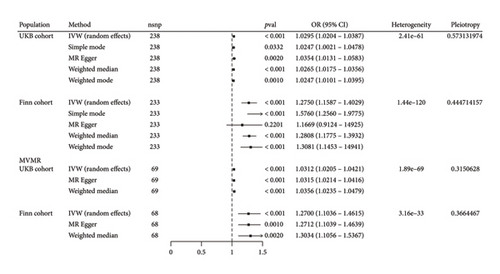
In the MVMR analysis, after adjusting for height and BMI, the random-effects IVW results showed that higher WHR increased the risk of hypertension in the UKB cohort (OR = 1.0312 [95% CI, 1.0205–1.0421]). Interestingly, after adjusting for height and BMI, a similar trend was also found in the Finn cohort by the IVW method (OR = 1.27 [95% CI, 1.1036–1.4615]).
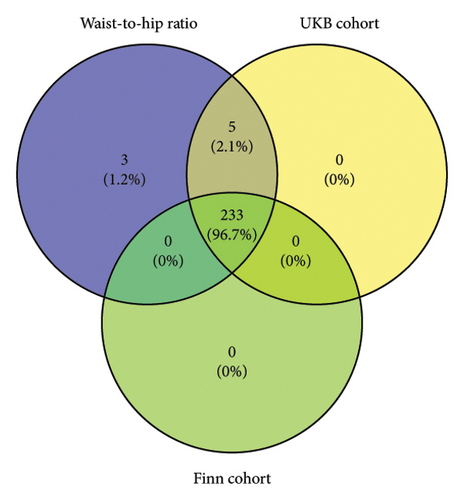
The instrumental variables shared between WHR and hypertension are shown in Figure 4. The leave-one-out analysis further confirmed that the causal relationship between WHR and hypertension risk was not driven by a single SNP, which indicated that our results were robust and reliable (Supporting Figure 2).

Subsequently, we performed stratified analyses by gender, age, smoking status, drinking status, and education. The results revealed no significant gender-specific differences in the association between WHR and hypertension risk (p for interaction > 0.05). Notably, among alcohol consumers, elevated WHR showed a higher hypertension risk (OR 3.04, 95% CI: 1.69–5.47) (Supporting Figure 3).
4. Discussion
In this study, we combined the NHANES observational study and two-sample MR analysis to investigate the association between WHR and the risk of hypertension. Individuals with high WHR had a higher risk of hypertension according to the NHANES analysis. Similarly, the two-sample MR analysis provided further evidence of a causal relationship between WHR and the risk of hypertension, indicating that WHR may be a modifiable factor for hypertension.
A study including 4123 subjects revealed that WHR was the best predictor of new-onset hypertension in a Chinese population [18]. Another study also showed that WHR was associated with hypertension in Iranian adults [19]. Wieniawski and Werner reported that WHR was the best predictor of hypertension in teenagers [20]. The results of these observational studies were similar to our NHANES analysis. After adjusting for potential confounders, individuals in the highest WHR group had a 5.58-fold higher risk of hypertension than those in the lowest group. However, interestingly, Nagar et al. reported there was no significant correlation between WHR and hypertension [21]. Since observational studies are susceptible to confounding factors, we further conducted MR analysis. In the UKB discovery cohort and the Finn replication cohort, both indicated WHR increased the risk of hypertension. In MVMR, after adjusting for height and BMI, two cohorts also showed that WHR could increase the risk of hypertension, which indicated that our results were robust and reliable.
In obesity-related hypertension, insulin resistance could increase adipokine secretion and sympathetic nervous system (SNS) activity [22, 23]. In the NHANES study, we found a higher proportion of patients with diabetes among participants with a high WHR. Insulin resistance could cause activation of the renin–angiotensin system, enhance SNS activity, promote endothelial dysfunction, and increase peripheral and renal vascular resistance, which could increase blood pressure [24–26]. Previous studies have shown that activation of the SNS, especially renal sympathetic nerve activity, plays an important role in obesity-related hypertension [27–29]. In addition, these patients were compared with normal obese patients. Angiotensin expression was increased in obese patients with hypertension in subcutaneous adipose tissue [30]. In addition, even in individuals without overt overweight, central adiposity may already impose a hemodynamic burden. Therefore, WHR may increase the risk of hypertension under the influence of these factors. This group may represent a “metabolically obese but normal weight” phenotype, where central fat accumulation exists despite normal overall BMI. Increased WHR may be accompanied by abnormal myocardial stress markers. Serum micronutrients and nutritional status also influence blood pressure. Prior studies have indicated that elements such as selenium may be related to blood pressure regulation, suggesting that future research could integrate these factors [31]. In short, the WHR is simple, convenient, and easy to measure in a large population. As a modifiable factor, WHR deserves more attention to reduce the risk of hypertension.
This study primarily focused on the association between WHR and hypertension, without incorporating other established cardiovascular risk biomarkers linked to hypertension (e.g., hs-CRP, homocysteine, and uric acid). This approach was based on the following considerations: (1) the primary hypothesis centered on WHR and (2) avoidance of statistical issues arising from multiple testing. Future research should further explore the role of these biomarkers in hypertension. This study also has several strengths. First, the large sample population in the NHANES data allowed us to simultaneously adjust for multiple confounders to assess the association between WHR and hypertension. In addition, MVMR analysis could further exclude redundant factors to ensure the robustness of our MR results. Notably, consistent results were obtained in this large-sample observational study and MVMR results, which indicated that our results were reliable.
5. Conclusion
By combining the large observational study of the NHANES and MR analysis, our study provided evidence for the causal relationship between higher WHR and hypertension in participants with normal BMI. WHR is simple, convenient, and easy to measure in a large population. As a modifiable factor, WHR deserves more attention to reduce the risk of hypertension.
Nomenclature
-
- WHR
-
- Waist-to-hip ratio
-
- NHANES
-
- National Health and Nutrition Examination Survey
-
- HC
-
- Hip circumference
-
- MEC
-
- Mobile examination center
-
- AHA/ACC
-
- American Heart Association/American College of Cardiology
-
- GWAS
-
- Genome-wide association study
-
- UKB
-
- UK Biobank
-
- IQR
-
- Interquartile range
-
- SBP
-
- Systolic blood pressure
-
- DBP
-
- Diastolic blood pressure
-
- IVW
-
- Inverse variance weighting
-
- MVMR
-
- Multivariate MR
-
- SNS
-
- Sympathetic nervous system
Ethics Statement
The authors have nothing to report.
Consent
The authors have nothing to report.
Conflicts of Interest
The authors declare no conflicts of interest.
Author Contributions
Jiaqiang Yang and Zhongyuan Meng were responsible for conceptualization and manuscript drafts; Jiaqiang Yang, Puyue Tang, Jiaru Yang, and Haigang Huang were responsible for data download and statistical analysis; Jiaqiang Yang and Puyue Tang participated in the literature review; Puyue Tang and Zhongyuan Meng were responsible for revision and supervision. All authors reviewed and approved the final manuscript. Jiaqiang Yang and Puyue Tang contributed equally to this study.
Funding
This research was supported by the Guangxi Health Commission Youth Self-Raised Fund Project (Z-L20220866).
Acknowledgments
We are grateful to the researchers and individuals who contributed to this research.
Supporting Information
Additional supporting information can be found online in the Supporting Information section.
Open Research
Data Availability Statement
All data were obtained from publicly available sources.


