Evidence of Gold Mineralization Using Geoelectrical Methods (ERT and IP) in Bindiba Village, East Cameroon: A Case Study
Abstract
Located within the Adamaoua-Yadé domain in Cameroon, the Lom volcano–sedimentary formation represents a central component of the Central African Pan-African Belt, which emerged during the Pan-African orogeny between 600 and 500 Ma. The complexity of tectonic processes in this area has resulted in geological structures favorable to the presence of gold mineralization. The dynamic geological environment, characterized by detrital deposits and intense tectonic phases, is illustrated by the deformed and metamorphosed metasedimentary and metavolcanic rocks of the Lom Formation. The accumulation of precious minerals such as gold and diamonds is facilitated by optimal stratigraphic conditions, including basalt, tuffs, quartz-bearing sediments, schists, and conglomerates. These economically significant resources are closely associated with regional faults and ENE-WSW-oriented shear zones, which promote the circulation of mineralizing hydrothermal fluids. A geophysical study was conducted in the village of Bindiba, a locality situated within this geological formation, not far from a semimechanized gold mining operation. The study is aimed at establishing and proposing a modeling of potential mineralized targets. The geophysical study combines the use of electric resistivity tomography (ERT) and induced polarization (IP). The acquisition includes 17 parallel electric tomography lines in a Schlumberger configuration. The acquired data allowed the production of 2D inversion models, which were then interpolated to generate block models and pseudo-3D isosurface models of potential mineralizations. The correlation of geological information and pseudo-3D isosurface models allowed the characterization of the existence of three polarizable bodies, marked by the presence of sulfides, with high chargeability values (M ≥ 30 mV/V). One of these bodies, presenting a strong chargeability, correlated to a low resistivity (Rho < 900 Ωm), is observed in the center of the study area. This body presents its roof at an average depth of 17 m, with a lateral extension and a NE-SW orientation consistent with the general orientation of the main tectonic lines of the region. The two other polarizable bodies were identified near the surface, both in the center and in the north with average depths of 8 and 15 m, respectively. They both present a fairly good correlation with high resistivity values (Rho ≥ 5500 Ωm), which could characterize probable silicification zones.
1. Introduction
The mining industry plays an undeniable role in the advancement of human societies around the world. It provides a supply of essential raw materials to many technological processes. Not only has this industry stimulated technological innovation, but it has also shaped the global economy by fueling various industrial sectors with vital resources. Thus, the mining industry constitutes a fundamental pillar in the evolution of our civilization [1–3]. Accelerated urbanization in developing countries, combined with periods of economic growth and recovery after global recessions, as well as technological advances, stimulates the demand for raw materials on the global market [4]. At the same time, mining plays a vital role in the global economy by providing raw materials and promoting economic growth [5, 6].The discovery of new opportunities for raw mineral extraction is a gradual and interconnected process that requires increasing investments and risk reduction [2, 4]. It begins with the surface identification of signs of mineralization, which may indicate the presence of a subsurface ore deposit [2]. Subsequently, a detailed targeted phase is conducted, employing various indirect investigation techniques as a rapid and cost-effective means of deep exploration [7, 8]. In this context, geophysics holds particular importance. It enables the measurement and analysis of often pronounced differences between the physical properties of mineral deposits and those of surrounding rocks [4, 9]. These contrasts can be detected using field measurement instruments, making geophysics a valuable tool for identifying and locating potential subsurface mineral deposits. It stands as a key discipline in mineral exploration [6, 8, 10–12], groundwater exploration [13, 14], environmental studies [7, 15, 16], and civil engineering constructions [17–20]. It allows scientists and engineers to obtain crucial information about subsurface composition and structure without the need for excavation or drilling, making exploration more efficient, safer, and less costly.
Precious mineral deposits, such as gold, are regulated by geological structures, including faults, fractures, and shear zones, in many regions worldwide [21–23]. These structures are associated with hydrothermal and/or metasomatic processes [8, 24]. Gold deposits typically occur in favorable geological environments, often associated with veins or occasionally with layers, frequently filled with quartz and barite [25, 26].
Cameroon is often described as a “geological and mining scandal” due to the multitude of indicators revealed in a geological context rich in structural elements (faults, shear zones, geological contacts, etc.) [27–31]. These structural elements correspond to corridors or zones likely to contain natural mineralizations (such as gold, diamonds, and uranium). The Eastern region of Cameroon is recognized as the gold district. Gold mining has been known in the Eastern region since the 1960s, with a preference for quartz veins, granitoids, and schists from the Lom series [30, 32]. The area around the village of Bindiba, the basis of this study, is part of the Lom formation [30].
The proposed geophysical study is aimed at identifying, delimiting, and modeling potential gold mineralization zones in the subsurface of the Bindiba village using induced polarization (IP) and direct current (DC) resistivity anomaly.
2. Geographical and Geological Setting of the Study Area
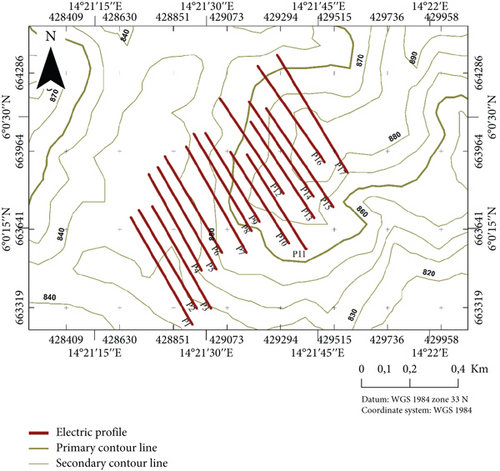
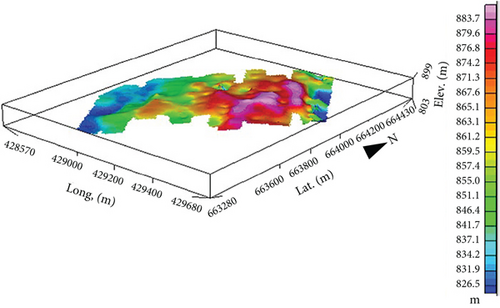
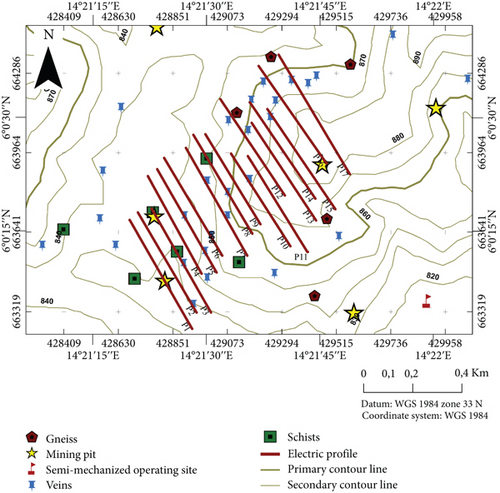
The study area is located in the village of Bindiba, between latitudes 665 750 m N and 668 500 m N, and longitudes 428 575 m E and 429 700 m E in the WGS84 UTM33N coordinate system (Figure 1). The village is part of the Lom and Djérem and Mbere departments, located in the northern part of the Garoua-Boulaï and south Meiganga municipality (Figure 1a), in the Adamawa-Eastern regions of Cameroon. The prevailing climate is a Guinean equatorial climate with four seasons unevenly distributed throughout the year: a long dry season from December to May, a light rainy season from May to June, a short dry season from July to August, and a heavy rainy season from September to November [33, 34]. The region presents a gentle relief with altitudes ranging between 700 and 950 m (Figure 1c) [29, 34]. The study area is mainly covered with bushes and grassy savannas in the north, while evergreen forests dominate the southern part. Annually, the average temperature is 24.7°C, and the average annual rainfall varies from 1500 to 2000 mm [34]. These parameters play a decisive role in the alteration of rocks, the transport of gold particles, and their concentration within placer deposits in drainage basins [35, 36].
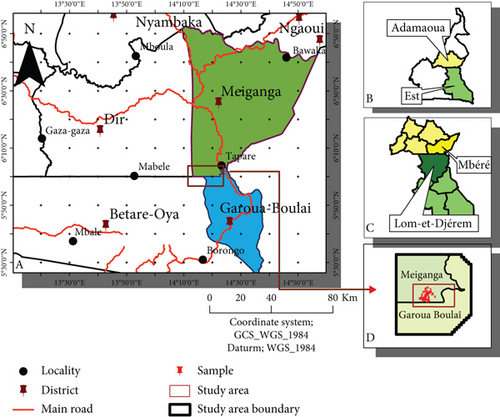
The geological context of the region has been well-documented in previous research [37–42]. The compilation of these different studies reveals that the study area is located within the Lom series, which belongs to the Adamaoua-Yade domain, also known as the Central Cameroon domain (Lower Proterozoic). The formation of this region results from a collision between the Congo craton and the Adamaoua-Yade domain during the Precambrian [30, 43]. Subsequently, this phenomenon underwent aggradation, giving rise to significant petrographic and structural elements. These elements are characterized by the rapid opening and closing of marginal sedimentary basins associated with subduction to the north under the Adamaoua-Yade domain [40]. Notably, the Mbéré and Djérem basins form an almost continuous and narrow alignment extending over more than 300 km, known as the “South-Adamaoua Cretaceous trough” [43, 44]. This tectonic depression is bordered by major ENE-WSW-oriented mylonitic faults that facilitate the circulation of mineralizing hydrothermal fluids. These faults and mylonite bands, inherited from Pan-African deformations, represent structural weaknesses favorable to the concentration of precious minerals such as gold [45, 46] (Figure 2)
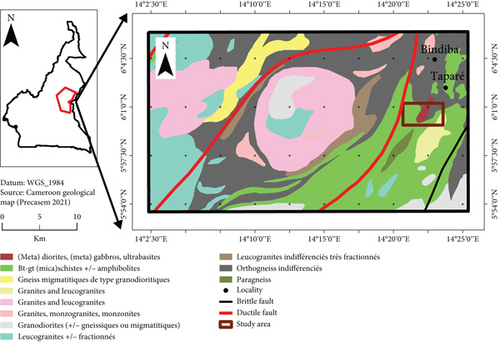
The Lom series is a notable geological formation known for its mineral diversity, including gold, lead, bismuth, molybdenum, and quartz vein intrusions. This wealth is attributed to the remobilization of the Archean–Paleoproterozoic basement [43, 47]. In addition, the Lom region presents significant mining potential, with resources such as ornamental stones, construction materials, clay, sand, gravel, graphite, diamond, and gold [8, 48].
From a structural point of view, studies conducted by [28, 30, 38, 49] reveal that the Eastern region has been affected by three phases of deformation. The first phase (D1) is characterized by internal mylonitic deformation zones that define shear surfaces. The second phase (D2) creates the regional structure characterized by the S2 foliation. This S2 foliation is oriented NE-SW in the mylonite zone and NE-SW to WNW-ESE in the gneiss and migmatites, with dips either towards the northwest or southeast.
3. Geological Field Work
Field data collected during our geophysical and geological campaign (Figure 3) indicate that the bedrock is made up of metamorphic rocks (mainly migmatites, gneiss, amphibolites, and quartzites) intersected by magmatic rocks, and both rock sets appear to form a cohesive entity (Figure 3). This basement complex was established during several Precambrian orogenic cycles [50]. The gneiss encountered on the site comes from intrusions of upper gneiss rocks. These gneiss outcroppings in the study area result from mild metamorphism (disorganized minerals), and their outcrop mode extends in blocks and slabs over large areas (Figure 3a). We also observe a gneiss associated with a muscovite and biotite assembly (Figure 3b), as well as a block of gneiss associated with a quartz vein (Figure 3c).
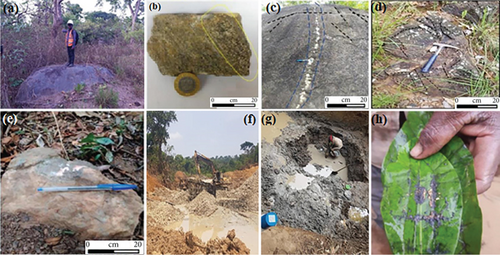
The quartzites are derived from the recrystallization of sandstone. In the study area, quartzites are generally observed on the slopes of hills (Figure 3e), probably due to artisanal mining (gold mining) (Figure 3g,h), and erosion agents form small blocks of fused quartzite grains. Altered schists also outcrop in the area (Figure 3d).
The study area is located approximately 600 m from a semimechanized gold mining operation (Figure 4), demonstrating its potential in sulfurous minerals (Figure 3f). Table 1 presents the resistivity and chargeability values of the main types of rocks, cover, and deposit that could facilitate the identification of materials in the subsurface [51]. Chargeability values increase with the concentration of sulfurous minerals. Materials rich in sulfides present electrical characteristics distinct from those of the surrounding host rocks, making them a good target for geophysical exploration [52]. Figure 4 presents the geological context of the study area.
| Rock type | Resistivity (Ω.m) | Chargeability (mV/V) | ||||
|---|---|---|---|---|---|---|
| Typical | Lower | Upper | Typical | Lower | Upper | |
| Ultramafic | 3000 | 100 | 6500 | 30 | 20 | 200 |
| Mafic | 500 | 10 | 10,000 | 20 | 5 | |
| Intermediate | 7000 | 1000 | 60,000 | 15 | 8 | 20 |
| Felsic | 4000 | 300 | 20,000 | 10 | 2 | |
| Carbonates | 1500 | 350 | 6000 | 5 | 2 | 20 |
| Sandstone | 300 | 50 | 4000 | 5 | 3 | 12 |
| Shale | 500 | 20 | 2000 | 5 | ||
| Graphitic shale | 5 | 0.1 | 10 | 50 | ||
| Gneiss | 5000 | 1000 | 7000 | 10 | 6 | 30 |
| Schist | 500 | 20 | 1000 | 5 | 5 | 20 |
| Gold-bearing quartz veins with low sulphides | 3000 | 1000 | 12,000 | 25 | 10 | 80 |
| Alluvion | 40 | 10 | 1200 | 8 | 3 | 20 |
| Clay | 50 | 1 | 500 | 10 | 5 | 30 |
| Gravel | 600 | 480 | 900 | 2 | 1 | |
4. Materials and Methods
4.1. Data Choice of Geophysical Methods
The Bindiba area, which lies in the Lom basin, has wells from artisanal gold mining activities and a semimechanized mining site on the flanks and at the base of the mountains. The geological study is based on the theory of a disseminated mineralization.
The use of many geophysical methods is justified, as in most studies, by a number of factors, including the method’s sensitivity (for the detection and location of horizontal and vertical structures or bodies), the type of mineralization sought (metallic sulfides), the depth of the targets (near surface), the geological environment (site composed of ancient sedimentary deposits) and geomorphological environment (topographic variation), the deposit mode (diffuse or disseminated), and the area of investigation [12, 53]. Employing the electrical method is the best approach for this study (Figure 5).
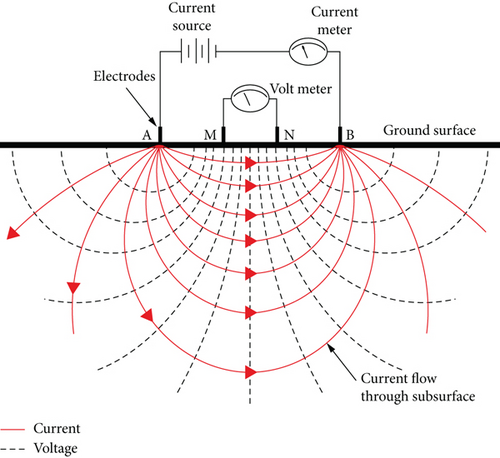
The selection of electrical DC and IP methods over SP (potential spontaneous) methods is driven not only by their high level of precision and thoroughness of the investigation but also by their ability to identify specific mineralization types (argiles, metal sulfides, graphite, and some metal oxides like magnetite) [55–59]. Additionally, these two methods make it easy to use electrical tomography techniques (collecting electrical data in vertical sections). Moreover, other researchers, including [4, 8, 25, 52, 53] have used these methods to create 3D models of geoelectric anomalies corresponding to the desired targets.
4.2. Electrical Resistivity Tomography (ERT) Method
VMN is the potential drop between Electrodes M and N, in millivolts. IAB is the electric current injected between Electrodes A and B, in milliamperes.
ERT allows us to highlight the lateral and vertical variations of resistivity in the subsoil by providing us with 2D information based on the distribution of the resistivity of the subsurface [8, 25]. For more details on geoelectric methods, numerous documents can be consulted [62–66]. This resistivity value allows us to characterize a formation at the center of the station.
4.3. IP Method
IP method is based on the polarizability effect associated with a physical phenomenon that occurs after the delay of artificial electric field stimulation in soils and rocks. Chargeability is a physical parameter intrinsic to geological materials, such as metallic sulfides, graphite, oxides, clay minerals, and water with high salt content, whose measurement can be done by time-domain (millivolts per volt) IP surveying or frequency-domain (milliseconds) IP surveying [67].
5. Data Acquisition and Processing
5.1. Data Acquisition
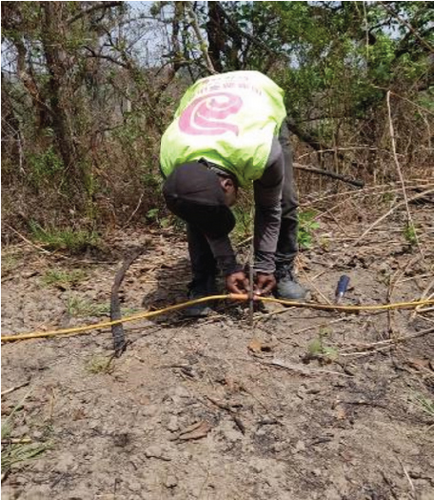
A resistivity measurement device, the SYSCAL Junior Switch 72 (Figure 6, manufactured by IRIS, was used with a power output of 100 W. This equipment allows simultaneous measurement of resistivity and chargeability. In this study, a Schlumberger array was employed due to the short electrode spacing (5 m), which generates a drop-shaped potential field, with a flow vector becoming progressively more vertical and potential field distortion appearing at increasing depths.

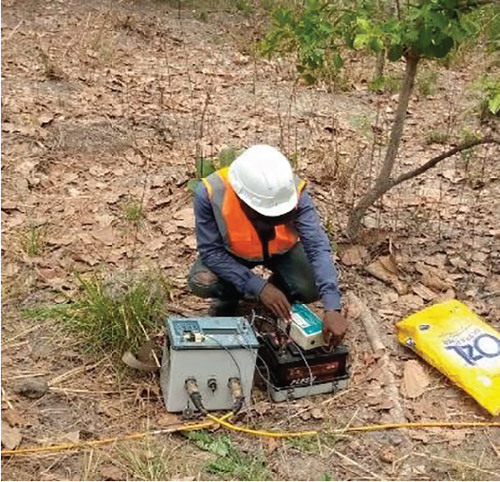
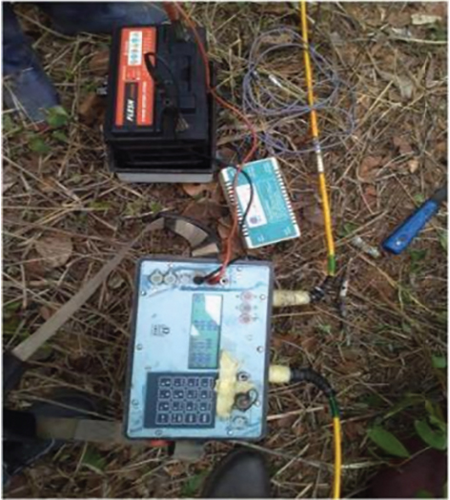
Electrical resistivity and chargeability measurements were conducted down to a depth of 334 m along 17 electrical survey profiles, each 510 m in length. The spatial arrangement of the 17 electrical tomography profiles (labeled P1–P17) in the study area is regular, following a grid spaced approximately 50 m apart, covering an area of 800 m × 1000 m (Figure 1b). The geophysical survey profiles were oriented along a NW-SE axis (Table 2) to intersect all geological structures in the study area perpendicularly to the main regional structures [8, 29, 69]. The resistivity and chargeability values measured in this area range from 2.48 to 5991.84 Ω.m and from 1.01 to 99.95 mV/V, respectively (Table 2)
| Profile name | Origin coordinates (m) | End coordinates (m) | Direction | Electrode spacing (m) | Max depth (m) | Resistivity max; min (Ω.m) | Chargeability max; min (mV/V) |
|---|---|---|---|---|---|---|---|
| P 1 |
|
|
NW-SE | 5 | 33.4 |
|
|
| P 2 |
|
|
NW-SE | 5 | 33.4 |
|
|
| P 3 |
|
|
NW-SE | 5 | 33.4 |
|
|
| P 4 |
|
|
NW-SE | 5 | 33.4 |
|
|
| P 5 |
|
|
NW-SE | 5 | 33.4 |
|
|
| P 6 |
|
|
NW-SE | 5 | 33.4 |
|
|
| P 7 |
|
|
NW-SE | 5 | 33.4 |
|
|
| P 8 |
|
|
NW-SE | 5 | 33.4 |
|
|
| P 9 |
|
|
NW-SE | 5 | 33.4 |
|
|
| P 10 |
|
|
NW-SE | 5 | 33.4 |
|
|
| P 11 |
|
|
NW-SE | 5 | 33.4 |
|
|
| P 12 |
|
|
NW-SE | 5 | 33.4 |
|
|
| P 13 |
|
|
NW-SE | 5 | 33.4 |
|
|
| P 14 |
|
|
NW-SE | 5 | 33.4 |
|
|
| P 15 |
|
|
NW-SE | 5 | 33.4 |
|
|
| P 16 |
|
|
NW-SE | 5 | 33.4 |
|
|
| P 17 |
|
|
NW-SE | 5 | 33.4 |
|
|
5.2. Processing Methodology
Data were collected according to a preprogrammed measurement sequence and automatically stored in the device’s internal memory during acquisition. They were then exported to the computer via the USB interface. The initial phase of data processing involved extracting outlier values from the physical quantities studied using the Prosys II software. Subsequently, these data were processed and modeled using the Res2dinv program developed by Geotomo, which automatically determines the two-dimensional models of resistivity and chargeability of the subsurface [63, 66]. The results of the two-dimensional inversion for each section were recorded in a table and adapted to the specifications of the modeling software used [31]. To georeference the modeling space, the GPS data associated with each measurement point were taken on each electrode and integrated into the database. This table was then used to generate multilevel surface maps and isovalue models (3D visualization models). The process was developed within the Oasis montaj platform. The procedure for generating isovalue models has been described in several studies combining DC resistivity and IP [6, 8, 56, 70]. These 3D visualization models erived from geophysical data greatly contribute to the understanding of complex geological structures during mineral exploration [71, 72].
6. Results
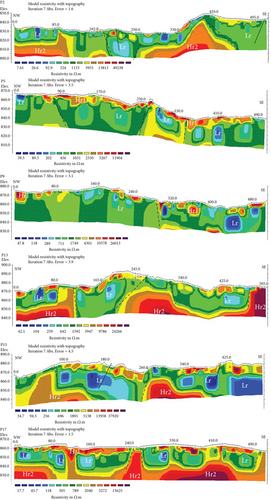
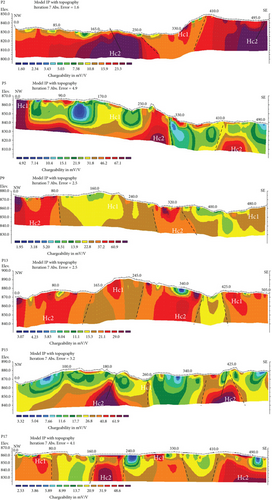
A joint analysis of data from electrical tomography during processing allowed the establishment of a unified scale of values, simplifying comparative studies between profiles. For resistivity data, a scale ranging from 3.56 to 48,239 Ω.m was defined, while for chargeability, the scale ranged from 0.428 to 122 mV/V. This approach highlighted contrasting zones relevant to the study, with cool colors representing low resistivity (Lr) values (Rho < 900 Ω.m) and warm colors indicating high resistivity (Hr) and chargeability values (Rho > 1000 Ω.m and Hc, M > 30 mV/V) (Table 3).
| Profile | Resistivity | Layers | Chargeability | Mineralisation type |
|---|---|---|---|---|
| P2, P5, P9, P13, P15, and P17 | Moderate high with shallower depth (Hr1, 1000 < Rho < 2500 Ω.m) | Mixture of clay, shale, and quartz | Moderate high with shallower depth (Hc1, 10 < M < 30 mV/V) | Secondary |
| Low (Lr, Rho < 1000 Ω.m) | Shale and mixture of clay | High (Hc1, M > 30 mV/V) | Secondary | |
| High (Hr2, Rho > 4500 Ω.m) | Gneiss and quartzite | High deeper depth (Hc2, M > 30 mV/V) | Primary |
To identify potential gold mineralization targets and track their evolution at depth, data from six tomographic profiles were selected out of the initial 17 (Figures 7 and 8). These profiles exhibit clear contrasts in physical properties, marked by zones of high or low values. The remaining sections, characterized by homogeneity and a lack of significant contrasts, were subsequently integrated to generate pseudo-3D visualization models.
6.1. ERT and IP 2D Models
On the resistivity Profiles P2, P5, P9, P13, P15, and P17 (Figure 7), we clearly see a good horizontal arrangement and vertical extension of the Lr anomaly, which are sometimes topped by a significant layer of Hr1 anomalies as observed on the Sections P5, P13, P15, and P17. This analysis, coupled with geological field observations, notably gneiss outcrops (Figure 3b), quartz outcrops (Figure 3e), altered shale outcrops (Figure 3d), and other clay deposits from artisanal mining sites (Figure 3g), allows to associate these high conductivity anomalies with the shale bedrock of the study area (discontinuity). The Lr anomalies observed on the surface on Profiles P2, P9, P13, and P15 could, thus, correspond to altered parts of the bedrock due to the infiltration of precipitation into the soil causing their hydration and the formation of clay minerals. The Hr1 anomalies observed on the surface could be a mixture of clay, shale, gneiss, and quartz (Figure 4); regarding the Hr2 anomalies or low conductivity in-depth on most profiles, they have been associated with schist–gneissic and quartzite basement resulting from the metamorphism of the sandstone complex of the study area, according to alteration and rock outcrop data (Figures 3a, 3d, and 3e). This study has allowed us to identify three main meta-sedimentary formations.
In summary, resistivity models are essential for identifying geological domains in a study area. They also serve as a quality control for chargeability models. When looking for areas of accumulation of metallic sulfides, such as gold, the electrical tomography method is more reliable when using the chargeability approach. According to the following authors [8, 12, 66], areas of sulfide accumulation are always associated with high chargeability (Hc) anomalies. The Profiles P2, P5, P9, P13, P15, and P17 highlight the different areas of Hc which can be attributed to a strong polarization of the sulfide zones and structurally controlled and can be interpreted as high concentrations of sulfide minerals, probably associated with quartz veins [33] (Figure 8). In Figure 8, the areas of secondary mineralization are linked to the Hc1 domain located in the subsurface. According to [55], chargeability anomalies close to the surface can be linked to gold mineralization, which, although hosted in-depth and associated with quartz veins, has migrated to more superficial levels due to mobility properties. Primary mineralization can be associated with the Hc2 domain that extends to depth [12]. The correlation between the Lr, Hr, and Hc anomalies (Table 3) is linked and indicates the presence of veins in the metasedimentary complex that characterizes the Lom series.
6.2. 3D Isosurface of Resistivity and Chargeability
Several authors have demonstrated the effectiveness of 3D modeling compared to 1D and 2D methods, particularly in the context of highly complex mineral exploration [73–76]. Indeed, this approach allowed us to precisely position and better delimit the targets [6, 8, 25, 56].
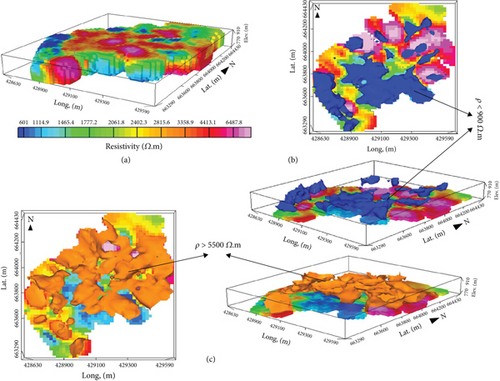
In order to obtain a better spatial visualization of resistivity and chargeability, 3D visualization models were generated by lateral interpolation of the 2D inversion of all the electrical tomography lines acquired in the field. The interpolation of the 3D sections initially allows to generate a block model by the Kriging method (Figures 9a and 10a). Isovalue surfaces were modeled for each block from the interpolation of the resistivity surfaces representative of the acquisition line, which can reveal structures and the possible architecture of the mineralization (Figures 9b and 10b,c).
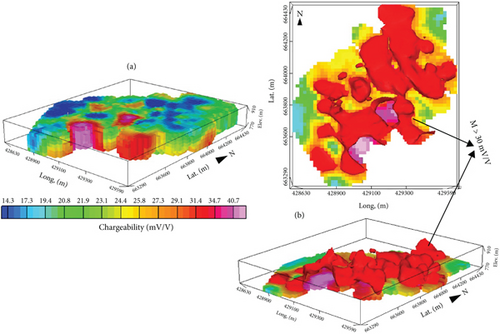
The areas of strong polarization (M > 30 mV/V), located at a depth of about 15 m, have an elongated shape in the NW-SE direction. These areas of Hc tend to present continuity in depth in specific areas (Figure 9b). These chargeability anomalies can be attributed to a strong polarization of the sulfide zones and structurally controlled which can be interpreted as high concentrations of sulfide minerals. These results provide valuable information for mineral exploration and help identify prospective regions in the study area.
The areas of low resistivities (Rho < 900 Ω·m) are located in the NW part and in the center of the study area, starting from a depth of 13 m and extending over 20 m. They are interpreted as the altered parts of the bedrock (Figure 10b), while the areas of Hr (Rho > 5500 Ω·m) are concentrated towards the north with a NE-SW orientation (Figure 10c). The surface areas present higher resistivities due to the presence of schist–gneissic blocks and quartzite throughout the study area (Figure 4) with an average thickness of about 10 m in the subsurface in the center of the area and an average depth of 15 m in the north.
7. Discussion
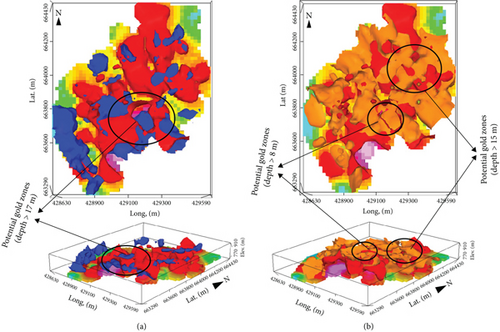
The geological context in Bindiba is part of the Precambrian domain. The region is composed of gneiss, quartzites, and shales (Figure 4). These rocks have undergone deformations due to tectonic forces, resulting in the formation of veins, schistosity, foliations, and fractures. Our fieldwork revealed varying degrees of metamorphism. Furthermore, we found that gold in Bindiba is located in microfractures and quartz veins formed in the surrounding rocks (Figure 3c,g). These metasedimentary rocks are rich in hydrothermal minerals which provide a favorable framework for mineralization. We selected six profiles to represent the resistivity and chargeability sections (Figures 7 and 8), taking into account their diversity and pronounced contrasts. Using 2D resistivity sections, we can identify different geological features. Areas with Hr values are often associated with geological structures such as faults, fractures, mineral veins, and contacts between different geological units. Whereas areas of Lr may be related to the presence of water, altered minerals such as clays are very conductive in the context (Figure 10). Moreover, these areas of Lr are often linked to high levels of sulfides, veins, or disseminated veins (lineament). Using 2D chargeability sections, we can characterize areas containing disseminated sulfides. These areas stand out for their Hc values compared to the sterile host rock (Figure 9). Conversely, areas of low chargeability signal sterility or absence of disseminated sulfides. The analysis of the size and shape of potentially mineralized areas and 2D inversion models was gathered in 3D visualization models in conjunction with the structural data collected in the field. Isovalue surfaces were modeled for each block from the interpolation of resistivity and chargeability surfaces representative of the acquisition line, which can reveal structures and possible mineralization architecture.Based on the 3D resistivity visualization model, it is possible to correlate the first polarizable body with a Lr area and the second with a Hr area. The polarizable body (around 30–67.1 mV/V) and conductor (900 Ω·m) are located in the center of the investigation area. This body presents its roof at an average altitude of 17 m and extends laterally following the NE-SW orientation in agreement with the general orientation of the major tectonic accidents in the region. Moreover, this sulfide-mineralized area could be correlated with a gold mineralization area, given the dominant gold extraction activity in this region and surface geological recognition (Figure 11a). The second and third polarizable bodies (M > 30 mV/V) and resistive (Rho > 5500 Ω·m) were identified, respectively, near the surface in the center (average depth of 8 m) and in the north (average depth of 15 m) of the study area (Figure 11b), linked to the metallic mineralization distributed heterogeneously within the disseminated sulfides and quartzite veins. These areas were probably formed by mechanisms such as sulfuration of the host rock, replacement of ferric ions by auric ions, adsorption–reduction, and phase immiscibility, with a good probability of forming a gold mineralization linked to the network and native. The geological descriptions of the outcrops in the field allowed the recognition of predominantly fractured quartzites. This set of factors justifies the appearance of a sulfide mineralization. The main mining activity in the study area is gold. This is carried out by artisanal miners on the slopes of the mountain under investigation. The samples obtained by the gold panners have shown a high quartz content. The information on the location of possible gold mineralizations from the three-dimensional visualization model allows us to indicate probable occurrences on a map that could be useful for establishing strategies for a future drilling campaign (Figure 11).
8. Conclusion
In the village of Bindiba, in the east of Cameroon, a geophysical study combining the methods of DC resistivity and IP was conducted to identify and define potential areas of sulfide mineralization. The results from the collected data indicate that the studied region is located in a sheared zone where highly altered formations containing sulfide mineralization are found. Electrical discontinuities highlight tectonic inequalities; areas prone to alteration present Lr values, while sulfide mineralization is revealed by Hc values. The combined DC and IP data confirm the general NE-SW orientation of the tectonic structures in the region and suggest that the majority of mineralizations are found at depths between 10 and 20 m below the surface. Thus, the methods of electrical resistivity and IP complement each other to evaluate sulfide ores. In summary, the integration of electrical resistivity and chargeability are effective tools for accurately mapping the mineralized zone, both in terms of lateral delineation and depth.
Conflicts of Interest
The authors declare no conflicts of interest.
Funding
No funding was received for conducting this study.
Acknowledgments
The authors thank the School of Geology of Mining (EGEM) of Meiganga for providing the equipment that allowed the collection of data that served as the basis for this work.
Open Research
Data Availability Statement
Data are available on request from the authors.


