Imaging Processing of 3D DAS-VSP Data Jointly Acquired With a High-Density OBN Survey in the Middle East
Abstract
Joint surface and borehole seismic are a 3D surface-and-borehole seismic exploration method of the simultaneous acquisition of onshore or offshore 3D seismic and VSP (vertical seismic profiling) data using the same sources. When acquiring surface 2D or 3D seismic data in the field, simultaneously acquired 2D or 3D distributed acoustic sensing VSP or DAS-VSP (Distributed Acoustic Sensing-Vertical Seismic Profiling) data can provide full well high-resolution structural images around the borehole and enhance surface 2D or 3D seismic data processing significantly. This paper describes the imaging processing of the 3D DAS-VSP data from 13 wells jointly acquired with a high-density OBN (Ocean Bottom Node) data acquisition project. Apart from the conventional processing steps of 3D VSP data, the deblending processing of the blended acquired multiwell 3D DAS-VSP data using multiple airgun sources, special ringing noise removal procedure, joint domain full waveform inversion (JDFWI) for velocity model update, and one-way wave equation multiple migration (OWEMM) method were used to generate final 3D DAS-VSP data imaging. The results provided good quality structural imaging in a relatively large subsurface area around the 13 wells.
1. Introduction
The use of a fiber optic cable for the DAS-VSP (Distributed Acoustic Sensing-Vertical Seismic Profiling) data acquisition in a borehole has become a well-established application for distributed acoustic sensing (DAS). Recording borehole seismic data using a DAS cable instead of a downhole 3-C geophone array has advantages especially for VSP surveys. The use of an armored fiber optical cable in a borehole can dramatically reduce the operating time required to complete a full well coverage VSP data acquisition as well as offering the opportunity to achieve much higher spatial coverage than typical conventional methods such as downhole 3-C geophone arrays.
Because the downhole optical cable is located near the reservoir to acquire 3D DAS-VSP data, the accurate reservoir formation average and interval velocity, absorption coefficient, attenuation factor, deconvolution operator, anisotropy parameters, and other information can be obtained directly from the 3D DAS-VSP data around the borehole in a certain range. At the same time, it is possible to obtain a high-resolution reflection imaging around and near the borehole with a high fold number.
Borehole and surface joint seismic exploration is a 3D seismic exploration method formed by the combination of surface seismic and VSP survey simultaneously [1]. Using 3D DAS-VSP data from the borehole or boreholes, one can obtain easily the accurate time–depth relationship, formation velocity, deconvolution operator, true-amplitude-recovery (TAR) value, Q value, and anisotropy parameters around the wellbore. Through borehole–surface joint seismic exploration, one can improve and enhance the accuracy and quality of seismic data volume, the SNR, and resolution of reflected waves of target layers. It can also increase the ability of the 3D DAS-VSP data to characterize the geological target around the borehole [2, 3].
2. Joint 3D OBN (Ocean Bottom Node) Data and 3D DAS-VSP Data Acquisition
We completed the world’s largest 3D DAS-VSP data acquisition in October 2022 through the joint OBN and 3D DAS-VSP data acquisition project. While shooting a dense OBN survey offshore Abu Dhabi, two 3D DAS-VSP datasets were recorded utilizing semipermanent armored optical fiber cables present in multiple wells across the field. The high-density OBN survey offshore Abu Dhabi recorded a shot carpet (25 m × 25 m) into 4C nodes on a 25 m × 150 m grid using a wide azimuth, long offset geometry. It was shot over a producing field with four artificial islands used as drilling pads. Optical fibers clamped to the upper completion tubing are present in most wells drilled from these islands. The objective was not only to provide the benefits generally afforded by 3D VSPs but to use the surface-related multiples and obtain a 3D image of the subsurface comparable to the OBN survey. The high-density 3D OBN survey was conducted over four equal width zippers running the full width of the field, east to west (see Figure 1). The high-density OBN survey commenced in November 2021 and was completed in February 2023. The 3D DAS-VSP data recording on the North Island was conducted during operations on Zipper 2 from June to July on 2022 while the 3D DAS-VSP data recording on the Central Island was during acquisition of Zipper 3 from September to October 2022 [4]. By using the airgun sources of an ongoing high-density OBN data acquisition project within the offshore of Abu Dhabi, the high-density OBN data and 3D DAS-VSP data were acquired simultaneously in a total of 13 wells up to 4000-m measured depth (MD) on two different artificial islands. At the North Island, the 3D DAS-VSP data acquisition took place first with six wells (4 oil producers, 1 gas-lifted oil producer, 1 injector). At Central Island, the 3D DAS-VSP data acquisition followed with a total of seven wells recorded (4 of which were gas lifted). Well C7, which was the noisiest gas-lifted producer well, was switched out for Well C8 after the fiber on Well C8 was repaired. Two further wells (X1 and X2, respectively) were recorded at the same time on the North Island after they had been repaired. Vibroseis data was collected on Central Island. Coverage was limited to one location only due to logistics challenges and alignment with multifunctional teams. At each location, all the production and injection wells have armored optical cable preinstalled outside the production or injection tubing and the optical cable was strapped on the tubing with clampers at 10-m spacing [5–8].
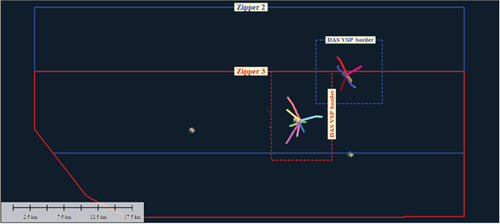
The seven interrogators recorded a total of 5.4 million blended shots (including Vibroseis on one location) of the 3D DAS-VSP data from 13 producers (5 under live gas lift) and 1 injector well. As expected, the injector and gas-lifted wells were the noisiest. Downgoing waves (direct P and converted PS), reflections, and multiples are clearly visible on the raw data gathers. The downhole fiber was also able to pick up noise perturbations caused by flow turbulence associated with ID changes at depths in the completion where items such as down-hole safety valves (DHSVs) and gas-lift mandrels (GLMs) are installed [4]. At the North Island, 3D DAS-VSP data from six wells were simultaneously acquired with the ongoing OBN survey, and the cumulative shots within the blue dash line box in each well are 406,309 and cover a source area of 154 km2. At the Central Island, 3D DAS-VSP data from seven wells were simultaneously acquired, and the cumulative shots within the red dash line box in each well are 431,706 and cover a source area of 157 km2.
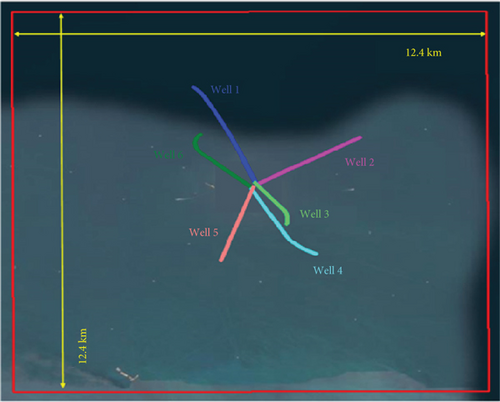
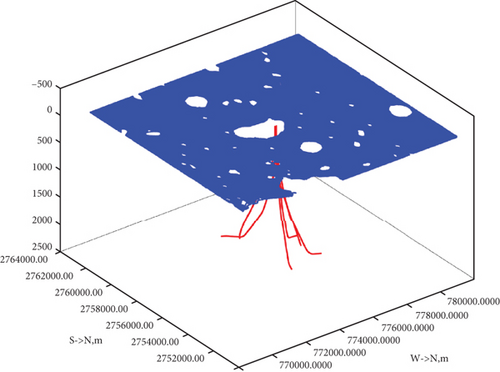
Three OBN vessels were utilized to deploy, retrieve, and download an inventory of ~18,000 OBNs to maintain a continuously available active spread of 15,080 stations on 40 live receiver lines, rolling on average 4 complete lines each day. At the same time, up to seven source vessels of differing configurations, a mixture of dual source and single source vessels, performed the seismic source operation using simultaneous shooting methodology to achieve the high productivity levels required. Multiple source vessels were permitted to operate simultaneously provided they maintained a minimum separation distance of 6 km, sometimes reduced to 4 km during periods of low productivity. Figure 1 shows the survey geometry of the joint high-density OBN and 3D DAS-VSP data acquisition project. It is the plane view of the well trajectory projection of the 6 wells in North Island and 7 wells in Central Island. Zipper 2 and Zipper 3 are the two OBN source sweeps around the North and Central Islands. Figure 2 is the survey geometry display of the 3D DAS-VSP data acquisition in North Island. The plane view of the well trajectory of the 6 wells in North Island is shown in Figure 2(a) and 3D view of the source distribution and the well trajectory of the 6 wells in North Island in Figure 2(b). The 3D DAS-VSP data have the downhole receiver spacing of 1 m, the sampling rate is 1 ms, and the record length of the 3D DAS-VSP data is 10 s. The original 3D DAS-VSP data were recorded continuously 24/7 in the field. Each OBN shot time and shot GPS coordinates were used to segment the continuously recorded 3D DAS-VSP data into a 10-s-long shot gather record. An expended abstract preprint of the joint OBN and 3D DAS-VSP data acquisition and preprocessing method has previously been published by IMAGE Annual Meeting [5].
3. 3D DAS-VSP Data Processing
Table 1 is the list of the 3D DAS-VSP data processing workflow, and there are three major 3D DAS-VSP data processing steps: (1) data QA/QC and signal processing, (2) velocity model building, and (3) FWI (full waveform inversion) and imaging.
| Processing steps | Processing functions |
|---|---|
| 1. Data QA/QC and signal processing |
|
| 2. Velocity model building |
|
| 3. FWI and imaging |
|
4. Key Data Processing Techniques
4.1. 3D DAS-VSP Data Deblending Processing
Since the high-density OBN data were acquired using multiple source boats at the same time, the simultaneously acquired 3D DAS-VSP data records have multiple shots in a 10-s-long record, we have to conduct the deblending processing on the 3D DAS-VSP raw data. The deblending processing of the blended acquired 3D DAS-VSP data is based on the sparse inversion method using all the shots within the source carpet.
In Equation (1), d is the blended source data simultaneously acquired, the effective major source signal without blending sources is represented by m, and the blending operator is Γ. The shooting time and position information of the blending sources was recorded by Γ.
- 1.
The pseudodeblending dataset is ΓHd, which comes from the simultaneously blended common receiver gather and the blending operator. Both the blending source noise and the effective major source signals are contained in the raw common receiver gathers.
- 2.
The pseudodeblending dataset needs to transform into FKK domain in order to count for the statistical maximum amplitude and to determine the function of threshold shrinkage.
- 3.
The function (ΓHΓ − I)m is used to predict the blending noise from the signal model.
- 4.
Through the subtraction of the blending noise from the pseudoseparated dataset, we can obtain the signal model with gradually improved signal-to-noise ratio.
- 5.
By the iteration of the shrink threshold of the signal model in the FKK domain, we can obtain Equation (3): mi+1 = F−1TτF[ΓHd − (ΓHΓ − I)mi].
- 6.
By repeating Steps 3–5 and reaching the maximum iteration numbers, we can separate the major source signal from the blended dataset with simultaneous sources using the sparse inversion method [10].
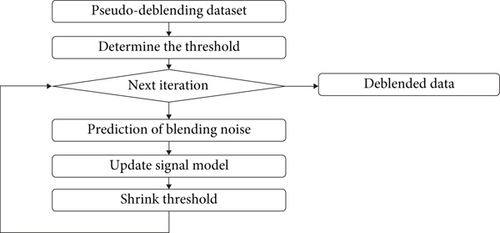
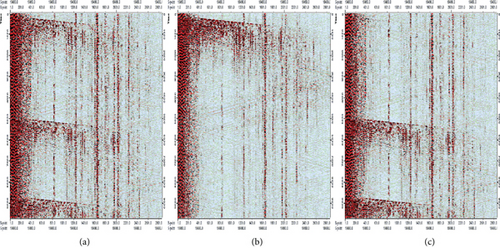
Figure 4 shows the 3D DAS-VSP data deblending processing results with before deblending (Figure 4(a)), after deblending (Figure 4(b)), and removed blending noise (Figure 4(c)).
4.2. Abnormal Amplitude Suppression
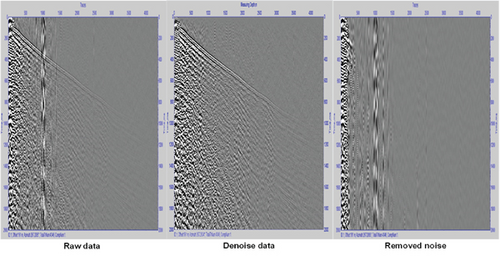
The abnormal amplitude suppression is used for surge noise attenuation. The surge noise is a type of noise caused by wind and waves and has the characteristics of low frequency (generally below 20 Hz) and large amplitude value. According to the idea of “multitrace identification and single-trace denoising” for the suppression of the surge noise, this technique automatically identifies the strong energy interference in seismic records in different frequency bands, determines the spatial position of noise, and suppresses it at the time-varying and space-varying domain according to the user-defined threshold and attenuation coefficient. The surge noise is suppressed in a time-varying and space-varying manner. The recognition parameter used in the calculation is the transverse weighted median of the data envelope. The frequency division processing method can improve the fidelity of denoising. This method is used to suppress the interference of strong energy sound waves and surface waves near the shot point. Processing in different frequency ranges in the time–space domain. First, the surge noise is automatically identified according to the suppression threshold value, and then, the noise energy is suppressed according to the attenuation factor. Figure 5 displays the results of abnormal amplitude suppression.
4.3. Velocity Model and Image Processing
For the 3D DAS-VSP data processing workflow, there are three major data processing steps: (1) data QA/QC and signal processing, (2) velocity model building, and (3) imaging. Apart from the conventional processing steps of 3D DAS-VSP data, the deblending processing of the multiwell blended acquired 3D DAS-VSP data using multiple airgun sources, special ringing noise removal procedure, joint domain full waveform inversion (JDFWI) for velocity model update, and one-way wave equation multiple migration (OWEMM) method were used to generate final imaging.
4.3.1. VSP First Break Tomography Modeling
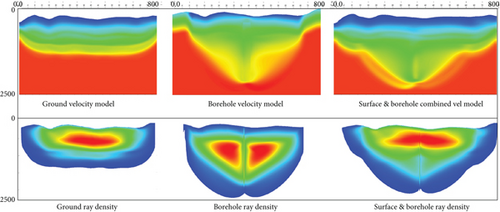
Conventional 3D VSP data first break tomography modeling has some problems, such as insufficient near surface ray coverage, low shallow inversion accuracy, and poor shot point static correction effect. How to increase the number of near surface coverage and improve the inversion accuracy and shot point static correction quality is the key problem that must be solved for 3D VSP data high-quality imaging. In view of the particularity of the 3D DAS-VSP data, the DAS-VSP Fresnel first break tomography technique is developed to improve the uniformity of VSP first break path coverage and increase the stability of inversion solution. The technique utilizes the characteristics of the development and dense arrangement of direct waves in the vertical direction at the first break of the 3D DAS-VSP data and the characteristics of uniform distribution in the lateral direction and high precision of the gyratory wave at the first break of the surface. It fully combines the advantages of the two types of data and establishes a joint objective function for tomographic inversion, thereby improving the accuracy of the shallow, medium, and deep velocity models. A synthetic VSP survey model was built using 2001 shots on the surface with 12.5 m shot spacing and 241 downhole geophones with the spacing of 12.5 m from 200 to 3200 m depth. The specific first break tomographic modeling implementation process and the comparison of surface seismic data alone, borehole seismic data alone, and borehole–surface seismic data combined Fresnel tomography inversion results are shown in Figure 6.
4.3.2. VSP FWI
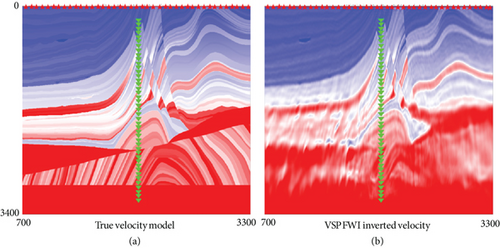
We have extended our proprietary FWI to process VSP data, which takes advantages of both refractions and reflections to invert a high-resolution velocity model. The wave propagation engine of FWI is acoustic, adapting to isotropic, VTI, TTI, and orthorhombic anisotropy media and with Q compensation. Instead of inverting velocity, FWI could also be used to generate high-frequency velocity and impedance perturbation data and provide broadband imaging products. Figure 7 shows the true velocity model (Figure 7(a)) and VSP FWI inverted velocity model using forward modeling VSP data [7, 8].
4.3.3. JDFWI
The client provided a vintage 3D velocity model from an early OBC survey covering the 3D DAS-VSP data area for us to build the initial 3D velocity model for the 3D DAS-VSP data migration. The JDFWI was used to calibrate and update the initial 3D velocity model for the 3D DAS-VSP data migration.
Extracting the travel time information of field data lies at the heart of the velocity model building and the application of FWI. Most of the FWI methods are formulated in the conventional data domain only, and their success relies on the extraction of the travel time misfit between the field and synthetic data which may not be trivial when the geology is complicated. We proposed an alternative method based on the delay time common image gather (DTCIG) to directly measure the travel time inaccuracy in the model domain, which is intuitive in applications and more sensitive to the velocity inaccuracy. Combining our model-domain velocity inaccuracy measure with the conventional data misfit, we derive the formulation of a JDFWI which minimizes the travel time misfit in both data and model domains. Compared to a conventional FWI, applications to both synthetic and field data demonstrate that the proposed JDFWI method can overcome the cycle-skipping issue with the new model domain travel time misfit term while still retrieving high-resolution complex velocity models.
Comparing to an initial vintage 3D velocity model from an early OBC survey in Figure 8(a), using the JDFWI inverted velocity in Figure 8(b) has the diving wave energy focused at the zero-lag delay time at all the penetrated depths. This confirms the quality of the proposed JDFWI inversion statistically [13].
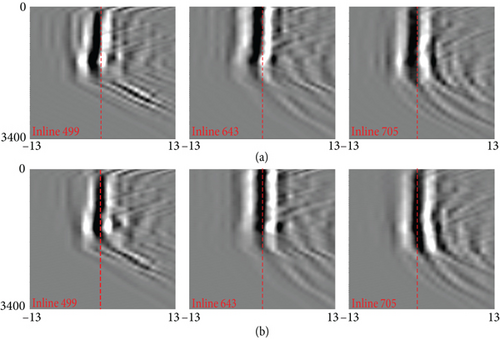
With this observation, to overcome the long-standing cycle-skipping issue, travel time misfit in the model domain could be an important addition to our conventional data driven FWI Objective Function (6). Following the computational cost and velocity sensitivity reported in Sava and Fomel [11], we employ the DTCIGs to form our JDFWI.
The initial velocity model is from a legacy OBC seismic data acquired between 2000 and 2002. The survey extends over a shallow water zone, where the water depth ranges from 5 to 35 m. The wide azimuth 3D acquisition encompassed a 1500 km2 area using a patch design of six receiver lines with initially two receiver lines rolled in the crossline direction (6R2) followed by the slight modification to design of 6 roll 6 (6R6), yielding data of 300 nominal fold with a maximum offset of 5000 m. The seismic data input to the PreSDM processing were 5D regularized and interpolated, in common offset vector domain (COV), which increased the fold to 1825. This gave a maximum offset-x and offset-y distance of 3600 m and a rich azimuth distribution that should enable accurate velocity model building for depth imaging.
The data were processed in 2017 with time imaging. Although improvements were observed compared to the legacy 2002 processing, some major challenges were still unresolved. The data were still heavily contaminated by medium and long period free surface-related multiples and short period interbed multiples. Additionally, the signal-to-noise ratio and resolution were low. Finally, structural distortion was evident, and the seismic-to-well correlation was poor. FWI initial model is from legacy OBC seismic data reprocessing PSDM which utilized transit times from a legacy multiazimuthal Walkaway VSP in PSDM model building iterations [14].
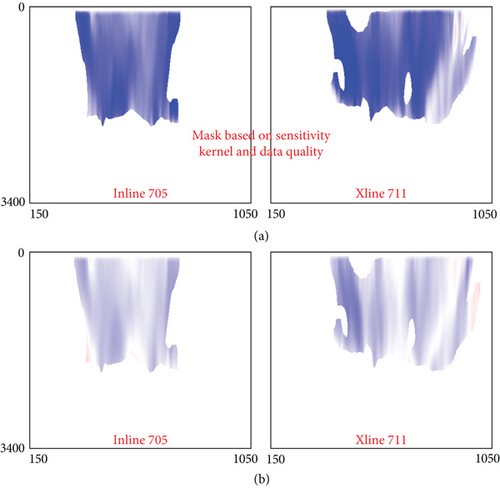
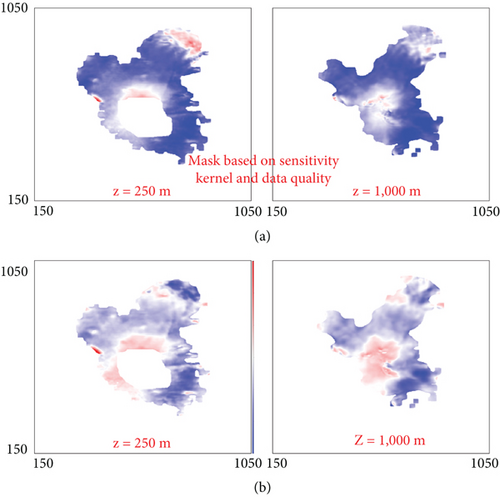
The field is mature, with hundreds of wells. There is a large anticline in the east side of the survey, while the structure in the west is generally flat. The porous local carbonate lithology leads to fast compressional wave velocity and variable anisotropy. In addition, strong reflection coefficients between thin geological layers result in a large number of multiple generators. Figure 9 shows the delay time from legacy velocity model on inline 705 and xline 711 (Figure 9(a)) and delay time from FWI model on the same lines (Figure 9(b)), and Figure 10 is the delay time from legacy model on Z = 250 m and Z = 1000 m (Figure 10(a)) and delay time from FWI model on the same depths (Figure 10(b)). As one can see, the velocity model has been significantly improved in Figures 9(b) and 10(b) by the update using the JDFWI method.
We have extended our proprietary FWI to VSP data, mainly using refracted waves for the update of velocity and anisotropic models. As shown in Figure 11, the initial velocity and anisotropic models are obtained by processing the OBC data acquired in this region with ultrashallow water environment, where the water depth is in the range of 6~26 m. In ultrashallow water environment, wavelet inversion and multiple prediction are very challenging. Additionally, the ghost wave results in a strong attenuation of the lowest frequencies, and the signal recorded by downhole fiber optics has low SNR. Therefore, it is difficult to directly use conventional FWI for DAS-VSP data.
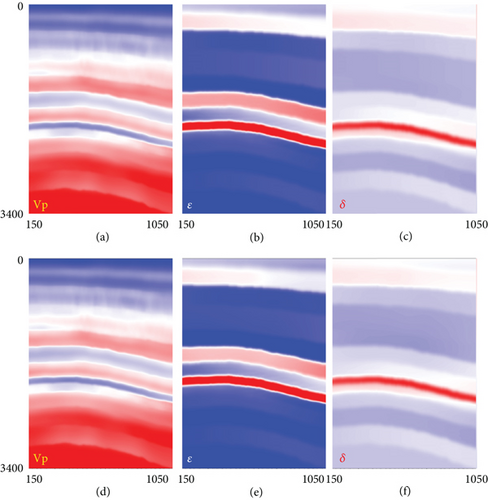
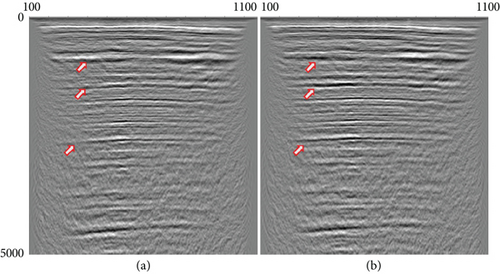
We used a JDFWI method [13] to update the velocity model by minimizing the travel time residual extracted in both the data domain and image domain. The result of JDFWI is shown in Figure 12. Compared with traditional FWI methods, the JDFWI method can effectively overcome the cycle skipping caused by poor initial velocity models or missing low-frequency data. The results of multiple imaging (Figure 12) show that the updated anisotropic model enhances imaging focus and improves imaging quality.
4.3.4. Joint Migration of Upgoing Waves, Downgoing Waves, and Surface Multiples
In marine seismic exploration, conventional migration algorithms based on primary reflections often have poor angular illumination, especially in shallow subsurface areas and complex salt boundaries. Source density is the primary controller of angular illumination. It is well known that source density is relatively sparse in a typical marine seismic acquisition, such as in a towed streamer survey. In contrast, imaging of multiples treats each receiver as a virtual source, mimicking a high-density source survey. Imaging of multiples can provide additional angular illumination and help to improve subsurface imaging. The extra illumination provided by multiple reflections enhances angle-domain common-image gathers (ADCIGs). But multiple imaging also introduces crosstalk artifacts, because the raw observed shot gathers (including primary and multiples) are injected as source during the forward simulation. A deconvolution imaging condition (DIC) was proposed by Lu et al. [15] to reduce crosstalk, but it cannot solve the issue of illumination imbalances and causes instability in null space [16].
On the contrary, least-squares migration can not only reduce the crosstalk by using migration/demigration operators iteratively to update the reflectivity model [17–19] but also is more stable than DIC as no stabilizer is needed. Most solvers of least-squares migration require the migration operator to be the exact adjoint of the forward-modeling operator, rather than the inverse of the modeling operator. The DIC requires modifying the modeling operator and some data preprocessing [15]. To avoid these complexities, we use the solver of first-order steepest descent while preconditioning gradient via DIC. Synthetic and real DAS-VSP examples illustrate the effectiveness of our method, even without using complex optimizers.
With the linear modeling operator and its corresponding adjoint operator, then we can solve the problem of least-squares migration via various linear optimization solvers. For example, quadratic solvers like LSQR can improve the convergence rate. However, most of these solvers require dot product tests to ensure the adjoint property of the modeling and migration operators. This makes it difficult to integrate a prior geophysical knowledge into the gradient calculation, as any adjustments to the migration operators can damage the adjoint relationships between the modeling and migration operators, which then make the linear solvers ineffective.
According to the adjoint relationship, the cross-correlation imaging condition (CCIC) must be used for gradient computation. However, with CCIC, the spectrum of gradient will be shaped by the wavelet’s spectrum from both receiver data (for backward wavefield) and source data (for forward wavefield). Early works [17, 19] suggest that least-squares migrations can eliminate the footprint of wavelet’s spectrum. However, its effectiveness might diminish with a limited number of iterations, especially for noisy datasets or weak target horizon.
To improve the convergence, we employ the DIC, which normalizes the gradient using the l2 norm square of the background wavefield U(ω) at each frequency. The DIC acts as a preconditioner for the migration operator, reducing the influence of the source signature in the input data. This strategy resembles applying the inverse of an approximate Hessian to the gradient. As a result, we adopt the steepest descent method with modified gradients, which improve convergence rate without requiring the exact adjoint relationship of the modeling operator and migration operator.
In the conventional VSP imaging, usually only the upgoing waves (left of Figure 13) are used in the traditional migration algorithm, and thus, only the area near the well trajectory is well imaged. For offshore VSP data, the velocity and anisotropic models can be mirrored along the sea surface, and then, the mirror migration algorithm can be used to image downgoing waves (middle of Figure 13). The resulting imaging range is much broader than that obtained by migrating upgoing. By imaging the multiple of offshore VSP data, much broader area can be imaged (right of Figure 13), which is detailed below.
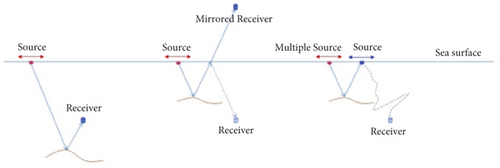
The surface multiples can carry on the information about subsurface reflectivity, which often complements the reflectivity information contained in primary reflections. Generally, both surface multiple migration and primary migration can image subsurface structures to obtain approximate subsurface reflectivity models. Compared with conventional migration using upgoing wave and mirror migration using downgoing wave, multiple migration can image much wider area away from the well, since all surface shot points are treated as virtual receiver, mimicking a survey with high-density and wider receiver distribution. Moreover, multiple imaging can address the issue of acquisition footprint and significantly improve the quality of shallow imaging, especially in offshore area with shallow water.
The one-way wave equation was used for wavefield modeling, based on the following two reasons: (1) Compared with the two-way propagator, the one-way propagator is much more efficient and thus we can use much higher frequencies without increasing the total computational cost. (2) By using the one-way propagator, the crosstalks with internal multiples and large angle refraction waves can be avoided.
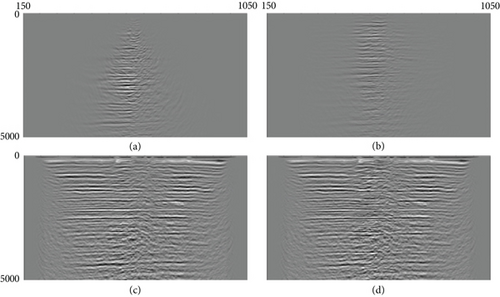
We migrated upgoing waves with normal VSP migration, downgoing waves using mirror migration, and surface multiples using multiple migration. Then, we merged the three images to improve the overall imaging resolution with broader illumination. Figure 14 shows the conventional migration of upgoing wave (Figure 14(a)), mirror migration of downgoing wave (Figure 14(b)), and surface multiple migration (Figure 14(c)) along one of main survey lines. Figure 14(d) is the image obtained by the merging of the upgoing wave, downgoing wave, and surface multiple migration images. Due to imaging using surface multiples of VSP data, the imaging area is significantly extended. Compared with the result using only surface multiples shown in Figure 14(c), the joint migration partially compensates for the imaging blind spots near the well caused by data acquisition limitations in the North Island.
We have developed the surface multiple migration and least-squares multiple migration technologies using the one-way wave equation as the wave propagator. Numerical experiments demonstrate that even with DICs, multiple imaging still exhibits crosstalk noise. However, least-squares multiple migration can successfully eliminate crosstalk artifacts. Finally, we applied the surface multiple migration to the 3D DAS-VSP data from six wells on the North Island and seven wells on the Central Island.
4.3.5. OWEMM
The surface-related multiple imaging can enhance signal quality, offering improved convergence and angle information versus standard primary imaging [16]. Yet, it is complex due to crosstalk noise from receiver data-driven forward wavefield [15] found a DIC to limit crosstalk. Still, it cannot fix illumination issues from acquisition geometry, also causing instability in null space [16].
In contrast, least-squares migration works better, iteratively using migration/demigration operators to lessen crosstalk [17–19]. It is more stable than DIC as no stabilizer is needed for operator evaluation. Most solvers need adjoint link between forward/adjoint operators. DIC in migration needs modeling operator change, requiring data preprocessing [15]. To avoid these complexities, we use the first-order steepest descent with DIC for gradient preconditioning. Synthetic and real DAS-VSP examples prove our method’s feasibility even without complex optimizations.
The one-way wave propagator was used for our least-squares migration due to two main advantages over the two-way kernel. Firstly, the one-way kernel is notably more efficient, enabling us to reach ultrahigh frequencies. Secondly, it avoids imaging crosstalk from internal multiples and high-angle refraction waves. These factors are particularly beneficial when aiming for precise imaging in a more accurate velocity model. This leads us to adopt the monochromatic one-way–based surface-related multiple modeling operator.
Having the linear modeling operator and its adjoint in hand, one can address the least-squares migration challenge through diverse linear optimization solvers. For example, quadratic solvers like LSQR enhance convergence rates. However, most of these solvers require an adjoint test to align the migration operator and its adjoint. This poses a challenge when integrating geophysical prior knowledge, such as gradient preconditioning, as adjustments to the operators can disrupt their adjoint relationships, rendering linear solvers ineffective. To overcome this obstacle, we adopt the gradient descent method for solving the least-squares migration problem. This technique incorporates the DIC within the migration operator, enhancing convergence behavior.
Adhering to the adjoint relationship for linear operator inversion, the migration operator in equation must employ the CCIC for gradient computation. However, this introduces the wavelet spectrum from both input and source data into the gradient spectrum. Prior works [17, 18] suggest that least-squares migrations ideally eliminate this wavelet spectrum. Yet, this effectiveness might diminish with a limited iteration count, particularly for faint target events or when handling noisy datasets.
4.3.6. Least-Squares Multiple Imaging
The marine seismic data contain subsurface reflectivity information and multiple reflections and often influence the primary reflections. The general inversion method of the LSJIMP (least-squares joint imaging of multiples and primaries) can be used to simultaneously combine pegleg multiples and primaries and suppress crosstalk noise in the prestack processing. Normally, the LSJIMP is compatible with many different prestack imaging methods. We can extend the LSJIMP to image jointly the primary reflections and other embedded waves or converted wave modes [20]. The multiple energy was used by the joint LSRTM as signal and can also remove the crosstalk in the migration image. The two-way propagator can be used to image the multiply scattered events through the modeling and migration. The multiply scattered events will be scattered off from the sharp interfaces in the sea surface and the migration velocity.
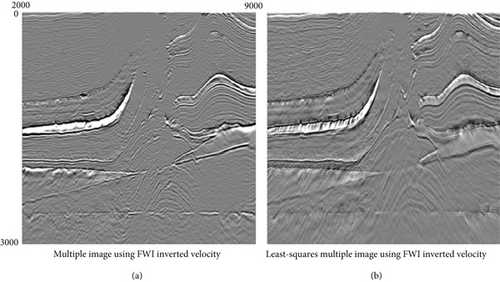
The multiple imaging and least-squares multiple imaging techniques using one-way wave equation as the wave propagation engine were developed to image marine seismic data. Numerical experiments show that, even with the DIC, crosstalk noise still appears in the multiple images. However, least-squares multiple migration successfully removes the crosstalk artifacts (Figure 15) and provides high-quality broadband multiple images (Figure 16).

To enhance convergence, we employ the DIC, which normalizes the gradient using the l2 norm square of the background wavefield U(w) at each frequency. The DIC acts as a preconditioner for the migration operator, reducing the influence of the source signature in the input data. This strategy resembles an approximate Hessian inversion applied to the gradient. Consequently, we adopt the steepest descent method with modified gradients, achieving improved convergence behavior without necessitating an exact adjoint relationship of the operators.
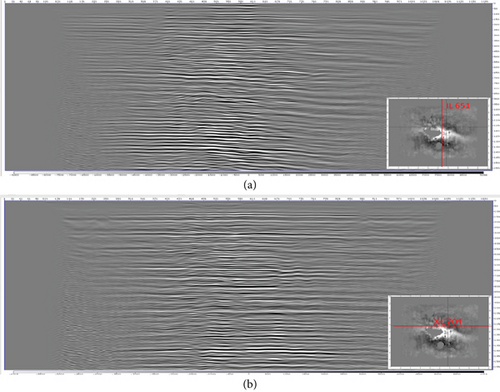
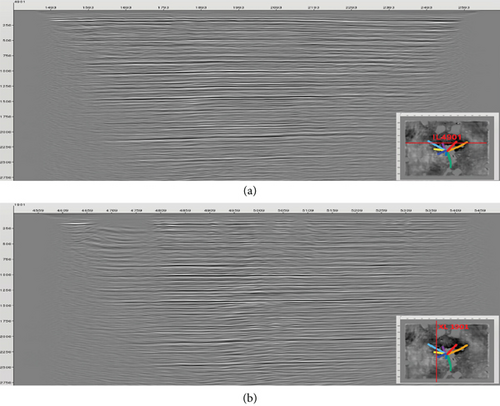
We have developed multiple imaging and least-squares multiple imaging techniques for VSP data using one-way wave equation as the wave propagation engine. Numerical experiments show that, even with the DIC, crosstalk noise still appears in the multiple images. However, least-squares multiple migration successfully removes the crosstalk artifacts and provides final high-quality broadband multiple migration imaging results as shown in Figure 17 (North Island) and Figure 18 (Central Island).
5. Conclusions
DAS is increasingly recognized as a viable alternative to geophone arrays for the acquisition of borehole seismic or DAS-VSP data. The imaging processing of the world’s largest multiwell 3D DAS-VSP dataset provided us with unique opportunities and challenges. In summary, our study yields three key findings. Firstly, surface-related migration significantly enhances imaging coverage area, particularly in shallow regions. Secondly, the application of least-squares inversion elevates result quality by eliminating the source signature, alleviating multiple crosstalk, and addressing illumination imbalances. Lastly, the DIC serves as a valuable preconditioner for the migration operator, leading to improved convergence behavior with the first-order optimization approach. The JDFWI technique has successfully improved and updated the legacy velocity model, and the OWEMM method has been employed for imaging the 3D DAS-VSP data.
Conflicts of Interest
The authors declare no conflicts of interest.
Funding
We would like to thank ADNOC for the funding of the Offshore ADNOC 3D OBN survey project; fundings are also from BGP research project Onshore 3D DAS-VSP Imaging Method and Field Data Test (06-04-2022) and CNPC research project Research on Multi-Physics High-Precision Oil and Gas Geophysical Exploration Technology and Equipment (2023ZZ05).
Acknowledgments
The authors wish to thank the ADNOC, BGP, and Optical Science and Technology (Chengdu) Ltd. for the permission to publish the paper and the support of BGP’s research project “Onshore 3D DAS-VSP Imaging Method and Field Data Test (06-04-2022),” CNPC research project “Research on Multi-Physics High-Precision Oil and Gas Geophysical Exploration Technology and Equipment” (2023ZZ05). The reference expanded abstract [6, 7] is also acknowledged.
Open Research
Data Availability Statement
Data associated with this project are confidential to ADNOC and cannot be released.


