Evaluation of the Morphology and Corrosion Behavior of Zn-Based Coatings Deposited on Low Carbon Steel Using a Sustainable Energy Source
Abstract
Green energy sources offer a significant opportunity to make metallurgical processes more sustainable. In this regard, concentrated solar energy can be used to modify metallic surfaces. In this study, a Zn-22Al-2Cu coating was applied to an A36 steel substrate using a Fresnel lens. The coating was formed through the addition of 5–15 layers of powder alloy over the steel substrate. The coating is composed of η-zinc-rich phases and zinc oxides. The compactness and porosity depend on the amount of layers used. The adhesion of the coating is in the range of 2.5–4.5 MPa. Electrochemical tests indicate that the coating promotes the formation of a protective layer. This behavior is in accordance with the time constants determined by electrochemical impedance spectroscopy which show the presence of two time constants for the coated samples, indicating the protective response of the corrosion products. Then, the addition of 15 layers of Zn-based alloy powder demonstrates the most optimal performance, as it promotes the formation of a compact layer that properly covers the substrate surface, increasing adhesion and corrosion resistance. The corrosion products were zinc oxides, hydrozincite, and iron corrosion products for the coated and blank samples, respectively.
Summary
- •
The application of a metallic Zn-based coating was performed using concentrated solar energy.
- •
The low melting point of the coating allows for increasing the homogeneity of the coating.
- •
As more Zn powder layers were added, the anticorrosion properties of the coating increase.
- •
The adherence of the coating increases as more layers are added.
- •
The polarization resistance was 9-fold for the addition of 15 Zn powder layers.
1. Introduction
The use of renewable energies and less polluting energy sources has been increasing in recent years with the intent to reduce the greenhouse gas emissions. This increase in efforts is due to alarming situations such as the global concentration of CO2, which reached a detected level of 414 ppm in 2021 [1]. In addition, the use of renewable energy sources can help to protect nature and safeguard human health. As a result, various industries are trying to reduce their contribution of CO2 emissions by changing the use of fossil fuels in their processes and considering other green alternatives for their applications.
Renewable energy sources refer to various alternatives for energy production, including biofuel, biomass, geothermal, solar energy, and power systems based on the wave movements and wind or water fluxes. Among these, solar energy has gained significant interest from the academic, industrial, and government sectors due to its sustainability and efficiency in next-generation energy production [2]. Solar energy is primarily used for thermal or electric energy, but properly concentrated solar energy (CSE) can reach temperatures as high as 3000°C. This makes it a competitive alternative to high-emission energy systems such as lasers or plasma, which could even melt ceramics. [3]. Since, concentrated solar power can provide a localized high-energy beam, it can be applied in additive manufacturing (AM) technologies. This concept has been explored by several authors since the AM of a lunar regolith [4] printed circuits [5] or polymer using a solar-driven powder-bed fusion [6].
In the case of cladding processes, Ferriere et al. found that solar furnaces are more efficient than lasers with an efficiency of 70% and 2%, respectively [7]. Solar energy is a free, unlimited, and clean energy source, making it advantageous over other technologies that require the use of fuels or other energy sources to generate high-temperature heat.
These characteristics make it suitable to apply CSE in the fields of metallurgy and surface engineering. The earliest documented applications of CSE date back to the 17th and 18th centuries with the works of Tschirnhaus, Cassini and Lavoisier, during which they melted iron and laid the foundations for gas nitriding solar processes [3]. Currently, CSE is being studied for use in extractive metallurgy processes [8], as well as for transforming Al to reduce energy costs by 40% [9], thermal dissociation of Zn [10], purification of Si [11] with a higher efficiency, and reduction of iron ores [12]. The use of solar energy in the sintering of Ti is a promising field that can help reduce global warming [13]. Romero et al. [14] reported the viability of sintering of powder metallurgy chromium-alloyed steels, demonstrating complete densification after 15 min of holding time. CSE can be used in the joining process of aluminum and steel as reported in [15, 16]. The nitriding processes have been successfully applied to Ti, V or Nb in an argon atmosphere, with lower heating times than those required by conventional heating devices [17].
Although there are promising features and several studies in the literature about the application of CSE in the metallurgy field, few works deal with the application of coatings on metallic surfaces. In this regard, Pantelis et al. [18] explored the use of CSE for the application of Mo coatings on 304 L stainless steel. In their work, they covered the steel surface with a 1 mm thick layer of Mo-rich powder alloy and heated it to 1300°C using a solar beam for 3–6 min. The homogeneity of the coating was found to be affected by the holding time. Another study by Yu et al. [19] evaluated the application of tungsten carbide coatings using CSE. The authors demonstrate that this technology is capable of melting tungsten carbide powders (which have a melting point of 2870°C) onto the surface of nodular cast iron, resulting in a well-adhered coating with hardness values ranging from 800 to 1000 HV0.2, increasing the wear properties of the base metal.
The use of solar energy is a promising sustainable energy source in the materials science and surface engineering field. However, current efforts have focused on processing materials and forming hard coatings to increase the hardness and wear resistance of the treated metals. The feasibility of applying CSE for the formation of corrosion-resistant coatings has been overlooked.
Corrosion is a significant factor in the degradation and loss of properties, decreasing the lifespan of metallic objects. Also, it is a constant problem with regard to the higher extent of metallic materials exposed to corrosive atmospheres [20, 21]. Corrosion is the electrochemical phenomenon responsible for the destruction of approximately 25%–33% of steel production in service. To replace corroded infrastructure, a portion of the annually produced steel must be used, resulting in a CO2 emission of 560–1200 MtCO2. Without action, by 2030, the amount of CO2 emitted to the environment just to replace the corroded infrastructure will account for 4.1%–9.1% of the total CO2 emissions. It is important to enhance the corrosion resistance of metals to promote sustainable steel production [22]. One of the primary methods for protecting steels is through hot-dip galvanization. This process involves submerging metallic samples in a molten zinc bath at 450°C, which allows for the formation of a zinc-based layer that protects the metallic substrate by creating a protective corrosion product layer. The production of Zn has three times the environmental impact of steel production. The galvanization sector faces challenges in reducing its environmental impact due to its intensive energy use [23].
The main objective of this study is to deposit Zn-22Al-2Cu coatings on a steel substrate using CSE through a Fresnel lens to improve the corrosion resistance of the metal substrate. Different amounts of powder layers were added to determine their effect on the corrosion behavior of the samples. The results indicate that the application of Zn-based coatings using CSE is feasible and promotes the formation of a well-adhered, dense and homogeneous coating layer leading to a significant increase in the corrosion resistance of the steel substrate.
2. Materials and Methods
2.1. Deposition of the Coatings
Commercially available A36 steel was cut into 2.5 × 2.5 cm2 square sections using a water jet cutting machine. The resulting samples were mechanically ground with sandpaper ranging from grade 120 to 1000. Later, the samples were degreased using an ultrasonic bath and ethanol, rinsed with distilled water, and kept in a desiccator until the coating was applied.
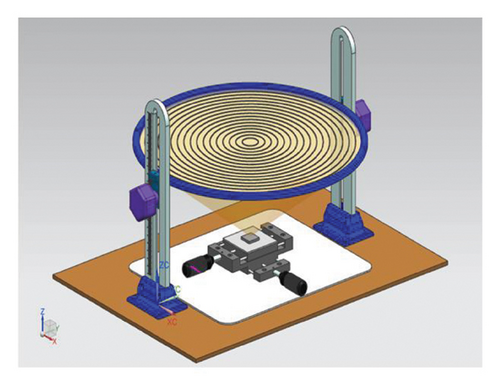
The coating deposition process used a lab-made 3D printed device, as schematically shown in Figure 1(a). The equipment employed a commercially available Fresnel lens with a focus length of 22 cm and a surface collecting area of 490 cm2 to concentrate energy over a sample mounted in an XYZ positioning mechanism. The coating was applied using the powder of Zn-22Al-2Cu alloy with an elliptical geometry and particle size of 161 μm in the major axis and 62 μm in the minor axis. To obtain the powder alloy, the metal burr that remains as the waste of the manufacturing process (drilling or milling) of the Zn-22Al-2Cu parts was mechanically ground using a ball mill (XQM-2L) with a 10:1 balls/load ratio at 30 rpm during 20 h.
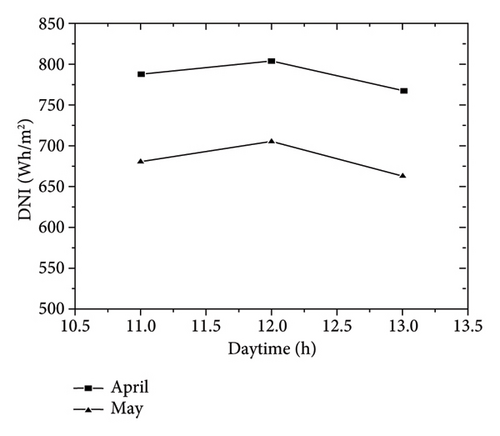
To deposit the coating, 0.5 g of alloy powder was added carefully with a blade to cover the sample surface. The tests were carried out at 19.39° N and 98.98° W and were performed between 11 a.m. and 13 p.m. reaching a direct normal irradiation (DNI) between 663 and 806 Wh/m2, as shown in Figure 1(b) [24].
The CSE was focused on the sample and the surface was scanned with the concentrated energy until all the powder was melted. Then, another layer of alloy powder was added to the sample surface and the procedure was repeated until 5, 10, and 15 layers of powder were deposited. The time between each layer addition was approximately 4 min. This time was determined experimentally to obtain the best characteristics of the coating appearance. The coatings were applied in natural atmospheric conditions. To determine thickness, samples were embedded in epoxy resin, cross-sectioned, mechanically ground, and polished with 0.1 μm alumina.
2.2. Characterization of the Coatings
The ultra-high resolution scanning electron microscope FE-SEM JSM-7800F coupled to an EDS device (JEOL) was used to observe the transversal section of the formed coatings. The crystalline phases were determined using XRD diffraction in the equipment Rigaku Ultima IV with a copper target (wavelength = 0.1540 nm) from 2θ = 20° to 2θ = 80°. The adhesion of the coatings was assessed using an Elcometer 106 pull-off adhesion tester.
2.3. Electrochemical Tests
The electrochemical characterization was performed using a potentiostat/galvanostat Autolab PGSTAT 205. The electrode cell was configured in the classical three-electrode arrangement, with a calomel-saturated electrode as the reference electrode (REF), a large graphite sheet (4.5 cm2) as the counter electrode (CE), and the coated sample as the working electrode (WE). The electrolyte used was a 3.5% NaCl solution (pH = 7) at room conditions. For the potentiodynamic polarization curves (CP), the samples were immersed for 30 min to allow for stabilization. Afterward, the potential was swept in a positive-going scan with a scan rate of 1 mV/s. For electrochemical impedance spectroscopy (EIS) analysis, a sinusoidal perturbation of 10 mVrms was applied. The frequency was then swept from 105 Hz to 10−2 Hz acquiring 10 points per decade. The results were validated using Kramers–Kronig analysis. The electrochemical tests were performed at room conditions and in a naturally aerated electrolyte. The experiments were replicated at least three times to ensure repeatability.
2.4. Characterization of the Corrosion Products
The morphology and elemental composition of the corrosion products formed were characterized using the FE-SEM JSM-7800F, as previously described. The crystalline phases of the corrosion product were determined using an XRD diffractometer Rigaku Ultima IV. In addition, the composition was determined using FTIR analysis with the equipment Bruker Vertex 70v.
3. Results and Discussion
3.1. Morphology and Composition of the Coatings
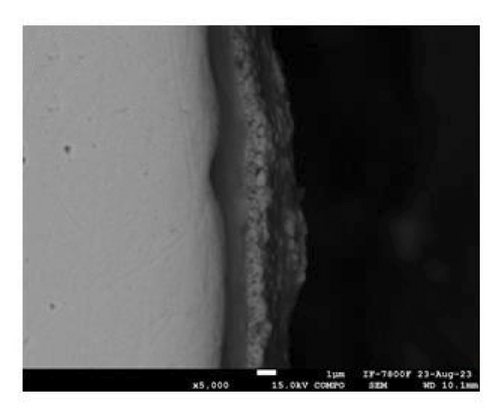
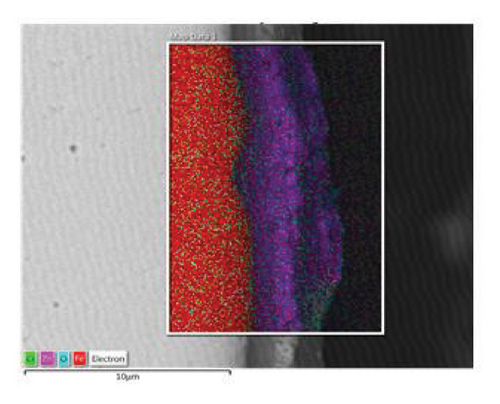
Figure 2 shows the microstructure of the samples obtained after depositing 10 and 15 layers. The coating with 10 deposited layers (Figure 2(a)) indicates that the protective layer adheres well to the steel metallic substrate. However, the coating appears porous with cracks along the surface. In addition, some spheroidal particles are visible, indicating that the alloy powder was not completely fused, resulting in a porous structure. As the number of powder layers increases, Figure 2(c), the coating shows a more compact appearance with a well-fused region and a minimum amount of volumetric defects at the interface with the metallic substrate. A porous structure is observed in the upper region. To shed light on the chemical composition of the coatings, an EDS mapping was performed, Figures 2(b) and 2(d). The coatings are mainly composed of zinc- and aluminum-rich phases. This statement agrees with the Zn–Al phase diagram [25] and Zinalco composition [26], which indicate the presence of an α-Al-rich phase and η Zn-rich phase when cooled to 275°C. The presence of oxygen is related to the formation processes in which the coatings were deposited under open atmospheric conditions. This oxygen contributes to the formation of aluminum oxides, which enhances the corrosion resistance of the samples. The distribution of elements in the mapping shows that adding layers does not promote segregation or preferential distribution of elements. Instead, the zinc is homogeneously distributed along the surface. The microstructural aspects of the coatings provide information about the formation processes of the coatings and their expected corrosion performance. As more layers are added, the coatings become more compact. This is because the metallic substrate was heated for longer periods of time, allowing the Zn-22Al-2Cu alloy powder to melt properly. This resulted in a more compact microstructure with lower porosity, which can act as an effective barrier layer.
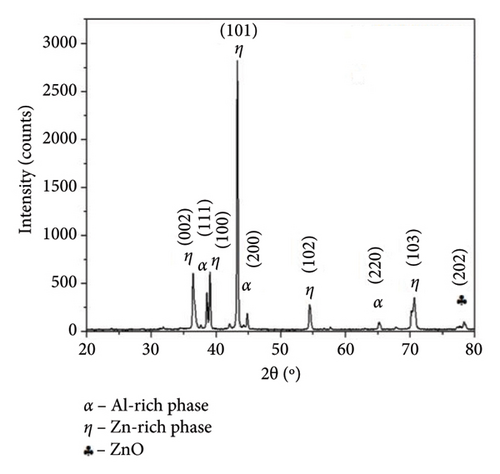
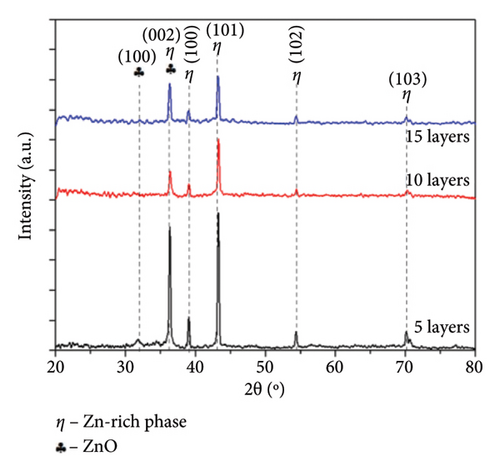
To identify the crystalline phases, the samples were characterized by XRD analyses. Figure 3 shows the diffraction pattern obtained for the Zn-22Al-2Cu raw powder and the coated samples with different amounts of deposited layers. The XRD of the powder, shown in Figure 3(a), displays peaks of varying intensities that correspond to the diffraction of the detected crystalline phases. The peaks observed at 36°, 38°, 43°, 54° and 70° correspond to η (zinc-rich solid solution) crystalline phases (PDF # 01-071-3764). In addition, the peaks at 38°, 44° and 65° correspond to an α-Al solid solution (PDF # 01-071-4624), while the peak at 78° indicates the presence of ZnO (PDF # 01-00–2551). The detected crystalline phases indicate the formation of a rich aluminum phase and the zinc-rich phase, which is in concordance with the microstructure observed in the Zn–Al phase diagram. Ares et al. [27] also indicate the presence of a β-Zn crystalline phase formed below 275°C. Figure 3(b) shows the XRD pattern of the coatings, indicating the presence of eta zinc-rich phases and zinc oxides. The α-aluminum-rich phase, which was present in the powder, was not detected after the coating was formed. It is important to note that despite the number of added layers, the coatings are mainly composed of Zn-rich crystalline phases, and there is no evidence of the formation of intermetallic compounds. This behavior suggests that the short processing time required for CSE coating formation does not allow for the diffusion of metallic components. Michalik et al. reported that melted Zn-22Al-3Cu showed the presence of Cu-rich phases related to the formation of the intermetallic compounds Cu–Zn [28]. The formation of the IMC Cu–Zn was also reported [29]; however, it was not detected in our study. The crystalline phases obtained through XRD are consistent with the microstructure already discussed.
3.2. Adhesion of the Coating
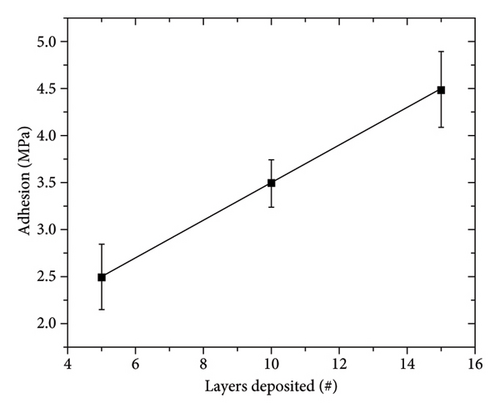
The adhesion of the coatings was tested using the pull-off test, Figure 4. This method applies a homogeneously distributed tensile stress on the entire surface. The results indicate that as the number of layers increases, the stress required for coating delamination also increases. The behavior observed is related to the porosity of the coating, as shown in Figure 2. The porous layer allows for the formation of cracks due to the coalescence of porosities, which reduces the surface area where the tensile stress is distributed. As the number of layers increases, the porosity decreases. On the other hand, the coating with 15 layers is more compact and exhibits higher adhesion strength. However, the adhesion obtained for the Zn-22Al-2Cu coatings applied using CSE (2.5–4.5 MPa) is lower than that obtained for commercial galvanized steels (12–16 MPa) [30]. This behavior is attributed to the rapid formation of the coatings formed using CSE, which does not allow the formation of diffusive layers of Fe–Zn, thereby decreasing the adhesion to the substrate.
3.3. Corrosion Behavior of the Coated Samples
3.3.1. Potentiodynamic Polarization Test
| Sample | Ecorr (mV) | Icorr (A/cm2) | Ba (mV/dec) | Bc (mV/dec) | Rp∗ (Ω/cm2) |
|---|---|---|---|---|---|
| Blank | −531 | 9.75 × 10⁻⁶ | 240 | 338 | 6260 |
| 5 layers | −1023 | 2.88 × 10⁻⁵ | 343 | 139 | 1490 |
| 10 layers | −1072 | 4.74 × 10⁻⁵ | 248 | 146 | 843 |
| 15 layers | −1004 | 1.77 × 10⁻⁵ | 12 | 86 | 2586 |
- ∗The polarization resistance Rpol was obtained using the Stern–Geary equation [31].
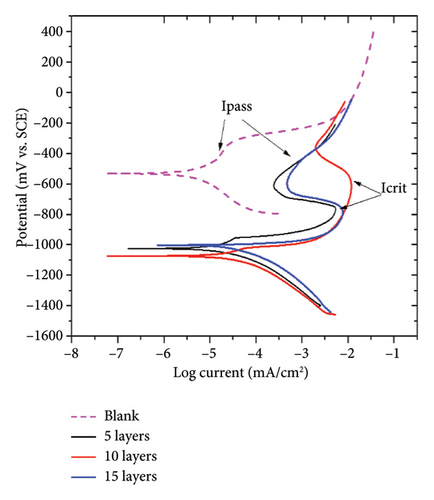
Table 1 shows that the kinetics of the corrosion reactions are modified by the increase of layer amounts, as evidenced by the decrease in slope values with the addition of more layers. The cathodic mechanism prevails and is higher than the anodic dissolution mechanism, suggesting the cathodic action mechanism of the applied coating [35]. On the other hand, Mansfeld et al. [36] indicate a direct relationship between the anodic and cathodic Tafel slopes and the corrosion current density. Then, the Tafel slopes of the steel-coated samples suggest that the corrosion phenomena are reduced as the number of zinc-based layers increases.
The Rpblank parameter represents the polarization resistance (Rpol) of the uncoated sample, Rpcoat refers to the Rpol of the coated sample, ΔEcorr represents the difference in the corrosion potential of the blank and coated samples and βa is the anodic slope of the polarization curve.
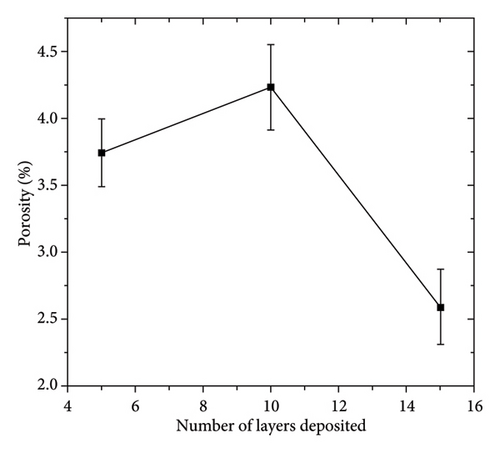
Figure 5(b) shows that porosity strongly influences the electrochemical response of the sample. Higher porosity facilitates the access of aggressive electrolyte species, promoting a higher current density. This is evidenced by the sample coated with 10 layers. The coated samples show that the decrease in porosity results in a reduction of Icorr, which is related to the protective effect of the coating layer. The deposition of the zinc-based layers provides cathodic protection to the steel substrate and promotes the formation of a corrosion product layer consisting of aluminum oxides (Al2O3), zincates, and copper corrosion products. This layer acts as a barrier layer that limits the mass-transfer processes due to a blocking effect. The formation process of the layer strongly influences the electrochemical response of the system. This is evidenced by the porosity percentage, which shows that lower porosity results in higher polarization resistance.
3.3.2. EIS Characterization
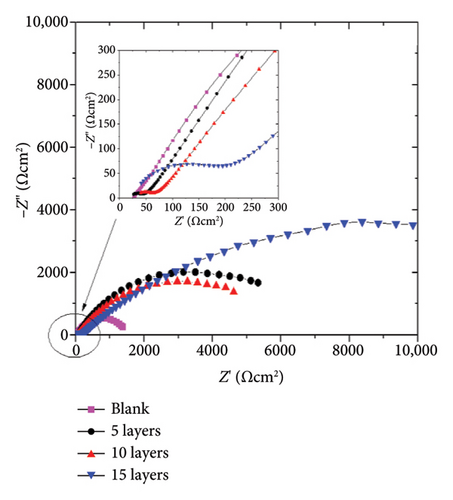
The protective properties and corrosion kinetics of the zinc-coated samples were characterized through EIS. Figure 6 shows the Nyquist and Bode diagrams of the zinc-coated samples obtained at open circuit potential (OCP) conditions. It can be seen that the EIS response varies according to the characteristics of the system. After 72 h of immersion, the Nyquist diagram in Figure 6(a) shows that the blank sample has a resistive–capacitive semiarc, while the coated samples have an incipient semiarc (Figure 6(a) inset) that increases in diameter with the number of layers added. As the sweep frequency decreases, a second semiarc with a wider radius becomes evident. As it is well shown in the corrosion literature, the diameter of the semiarc can be interpreted as a measure of the corrosion resistance of the samples. A higher semiarc diameter indicates a greater corrosion resistance. Therefore, the behavior of our samples suggests that the application of the coating promotes higher corrosion resistance compared to the blank steel samples. The impedance modulus in the Bode plots (Figure 6(b)) shows a higher value than the blank samples, supporting this assumption. The phase angle of the blank sample shows one relaxation process in the low-frequency region.
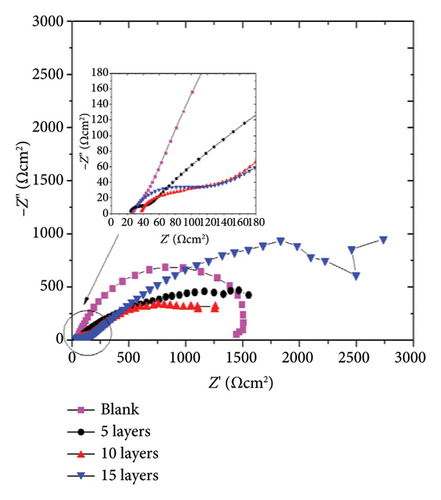
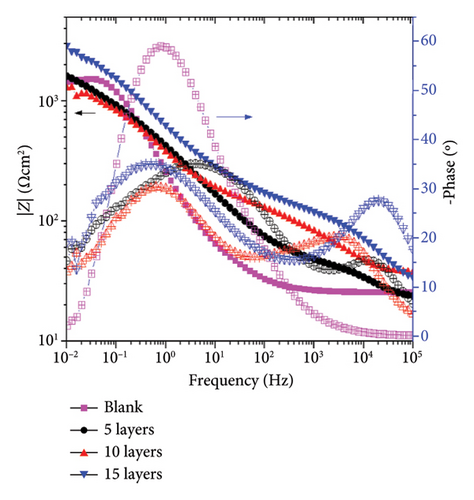
In contrast, the coated samples exhibit the presence of two relaxation processes. The first relaxation process in the high-frequency region (105-103 Hz) increases its amplitude as the amount of layers added increases, which corresponds to the electrochemical response of the corrosion product layer formed and is consistent with the semiarc radius shown in Figure 6(a) inset. This can indicate that as the number of layers applied increases, the amount of corrosion products that can be formed to protect the surface increases. The second relaxation process in the low-frequency region (101-10−1 Hz) is attributed to the behavior of the charge transfer process and the double-layer capacitance (Cdl) in the metal-electrolyte interface. It is observed that the blank samples do not form a protective layer of corrosion products that can increase the corrosion resistance of the sample.
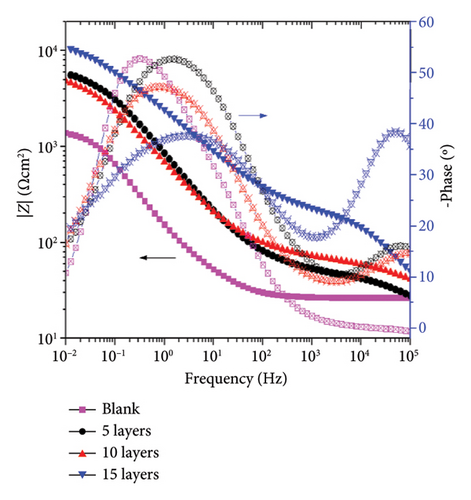
After 240 h of constant immersion, Figures 6(c) and 6(d), the Nyquist diagrams show a flattened semiarc that increases its diameter as a function of the number of layers added, and the higher diameter was obtained at 15 layers. It is relevant to note that the diameter of the semiarc related to the blank sample does not increase, showing almost the same values as those obtained after 72 h of immersion. Also, the semiarc in the high-frequency region (Figure 6(c) inset) shows that the higher diameter increases are obtained for the sample coated with 15 layers, indicating that the protective effect of the corrosion products formed is higher in this sample. Figure 6(d) shows that the coated samples have higher impedance modulus values, reaching an increase of one order of magnitude for the 15-layer coated sample. It is also seen that the application of 5 and 10 layers confers a limited protective effect due to showing a similar behavior among them but higher than the blank sample. The phase angle plot shows two relaxation processes for the coated samples and one for the blank sample, as previously discussed for 72 h of immersion. It is important to note that the amplitude of the relaxation processes increases, indicating a higher electrochemical response of the corrosion product layer for the 15-layer sample or the charge transfer processes in the blank, 5-, and 10-layer coated samples.
The above information indicates that the coating enhances the corrosion resistance of the samples, but the protective properties are affected by the amount of layers applied. The highest level of protection was achieved with the coating that has 15 layers. This is due to the formation of a greater amount of corrosion products, which provides a barrier effect on the surface and limits the mass-transport processes.
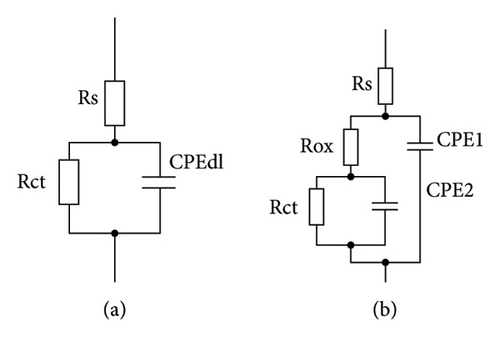
The EIS results were fitted to the electric equivalent circuits shown in Figure 7. The blank sample results were adjusted to the circuit of Figure 7(a) and the coated samples were mainly fitted to the circuit of Figure 7(b). The parameters of the electrical equivalent circuits were as follows: Rs represents the solution resistance, Rox represents the resistance of the corrosion product layer, CPE1 and n1 are the constant phase element and the Cole–Cole exponent related to the electrochemical response of the oxide layer, Rct represents the charge transfer resistance, CPE2 is the constant phase related to the double-layer capacitance, and n2 is the Cole–Cole exponent associated to the CPE element. The CPE elements were utilized to model the capacitive response of the system. This element is sensitive to surface roughness or heterogeneities on the surface. The CPE behavior is modeled by the equation , where YCPE is related to the admittance of the CPE element, ω represents the circular frequency, and n is the Cole–Cole exponent whose values range from 1 to −1. The behavior of the CPE can vary depending on the value of n. A value of n = 1 indicates a pure capacitor behavior, n = −1 indicates an inductive response, and n = 0.5 indicates a Warburg diffusive response.
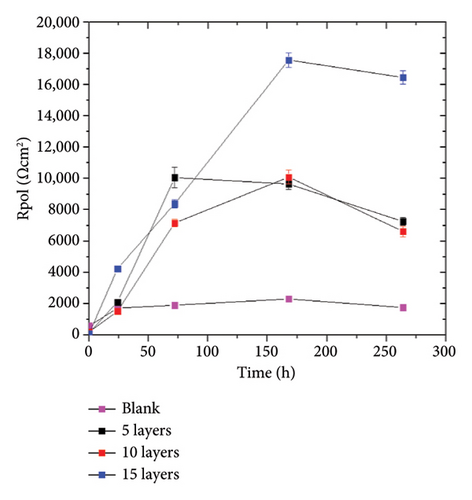
The EIS fitting results are shown in Table 2. The results indicate a slight increase in the charge transfer resistance of the blank sample. The coated samples showed higher charge transfer values, with approximately 4 times higher values for the samples with 5 and 10 layers and even 9 times higher values for the 15 layers coated samples after 240 h of constant immersion. This behavior corroborates the protective effect of the applied coating and is consistent with the previously discussed electrochemical tests. Also, Abdallah et al. [38, 39] indicate that the rising behavior of the Rct can suggest a higher adherence of the protective film, decreasing the access of the corrosive electrolyte to the metallic substrate. Then, the corrosion products formed in the sample with 15 layers efficiently protect the A36 steel substrate. The n1 parameter shows values close to 0.5, indicating that the corrosion phenomenon is controlled by diffusive processes.
| A36 steel | EEC | ||||||||
|---|---|---|---|---|---|---|---|---|---|
| Time | Rs | Rct | CPE2 | n2 | X2 | ||||
| h | Ωcm2 | Ωcm2 | Mohssn | ||||||
| 0 | 25 | 591 | 4.5 × 10⁻⁴ | 0.795 | 0.086 | a | |||
| 24 | 25 | 1720 | 8.5 × 10⁻⁴ | 0.772 | 0.045 | a | |||
| 72 | 25 | 1910 | 6.9 × 10⁻⁴ | 0.753 | 0.052 | a | |||
| 168 | 25 | 2310 | 6.2 × 10⁻⁴ | 0.755 | 0.016 | a | |||
| 264 | 25 | 1760 | 1.7 × 10⁻³ | 0.7 | 0.078 | a | |||
| a | |||||||||
| Zn-18Al-2Cu | 5 layers | ||||||||
| Time | Rs | Rox | CPE1 | n1 | Rct | CPE2 | n2 | X2 | EEC |
| h | Ωcm2 | Ωcm2 | Mohssn | Ωcm2 | Mohssn | ||||
| 0 | 25 | 159 | 2.2 × 10⁻³ | 0.872 | 0.032 | a | |||
| 24 | 25 | 50 | 3.9 × 10⁻⁴ | 0.462 | 2060 | 5.1 × 10⁻⁴ | 0.528 | 0.1595 | b |
| 72 | 25 | 63.5 | 7.2 × 10⁻⁵ | 0.493 | 11,000 | 1 × 10⁻⁴ | 0.609 | 0.3513 | b |
| 168 | 25 | 40.1 | 2.5 × 10⁻⁵ | 0.571 | 9610 | 3.9 × 10⁻⁴ | 0.676 | 0.0053 | b |
| 264 | 25 | 38 | 2.9 × 10⁻⁵ | 0.571 | 7220 | 3 × 10⁻⁴ | 0.674 | 0.0343 | b |
| Zn-18Al-2Cu | 10 layers | ||||||||
| Time | Rs | Rox | CPE1 | n1 | Rct | CPE2 | n2 | X2 | EEC |
| h | Ωcm2 | Ωcm2 | Mohssn | Ωcm2 | Mohssn | ||||
| 0 | 25 | 202 | 3.2 × 10⁻³ | 0.786 | 0.0641 | a | |||
| 24 | 25 | 106 | 5.6 × 10⁻⁵ | 0.616 | 1420 | 1 × 10⁻³ | 0.559 | 0.0396 | b |
| 72 | 25 | 317 | 8.9 × 10⁻⁵ | 0.476 | 6850 | 3 × 10⁻⁴ | 0.573 | 0.33 | b |
| 168 | 25 | 133 | 4.5 × 10⁻⁵ | 0.475 | 9960 | 3.6 × 10⁻⁴ | 0.563 | 0.072 | b |
| 264 | 25 | 53.8 | 3.9 × 10⁻⁵ | 0.51 | 6570 | 4.1 × 10⁻⁴ | 0.635 | 0.02245 | b |
| Zn-18Al-2Cu | 15 layers | ||||||||
| Time | Rs | Rox | CPE1 | n1 | Rct | CPE2 | n2 | X2 | EEC |
| h | Ωcm2 | Ωcm2 | Mohssn | Ωcm2 | Mohssn | ||||
| 0 | 25 | 84 | 1.5 × 10⁻³ | 0.896 | 0.65 | a | |||
| 24 | 25 | 119 | 1.2 × 10⁻⁵ | 0.637 | 4130 | 6.5 × 10⁻⁴ | 0.513 | 0.058 | b |
| 72 | 25 | 227 | 7.3 × 10⁻⁶ | 0.668 | 8160 | 2.7 × 10⁻⁴ | 0.498 | 0.1412 | b |
| 168 | 25 | 1070 | 3.8 × 10⁻⁷ | 0.844 | 16,500 | 1 × 10⁻⁴ | 0.272 | 0.027 | b |
| 264 | 25 | 158 | 4.4 × 10⁻⁷ | 0.828 | 16,300 | 1.5 × 10⁻⁴ | 0.508 | 0.0073 | b |
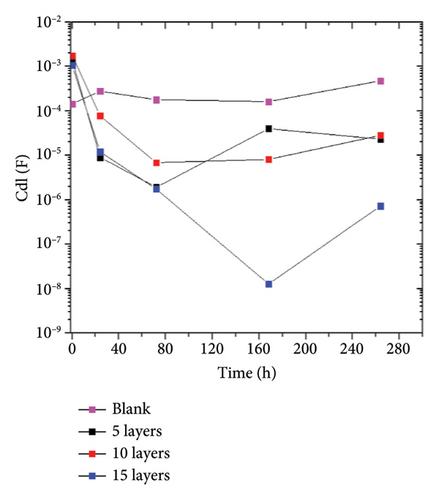
To summarize the fitting results, the Rpol and the Cdl are plotted in Figure 8. The Rpol was calculated using the equation: RPol = Rox + Rct,while the Cdl was obtained through the Brugg’s equation: . The parameters used have the standard representation in the electrical equivalent circuit described earlier. Figure 8(a) shows that the addition of the coating promotes a higher Rpol indicating its anticorrosive effect. The highest polarization values were achieved with 15 layers, which are 9 times higher than those obtained by the blank sample. The Cdl (Figure 8(b)) shows a decrease in capacitance values compared to the blank sample. The double- layer capacitance is associated with the active surface area capable of redox processes. Therefore, the behavior of the coated samples indicates a reduction in the active area, which, in synergy with the Rpol indicates a decrease in the corrosion phenomena on the coated samples.
3.4. Corrosion Products Characterization
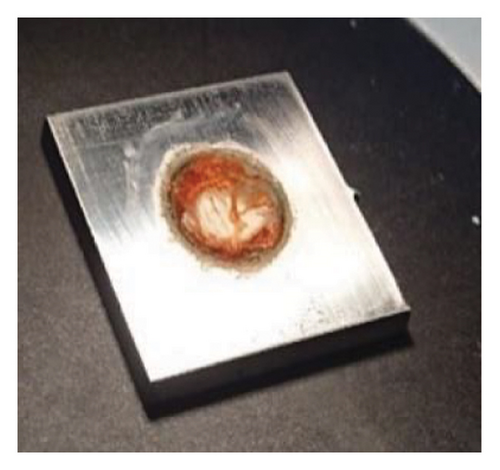
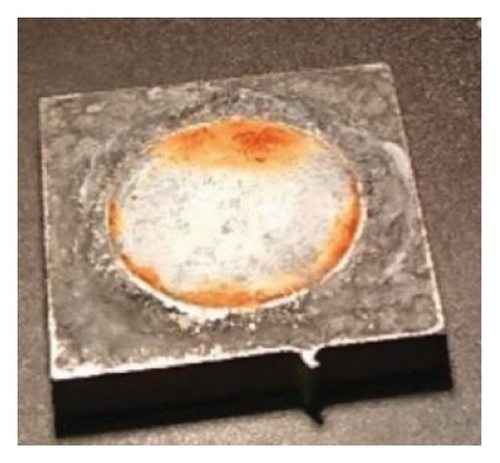
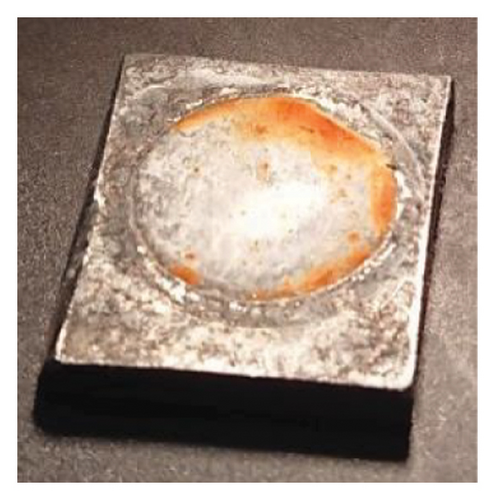
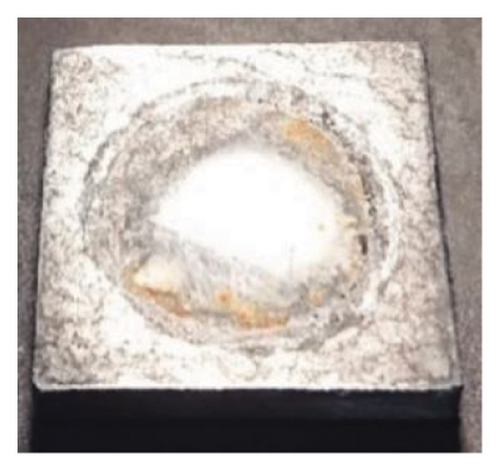
The surface appearance of the samples after 264 h of static immersion in a 3.5% NaCl solution is shown in Figure 9. It is evident that the metallic coating mitigates the corrosive damage to the surface. The blank sample (Figure 9(a)) shows a higher amount of reddish-brown corrosion products, while the coated samples (Figures 9(b), 9(c), 9(d)) show a lower extension of this coloration over the surface. The reddish-brown corrosion products present in the sample are indicative of the presence of iron oxides. Additionally, a whitish and powdery corrosion product, related to zinc oxides was observed. It is important to note that the extension of the reddish-brown corrosion product decreases as the number of layers added to the coating increases. This is due to the reduced penetration of the electrolyte into the substrate, which allows the steel surface to react and form iron oxides. The sample with 15 layers shows a more stable surface appearance and a better distribution of the whitish corrosion product layer. Only a small portion of the reddish-brown oxides is observed indicating a higher level of protection provided by the coating.
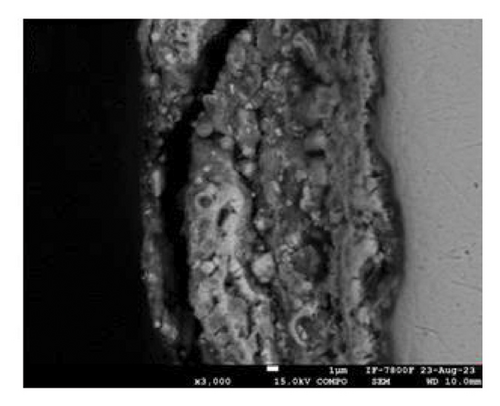
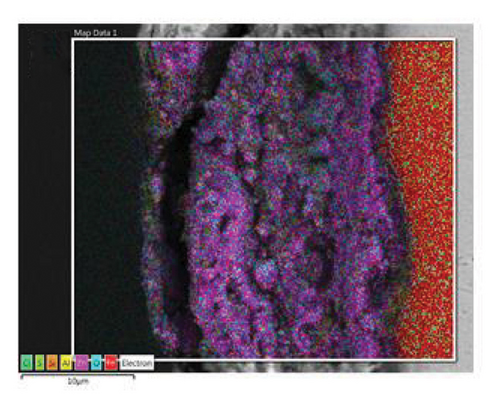
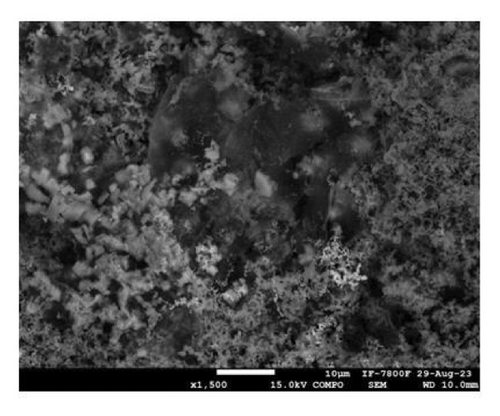
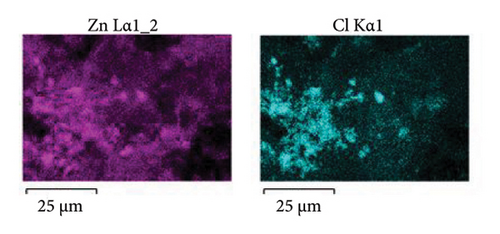
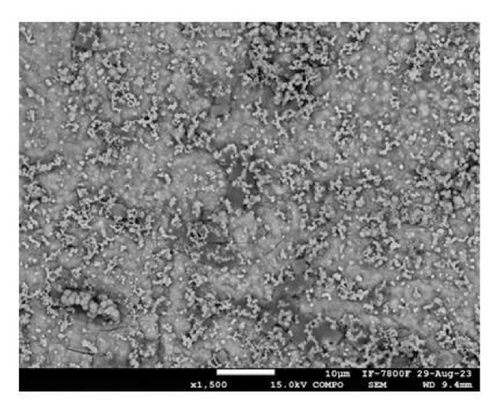
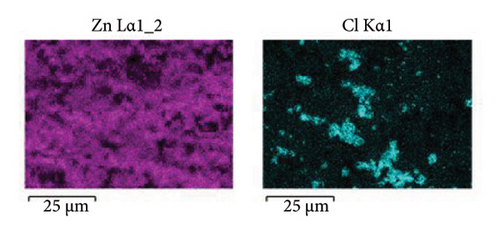
To shed light on the morphology and elemental composition of the corrosion product, the samples were characterized through SEM-EDS analyses. Figure 10 shows the morphology of the corrosion product layer obtained from the samples covered with 5 (Figure 10(a)) and 15 (Figure 10(c)) layers. The corrosion product layer appears to be homogeneous with a porous structure that spreads over the surface. Elemental mapping analysis, as shown in Figure 10(b), indicates that the layer is composed of Zn, Cl, and Al. This composition pertains to the presence of corrosion products of zinc and aluminum, which are formed due to the reaction of the coating with the electrolyte. In Figure 10(c), the sample coated with 15 layers exhibits a compact surface with spherical corrosion products. The elemental composition (Figure 10(d)) indicates that these corrosion product layers are composed of zinc and chlorine. It is relevant to note that the compactness of the corrosion product layer increases with the number of coating layers added, providing a stronger anticorrosion effect for the sample. This behavior is in concordance with the porosity (Figure 5(b)) and the trend of the Cdl (Figure 8(b)) determined through electrochemical techniques. This indicates that higher compactness leads to a decrease in porosity, resulting in a reduction of the amount of exposed metallic surface that is able to corrode. On the other hand, the percentage of zinc detected is higher for the sample coated with 15 layers (Zn = 53% at.) compared to the zinc detected for 5 layers (Zn = 19% at.). This indicates that a higher number of deposited layers provides a greater protective effect due to the synergistic effect of the barrier and cathodic protection mechanisms. The morphology and surface appearance of the coated samples are consistent with the electrochemical results discussed previously.
The corrosion products were characterized using FTIR and XRD analysis, as shown in Figure 11. The FTIR spectra (Figure 11(a)) revealed an absorption peak at 630 cm−1 related to the E1 longitudinal optical phonon mode which are characteristic bands of ZnO [40, 41]. The peaks detected at 822 cm−1, 1405 cm−1, and 1572 cm−1 are related to the v1 symmetric stretch and v3 asymmetric stretch of the zinc hydroxycarbonate which is formed due to the presence of CO2 dissolved in the electrolyte. On the other hand, the absorbance bands from 1700 to 3000 cm−1 are related to the stretching vibration of C = O bonds, which were attributed to impurities during the sample measurement [42]. The wide peak at 3340 cm−1 is related to molecular water and OH stretching bonds [43].
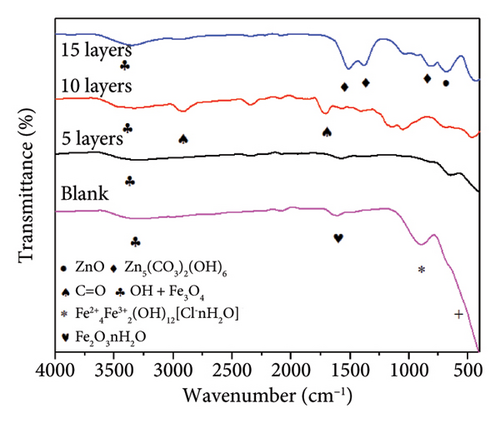
On the other hand, the blank corroded sample shows absorption peaks at 528, 910, and 1630 cm−1, which are attributed to the transverse optical vibration of Fe3O4, bending vibration in Fe-O-H in ferrihydrite (Fe2+4Fe3+2[OH]12[Cl-nH2O]), and bending vibration in hydrated iron oxides (Fe2O3nH2O), respectively [43–45]. The peak at 3340 cm−1 is broad and is related to the OH stretching, as indicated above. The presence of ferrihydrite (Fe2O3nH2O) is related to corrosion in chloride media and is in concordance with the exposure corrosion media of this test.
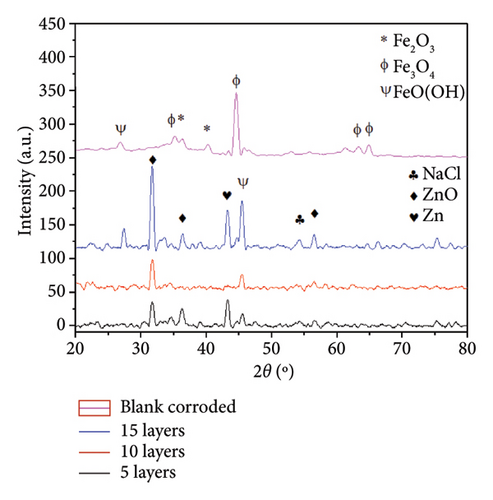
The crystalline phases of the corrosion products were determined through XRD analysis in Figure 11(b). The XRD pattern shows high-intensity peaks that were assigned to the major crystalline phases according to the Match! Software database. The Miller indexes of the indexed pattern are shown in Table S.1 in the Supporting Section. For the blank corroded sample, the diffraction peaks at 26° and 63° were assigned to FeO(OH) (PDF # 01-084-9891), the peaks at 35.6° and 40.8° were related to Fe2O3 (PDF # 96-210-8028), while peaks at 36° and 46° were related to Fe3O4 (PDF # 01-085-3772). For the coated samples, the plot shows the presence of peaks at 32°, 34°, and 36°, corresponding to the ZnO phase (PDF # 01-070-2551), which crystallizes in an hcp structure. The peak obtained at 36°, 43°, and 77° is assigned to the presence of α-Zn solid solution (PDF # 01-071-3764). In addition, the peaks at 32°, 46°, and 56° were attributed to the presence of NaCl (PDF # 01-070-2509), which belongs to the corrosive electrolyte. The diffractograms obtained for each sample condition showed diverse intensities, which can be associated with a higher amount of corrosion products developed leading to higher peak diffraction intensity.
All of the above indicates that the sample surfaces exhibit two different types of corrosion products depending on the conditions of the sample that promote different corrosion mechanisms. The blank corroded sample shows an iron rust layer composed of Fe3O4, Fe2O3, and FeO(OH). On the other hand, the Zn-22Al-2Cu coated samples show the presence of ZnO and Zn5(CO3)2(OH)6 corrosion products. It is worth noting that the coating protects the steel substrate as the iron oxides were determined on the blank corroded sample and the coated coupons show zinc corrosion products. This behavior is consistent with the surface appearance shown in Figure 9. The results of the corrosion product analysis demonstrate that the characterization techniques used are complementary and provide valuable information about the composition of the corrosion layer developed.
4. Conclusion
- •
The porosity and compactness of the coating are strongly affected by the number of powder layers added.
- •
Elemental mapping shows that the coating is mainly composed of zinc, which is in concordance with the XRD pattern showing diffraction peaks of η-zinc-rich phases and zinc oxides.
- •
The sample with the 15-layer coating shows the highest compactness; also, micrographs show that it is well-fused over the metallic substrate. This behavior is also evidenced by the higher adhesion obtained for this sample (4.5 MPa).
- •
The potentiodynamic polarization curves show that the Zn-22Al-2Cu coating promotes a more negative Ecorr value than the blank sample, indicating the cathodic corrosion protection of zinc. The coating allows the formation of a protective corrosion product layer that promotes a pseudopassive behavior.
- •
The EIS spectra of the uncoated sample show the response of a resistive–capacitive semiarc with the presence of only one relaxation process. In comparison, the coated samples show the presence of two relaxation processes in high and low frequencies.
- •
The application of 15 layers of the coating allows a 9-fold increase in the Rpol compared to the blank sample.
- •
The corroded surface shows the presence of brown-red rust for the blank sample attributed to Fe3O4, FeO(OH) polymorphs, and Fe2O3. The coated samples show a whitish corrosion product attributed to ZnO and Zn5(CO3)2(OH)6.
Conflicts of Interest
The authors declare no conflicts of interest.
Funding
The authors received no specific funding for this study.
Acknowledgments
The authors wish to thank M. Sc. Adriana Cruz Tejeda from IIM-UNAM for their kind support with the XRD characterization. Also, the authors wish to thank Dr. Luis F. Garrido and Dr. Samuel Tehuacanero for their support in FTIR and SEM characterization techniques.
Supporting Information
Table S.1: Reflection and Miller index of the corroded samples.
Open Research
Data Availability Statement
The data that support the findings of this study are available from the corresponding author upon reasonable request.


