Isolation Enhancement Based on TM010 and TE30 Mode Characteristics in a Patch Antennas Using Genetic Algorithm Optimization for Ku-Band Applications
Abstract
This paper proposes a novel technique to enhance isolation in rectangular patch antennas by leveraging the mode characteristics of TM010 and TE30 to achieve better than −40 dB between the transmitter and receiver with dual-polarization features. The primary innovation of this work lies in achieving significant isolation enhancement solely by combining two resonant modes with orthogonal polarizations, without incorporating any additional design elements such as parasitic components or decoupling structures. To validate the isolation enhancement based on these mode characteristics, a pair of rectangular transmitter and receiver patch antennas was designed to operate in the frequency range from 14 to 14.25 GHz. The transmitter antenna was designed using the TM010 mode with horizontal polarization, while the receiver antenna used the TE30 mode with vertical polarization. The design utilized a Rogers 3003 series dielectric substrate with a dielectric constant of 3.3 and a loss tangent of 0.003. A genetic algorithm with tournament selection and a multiobjective function was applied to optimize key performance metrics, such as impedance matching, bandwidth, and gain. Following successful optimization, the simulated results were validated against measurements, showing excellent agreement and confirming the accuracy of the proposed antenna design.
1. Introduction
Isolation is a crucial performance factor in radio frequency (RF) devices, especially for addressing coexistence issues within a single device that incorporates multiple RF subsystems. It helps to prevent interference between these subsystems, ensuring proper functionality and performance. In modern wireless communication systems, the coexistence of transmitting and receiving antennas within close proximity is common, in such configurations, maintaining adequate isolation between transmitting and receiving antennas is crucial to ensure the overall performance and reliability of the system [1, 2]. The interference degrades the signal-to-noise ratio (SNR) and can lead to errors in data transmission, ultimately reducing the communication system’s efficiency and reliability, especially in satellite communication [3–6]. Mutual coupling alters the current distribution on the antennas, affecting their impedance and radiation patterns [7, 8]. This can result in reduced antenna efficiency and altered directional characteristics, which can impact the intended coverage and performance of the antenna systems [9]. To cope up with all the above challenges, high isolation between the antennas within the same system is crucial. Techniques such as physical separation, shielding, the use of decoupling structures, and advanced design strategies are employed to enhance isolation, thereby ensuring that the transmitting and receiving functions operate independently and efficiently. By mitigating the adverse effects of mutual coupling, these techniques contribute significantly to the effectiveness of modern communication systems, supporting high data rates, reliable connections, and efficient spectrum utilization. Defected ground structures (DGSs) are widely used to enhance isolation between closely spaced antenna elements. By introducing defects or slots in the ground plane, DGS disrupts the surface current distribution, which helps to suppress unwanted coupling effects [10]. However, through this method, up to only −20 dB isolation was demonstrated [11]. Electromagnetic bandgap (EBG) structures utilize periodic patterns to create bandgaps that prevent the propagation of surface waves, thereby enhancing isolation. EBG structures can be integrated into the antenna ground plane or placed as additional layers between antenna elements [12]. These structures are highly effective at microwave and millimeter-wave frequencies, where surface wave suppression is critical for maintaining antenna performance [13]. However, these structures usually have to be implemented in several rows, increasing the structure’s dimensions. Neutralization lines are another approach used to mitigate mutual coupling between antenna elements. Neutralization lines work by introducing a compensating signal path that counteracts the coupling currents between elements, thus enhancing isolation. This technique is effective for multiple input—multiple output (MIMO) systems and is relatively straightforward to implement without major modifications to the antenna’s physical design [14]. Parasitic elements, such as directors and reflectors, can be strategically placed near the driven antenna elements to manipulate the electromagnetic fields and improve isolation. By carefully tuning the parasitic elements, the mutual coupling can be minimized, making this approach suitable for antenna arrays and Yagi-Uda configurations [15]. Decoupling networks are designed to introduce compensating currents that negate the coupling effects, thereby maintaining high isolation across a broad frequency range [16]. Metamaterials represent an advanced approach for isolation enhancement. Metamaterial structures, such as resonators or metasurfaces, can be designed to provide tailored isolation characteristics, offering flexibility in terms of frequency response and spatial configuration [17]. Metamaterials are effective in enhancing isolation in applications ranging from mobile devices to large-scale antenna arrays used in satellite communications.
However, the existing isolation enhancement techniques typically achieve no better than −30 dB isolation and often require additional elements such as parasitic components, DGS, or EBG structures, which increase design complexity, manufacturing costs, and antenna size. To overcome these limitations, this research proposes a novel method to achieve isolation better than −40 dB by utilizing different modes (TM010 and TE30) and polarizations for the Tx and Rx components. Specifically, the Tx antenna is designed to operate in the TM010 mode with horizontal polarization, where the current density vector aligns with the length of the patch, since the resonance frequency of the patch antenna is primarily determined by its length. In this situation, the current will be zero for other modes except the TM010 mode. As a result, the patch antenna will not resonate in any mode other than TM010. Similarly, the Rx antenna is configured to operate in the TE30 mode with vertical polarization. In this mode, the resonance is primarily determined by the half-guided wavelength slot, where the maximum current density is concentrated. The length and width of the patch have minimal impact on the resonance, resulting in negligible current outside the slot region. Consequently, the slot antenna will resonate exclusively in the TE30 mode, while the surface current in other modes remains approximately zero, effectively suppressing resonance in those modes except TE30 mode.
Additionally, since the resonance conditions of both Tx and Rx antennas are primarily determined by their respective modes and polarizations, the approach can be readily adapted to accommodate more elements without introducing significant interference or the need for extensive redesign in the large-scale arrays. The suppression of unwanted modes and current leakage within each antenna element ensures that the performance remains stable even as the number of elements in the array increases. This scalability aspect is further enhanced by the fact that the method does not rely on complex additional structures, which are often difficult to implement in large arrays. Moreover, as antenna array sizes grow, the geometry and dimensions of individual elements can be adjusted to optimize the performance further, with minimal impact on the overall system’s isolation. This adaptability makes the proposed approach highly scalable for applications in large-scale communication systems, such as those used in satellite communications, 5 G, and beyond.
This section provides an introduction and discusses several existing methods to improve isolation, followed by an identification of the research gap and the proposed novelty of this study. Section 2 explains the design concept of the Tx antenna operating in the TM010 mode with horizontal polarization. Section 3 focuses on the design concepts of the Rx antenna in the TE30 mode with vertical polarization. In Section 4, the Tx and Rx antennas are integrated with distinct polarizations, and their performance is optimized using a genetic algorithm (GA) optimization. This section also includes a practical analysis of the proposed antennas based on quantitative data. Finally, Section 5 presents the conclusions and outlines future directions for the development of the proposed antenna design.
2. TM010 Mode Rectangular Patch Antenna Design
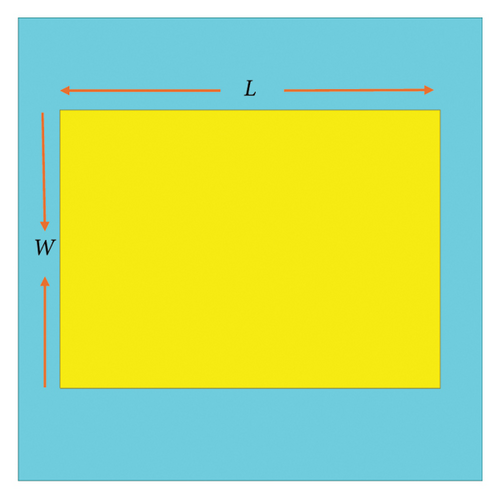
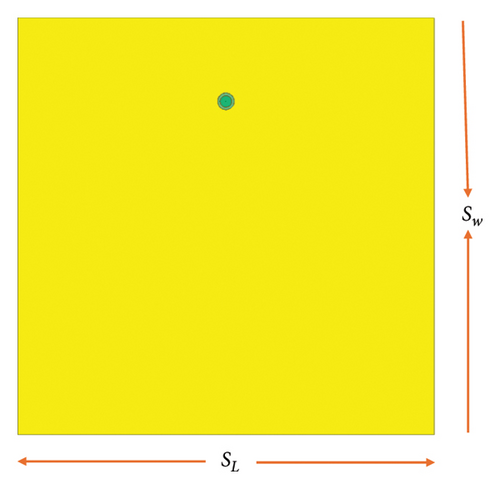
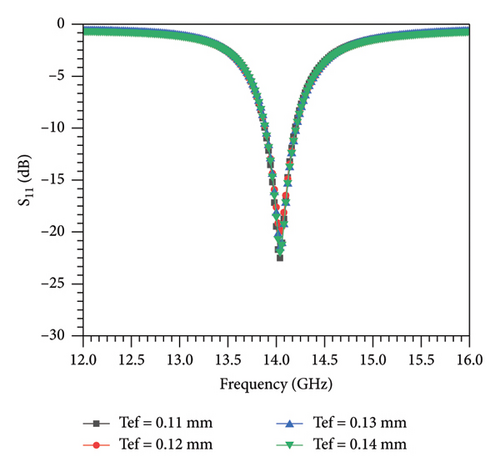
To design the coaxial feeding network, the inner conductor was modeled with a radius of in = 0.001 mm. A Teflon dielectric layer, with a relative permittivity of 2.2 and a radius Tef = 0.15 mm, was added around the inner conductor. The outer conductor was then designed with a radius out = 0.2 mm. The position of the coaxial feed is illustrated in Figure 1(b). A 50-Ω wave port was assigned at one end of the coaxial feed to serve as the input. The radius of the inner conductor, dielectric layer, and outer conductor significantly influences impedance matching. Therefore, prior to finalizing the patch length, these parameters were fine-tuned to achieve optimal matching. The patch dimensions were fixed at W × L = 6 mm × 8 mm, and the effect of the outer conductor radius of the coaxial feed on impedance matching was systematically investigated. Specifically, the outer conductor radius (Out) was varied across 0.25 mm, 0.3 mm, and 0.35 mm, with an additional evaluation at a smaller value of 0.04 mm. These variations were examined under the condition Out < Tef < in. The corresponding simulated S11 responses as a function of Out are illustrated in Figure 2(a). Based on the simulation results presented in Figure 2(a), the return loss performance is optimal when the outer conductor radius Out = 0.25 mm, whereas the poorest performance is observed at Out = 0.04 mm. To determine the optimal radius of the inner conductor in, a parametric sweep was conducted from 0.002 mm to 0.005 mm. As shown in Figure 2(b), a smaller inner conductor radius leads to improved impedance matching, while increasing in degrades the return loss performance. These observations remain valid within the frequency range of 14 GHz–14.25 GHz under the condition Out < Tef < in. Subsequently, to evaluate the effect of the dielectric radius Tef, the S11 parameter was simulated for values ranging from 0.11 mm to 0.14 mm, as shown in Figure 3(a). The results indicate that variations in Tef have a negligible impact on S11, with all four tested values yielding nearly identical return loss characteristics.


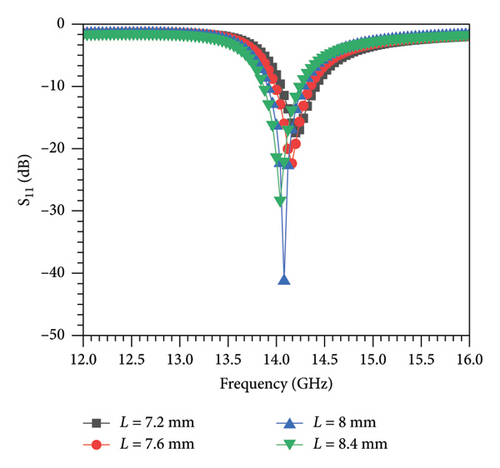
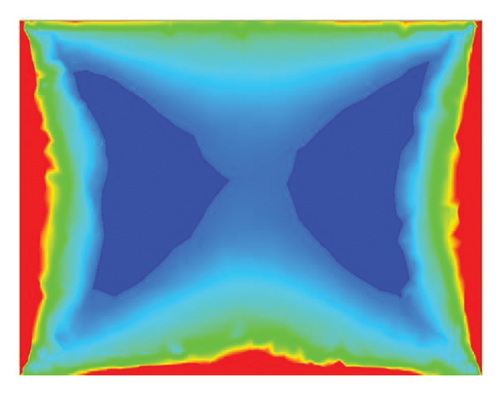
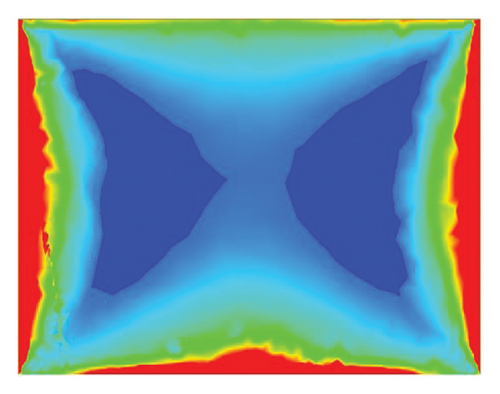
After determining the optimal S11 response with respect to the coaxial feed parameters Out, in, and Tef, the influence of the patch length L on S11 was investigated. The patch length was varied from 7.2 to 8.4 mm while keeping the patch width fixed at 6 mm. As shown in Figure 3(b), the simulation results indicate that increasing L shifts the resonance frequency toward lower values, consistent with the inverse relationship between resonance frequency and patch length. Additionally, larger values of L improve the return loss performance, whereas smaller L values result in poorer impedance matching within the frequency range of 14–14.25 GHz. At L = 8.4 mm, the proposed rectangular patch antenna achieves a bandwidth of approximately 250 MHz. Based on the analyses, the parameters yielding the best return loss performance were fixed as follows: Out = 0.25 mm, in = 0.002 mm, Tef = 0.11 mm, L = 8.4 mm, and W = 6 mm. With these optimized values ensuring good impedance matching across the 14–14.25 GHz bandwidth, the current distribution of the antenna operating in TM010 mode was simulated at 14 and 14.25 GHz. The results are presented in Figures 4(a), 4(b), where the red regions correspond to areas of maximum current density (Jmax) and the blue regions indicate current minima (Jmin). The maximum and minimum current densities are summarized in Table 1. This analysis confirms that the patch length L and width W predominantly influence the current distribution, as the highest currents are aligned along these dimensions.
| Frequency (GHz) | 14 | 14.05 | 14.1 | 14.15 | 14.2 | 14.25 |
|---|---|---|---|---|---|---|
| Jmax (A/meter) | 39,163.88 | 41,742.7 | 46,444.39 | 46,914.887 | 49,918.71 | 72,084.3 |
| Jmin(A/meter) | 0.184 | 0.109 | 0.109 | 0.049 | 0.049 | 0.017 |
3. TE30 Mode Rectangular Slot Antenna Design
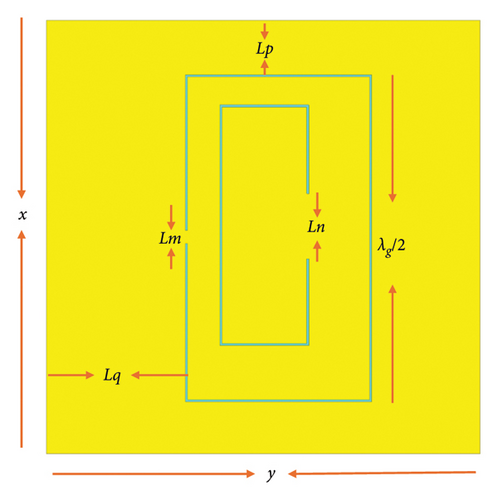
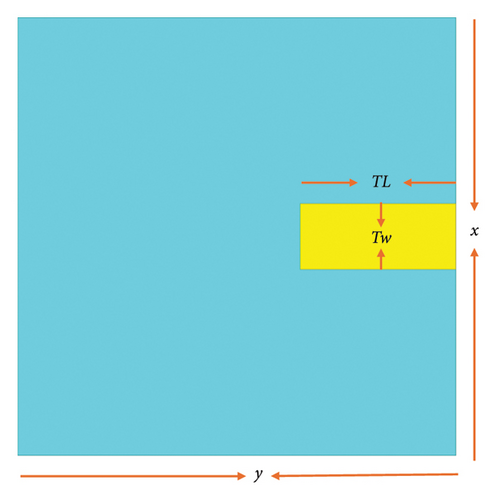
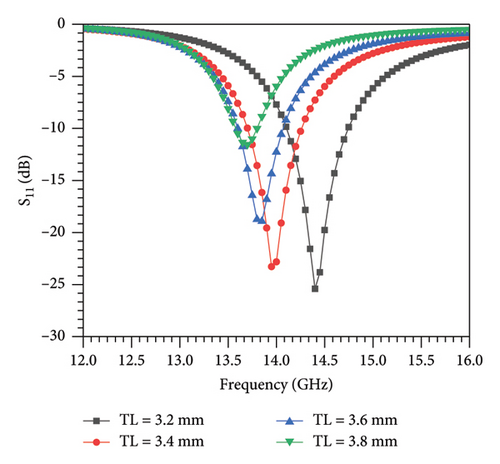
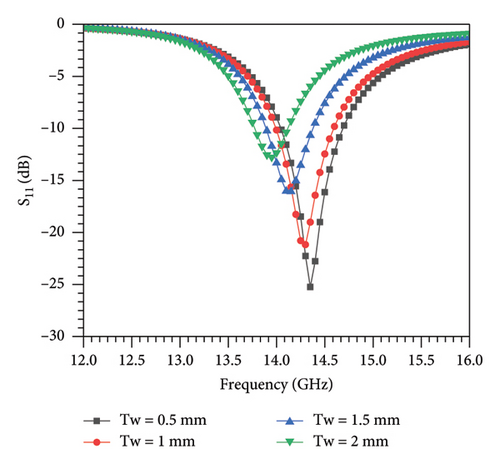
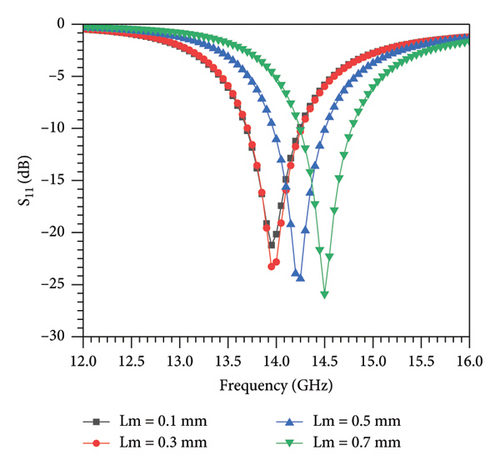
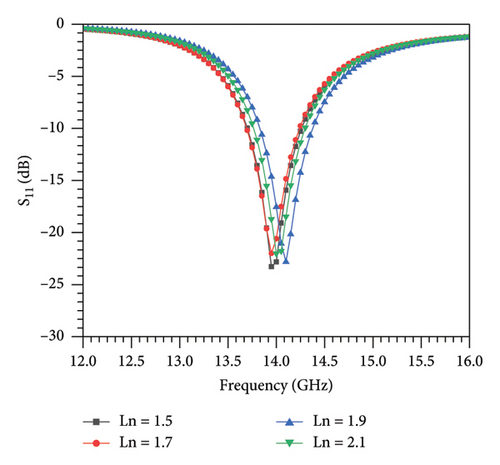
After designing the above structure, its geometry must be optimized to achieve good impedance matching. As part of this process, the length of the feeding network (TL) was first optimized. To determine the optimal TL value, the return loss (S11) was simulated for TL values ranging from 3.2 to 3.8 mm, as shown in Figure 6(a). The simulation results indicate that increasing TL causes the resonance frequency to shift toward lower frequencies. A smaller TL improves return loss performance; however, an excessively small TL causes the resonance frequency to exceed the desired band of 14–14.25 GHz. When TL = 3.4 mm, the return loss was found to remain below −10 dB across the entire target frequency range. Hence, TL was fixed at 3.4 mm. Next, the width of the matching network (Tw) was varied from 0.5 to 2 mm to examine its impact on impedance matching, as illustrated in Figure 6(b). The simulation results show that a smaller Tw results in better return loss performance. Increasing Tw shifts the resonance frequency to a lower band and degrades return loss. The best performance, with S11 below −10 dB over the 14–14.25 GHz band, was observed at Tw = 1 mm, which was then chosen as the optimal value. To evaluate the influence of the shorted slot length Lm, it was varied from 0.1 to 0.7 mm, and the corresponding S11 results are shown in Figure 7(a). The results reveal that increasing Lm enhances return loss within the desired frequency band. However, further increases in Lm shift the resonance frequency to higher values. The optimal value of Lm was determined to be 0.3 mm. The short length Ln was then varied from 1.5 to 2.1 mm in 0.2-mm steps, and the simulation results are shown in Figure 7(b). These results suggest that variations in Ln have minimal effect on return loss performance. The best observed value in this case was Ln = 2.1 mm.
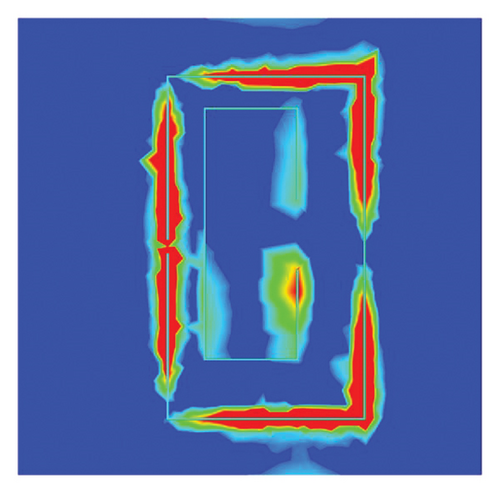
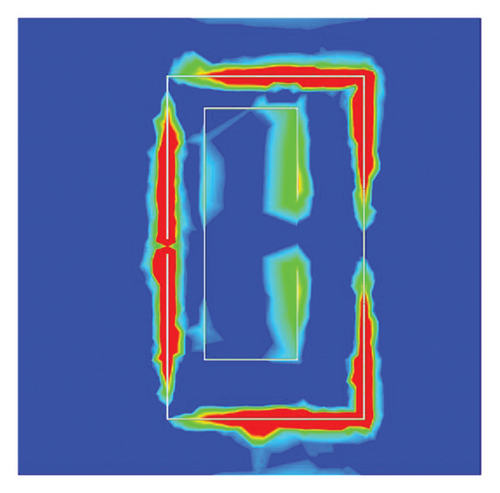
After finalizing the optimal values of TL, Tw, Lm, and Ln, the current distribution of the proposed rectangular slot antenna was simulated at the resonance frequencies of 14 and 14.25 GHz, as shown in Figures 8(a), 8(b), respectively. The slot length was fixed at half the guided wavelength (0.5 λg). The current distribution reveals that the maximum current is concentrated around the slot region, particularly in the shorted sections defined by Lm and Ln. These parameters play a significant role in increasing current density, thereby enhancing the antenna’s resonance behavior. The improved performance for smaller values of Lm and Ln can be attributed to the resulting higher current concentration, which supports resonance within the target frequency range of 14–14.25 GHz. Thus, Lm and Ln are critical tuning parameters for optimizing current distribution and achieving the desired resonance characteristics in the proposed slot antenna.
4. Isolation Enhancement Between TM010 and TE30 Modes
In the previous sections, we discussed the design of a rectangular patch antenna operating in the TM010 mode and a slot antenna in the TE30 mode in detail. In this section, we combine these two antennas into a single structure. The rectangular patch antenna in TM010 mode serves as the transmitter (Tx) with horizontal polarization, while the slot antenna in TE30 mode functions as the receiver (Rx) with vertical polarization. The distance between the Tx and Rx antennas is set to approximately half a guided wavelength. Once integrated into a single antenna structure in high-frequency structure simulator (HFSS), tuning each parameter individually becomes challenging. To address this, a GA optimization is employed to quickly optimize the performance parameters. The interface between HFSS and MATLAB is commonly used and considered a standard approach in engineering research. To implement the GA for optimization, it is essential to first establish an interface between HFSS and MATLAB via a Visual Basic (VB) script. The process begins with launching HFSS and enabling the VB script recording feature. Subsequently, the proposed antenna structure is modeled using HFSS’s predefined geometric primitives. Throughout the design phase, all parameters intended for optimization must be explicitly defined as variables. After completing the antenna design, the VB recording was stopped, and the generated script is saved in a designated folder, referred as “ravi.” The complete flowchart illustrating the HFSS–MATLAB interface is presented in Figure 9.
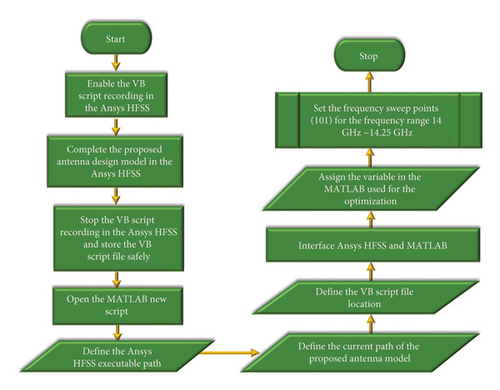
After creating the VB script file using HFSS, MATLAB is used to perform the optimization. Any version of MATLAB can be employed, provided it includes the Global Optimization Toolbox. The HFSS–MATLAB application programming interface (API) is a library toolbox that enables MATLAB to control HFSS via its scripting interface. This API offers a set of MATLAB functions to generate 3D structures in HFSS by creating the corresponding HFSS scripts. Essentially, any operation that can be performed within the HFSS environment can also be achieved using the 3D Modeler library functions in MATLAB. Once the script is generated, it can be executed within HFSS to build the 3D model, solve the simulation, and export the results back to MATLAB. Alternatively, the entire antenna model can be developed in MATLAB as a script and then solved in HFSS. To enable this interaction, the HFSS–MATLAB API library files must be added to the MATLAB path. The proposed antenna design should be saved in the “ravi” directory with two project files: Antenna.aedt and matlab_Antenna.aedt. Both files must contain identical antenna structures. When MATLAB initiates communication with HFSS, it opens the matlab_Antenna.aedt file to control simulation parameters and retrieve performance data. After collecting the required data, MATLAB performs the optimization routine. Upon completion, the optimized variable values are written back to the original project file, Antenna.aedt. A detailed step-by-step procedure for integrating HFSS with MATLAB is available in [18].
- •
> and > , where = = 0.32 (corresponding to −10 dB),
- •
> , where = −40 dB,
- •
, where = 3 dBi.
These constraints ensure that impedance matching and isolation targets are met, and the gain remains above the minimum threshold. After evaluating all the above conditions, the error function is calculated using equation (13). If none of the four conditions— > , > , > , and —are satisfied, the error is set to E = 0, as shown in equation (14), and the optimization process is terminated. All evaluations are performed over the frequency range of 14–14.25 GHz.
The choice of GA parameters is based on the results from Sections 2 and 3. The parameters influencing impedance matching have been incorporated into the optimization process. For instance, the parameter W was not included in the optimization to maintain the condition W < L. Additionally, to maintain the above same condition, the lower boundary (Xmin) for L must be higher than W, while the upper boundary (Xmax) must be less than the total printed circuit board (PCB) length and width. Similarly, for the remaining parameters, the upper (Xmax) and lower (Xmin) boundaries are determined based on their S-parameter results, ensuring they are close to the optimal values for achieving good impedance matching, as observed in Sections 1 and 2.
The selection of population size and the number of generations in a GA are influenced by factors such as the number of optimization variables and the computational capability of the system. A larger population provides more candidate solutions per generation, potentially reducing the number of generations required for convergence. However, this approach demands high-performance computing resources, typically with more than 32 GB of random access memory (RAM), and increases computation time. For systems with limited resources (e.g., 8–16 GB RAM), it is more efficient to begin with a smaller population and fewer generations, particularly when dealing with a limited number of variables. This strategy enables preliminary observation of the convergence trend with minimal computational cost. If the solution does not improve, the population size and number of generations can be incrementally increased to enhance optimization results.
In this research, a computer system equipped with 16 GB of RAM was used. To avoid system lag and maintain computational efficiency, we initially employed a small population size and a limited number of generations, as only five variables were subject to optimization. The GA utilized tournament selection with a population size of 30 over 16 generations, resulting in a total of 480 (30 × 16) simulation runs for error convergence. Table 2 lists the optimized variables used in the GA process, where Xmin and Xmax represent the lower and upper bounds of each variable, respectively. A notable limitation of this approach is the time required to generate the necessary scripting files when integrating HFSS with MATLAB. This can be mitigated by using high-performance systems, typically with more than 32 GB of RAM. Additionally, minor discrepancies between simulation and measurement results may arise due to fabrication and measurement tolerances. These variations are minimal and can be accounted for by incorporating performance margins during the simulation stage. Nevertheless, the observed deviations remain negligible and within acceptable performance thresholds.
| Parameter | Xmin (mm) | Xmax (mm) | Optimized values (mm) | |
|---|---|---|---|---|
| Without stacked | With stacked | |||
| L | 6.2 | 9.8 | 9.62 | 9.44 |
| Lm | 0.1 | 0.8 | 0.42 | 0.68 |
| Ln | 1 | 2.2 | 1.87 | 1.62 |
| TL | 3 | 4 | 3.68 | 3.38 |
| Tw | 0.5 | 2 | 1.34 | 1.52 |
fi = Frequency sweep points over i; = calculated reflection co-efficients from HFSS; = desired reflection co-efficients. i = lower limit of the frequency sweep points; k = upper limit of the frequency sweep points.
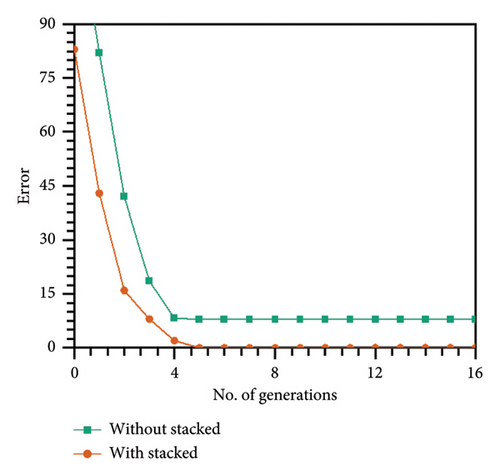
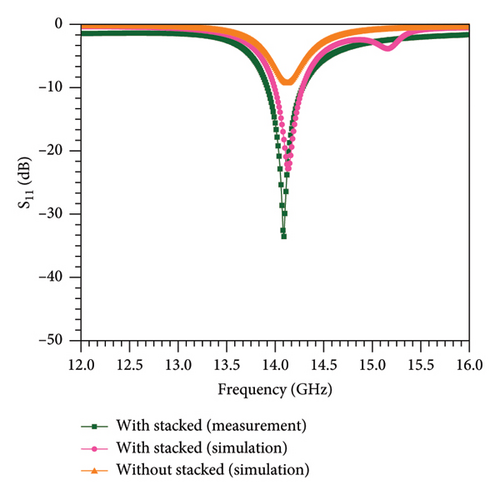
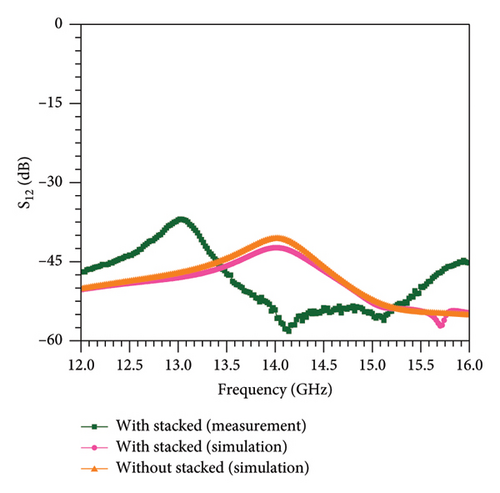
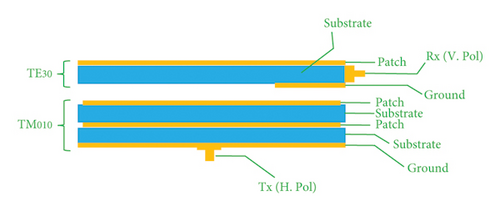
After deriving the multiobjective fitness function, the antenna design configuration shown in Figure 10 was optimized to meet the performance targets of achieving return losses below −10 dB for both Tx and Rx, along with a gain exceeding 3 dBi. The optimization process ran for 16 generations and concluded with an error value of E = 12.68, as shown in the error convergence profile in Figure 11. It is evident from the convergence plot that the error value stabilized after the fourth generation. However, the Tx return loss did not reach the desired −10 dB threshold; instead, it settled at −6 dB, as depicted in Figure 12(a). Although this level of return loss is acceptable for RF and microwave frequencies, a −10 dB or better return loss is generally preferred to maximize power transfer at higher frequencies. The suboptimal impedance matching can be attributed to the Tx antenna operating in the TM010 mode with a substrate thickness of only 0.254 mm. As noted in prior studies [19, 20], patch antennas inherently offer limited fractional bandwidth, and reducing substrate thickness tends to further constrain the bandwidth. Despite this limitation, the thinner structure provides advantages such as reduced weight, compactness, and ease of integration into onboard systems. To improve the Tx bandwidth and achieve the target −10 dB return loss, a stacked patch—also operating in the TM010 mode with horizontal polarization—was added over the rectangular patch, as illustrated in Figure 13. This modification resulted in rapid error convergence to zero by the fifth generation, as shown in Figure 11. From Figure 12(a), it is clear that the −10 dB return loss bandwidth for the Tx was successfully achieved. Additionally, the required isolation level of −40 dB was also met, as presented in Figure 12(b).
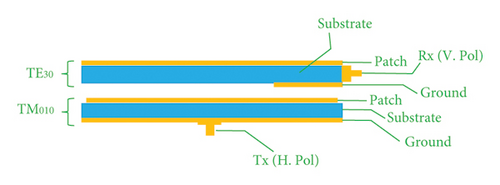
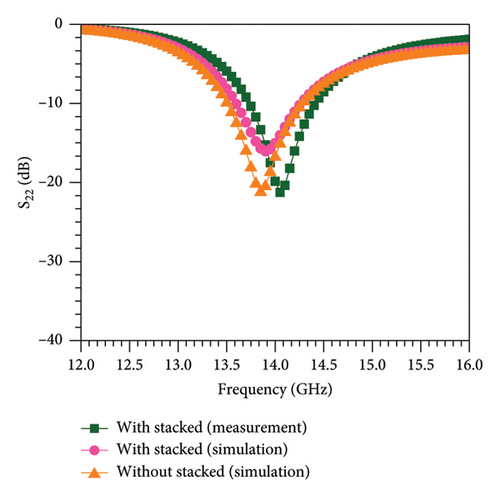
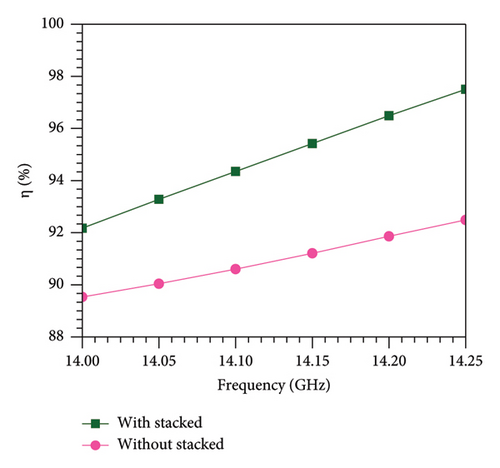
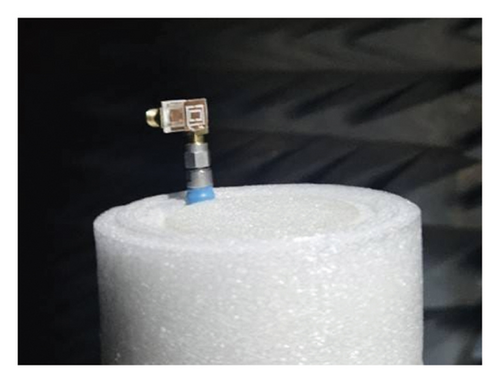
For the Rx antenna, the bandwidth under −10 dB return loss is presented in Figure 14(a) under vertical polarization. A comparison of radiation efficiency between the stacked and nonstacked configurations is shown in Figure 14(b). Simulation results indicate that the nonstacked configuration achieves a maximum radiation efficiency of 92.49% at 14.25 GHz, while the stacked configuration significantly improves this to 97.50% at the same frequency. Theoretical principles suggest that higher radiation efficiency correlates with increased gain; therefore, the stacked configuration was selected for prototype fabrication to validate the simulation outcomes through experimental measurements. This analysis demonstrates that optimizing the Rx bandwidth was comparatively straightforward, with the Rx antenna achieving a broader bandwidth than the Tx. The implemented GA effectively facilitated this performance improvement, enabling both high isolation between Tx and Rx antennas and adherence to the defined simulation objectives—an essential goal of this research. Following successful simulation-based optimization, the stacked configuration was fabricated for practical validation, as shown in Figures 15(a) and 15(b). The experimental setup used for S-parameter testing is depicted in Figure 16(a), while Figure 16(b) illustrates the radiation pattern measurement configuration. During testing, a standard two-port calibration was employed. A critical consideration during the measurement process involves the use of coaxial SubMiniature version A (SMA) connectors, whose overall width exceeds a quarter wavelength at 14 GHz, resulting in self-resonance. At this frequency, strong coupling between the connector and the patch can degrade the antenna’s radiation performance. To mitigate this effect, both the Tx and Rx SMA connectors were included in the calibration procedure.
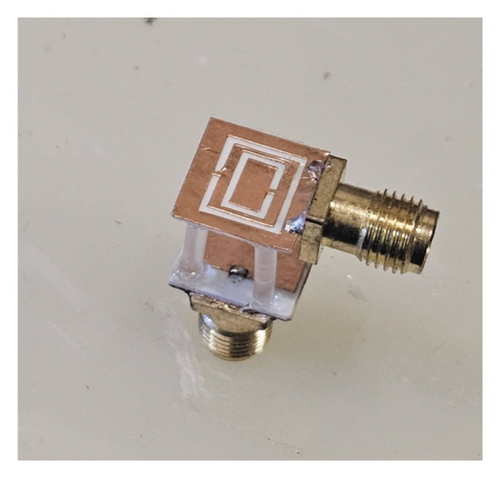
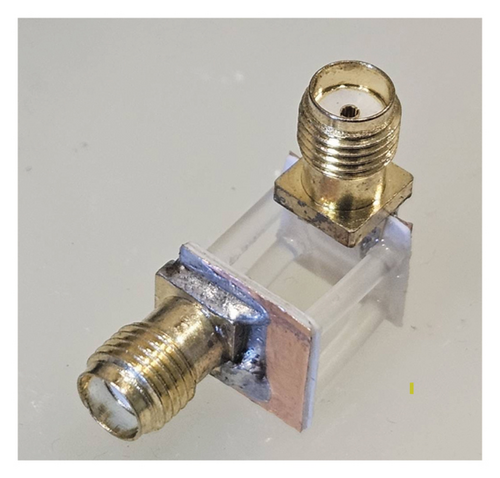
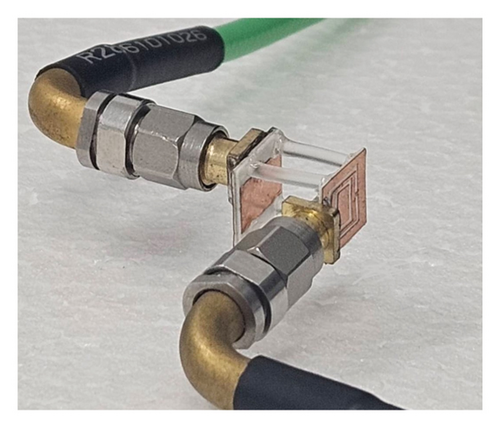
The fabrication of the proposed antenna requires a highly precise manufacturing process to ensure robustness, as the proposed antenna is very small in physical size (10 × 10 mm). Another critical aspect is its operating frequency band of 14–14.25 GHz, where the wavelength is very small. Even a slight variation in the patch dimensions can shift the resonance frequency away from the desired band. Similarly, small changes in the substrate thickness can change the effective dielectric constant, increasing discrepancies between the simulated and measured results. These challenges can be mitigated through a careful manufacturing process to minimize potential manual errors.
After completing the fabrication of the proposed antenna in the stacked configuration, the S-parameters of both the Tx and Rx were measured in open space using a vector network analyzer (VNA), and the measured Tx return loss was found to be below −10 dB within the desired frequency range of 14–14.25 GHz for horizontal polarization, as seen in Figure 12(a). Similarly, the measured return loss of the Rx was also below −10 dB (see Figure 14(a)), covering the same frequency range of 14–14.25 GHz under vertical polarization. Once the return losses of both the Tx and Rx were confirmed to be within the target range, the isolation (or transmission) between Tx and Rx was measured, as shown in Figure 12(b). The results revealed that the measured isolation was significantly improved, approximately 10 dB better than the target simulation results of −40 dB. The measured isolation from 14 to 14.25 GHz ranged from −55.14 dB to ∼−55.35 dB. These experimental results demonstrate that the proposed antenna effectively accomplished the research objective of achieving isolation between the Tx and Rx by integrating two different modes of antennas with distinct polarizations, all without the need for any additional decoupling structures.
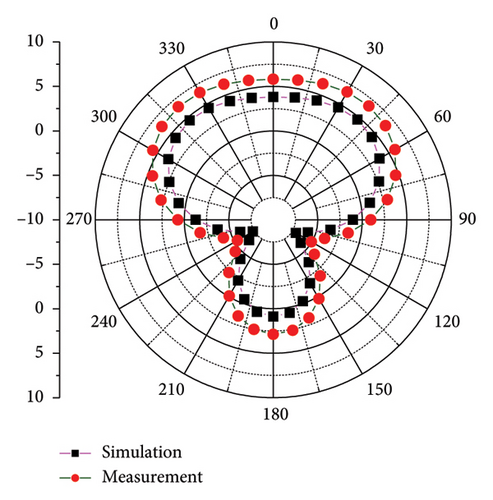
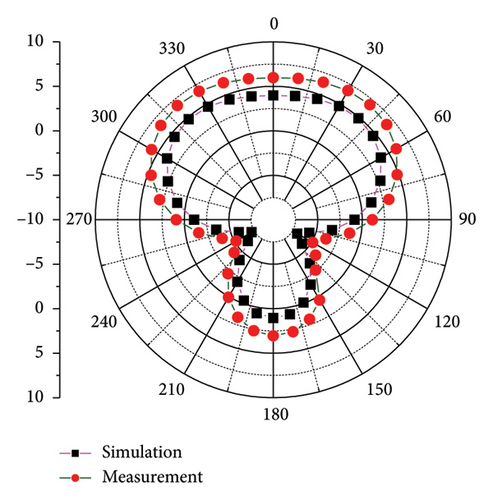
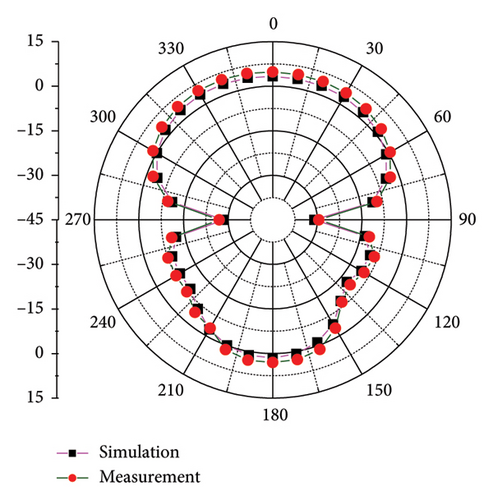
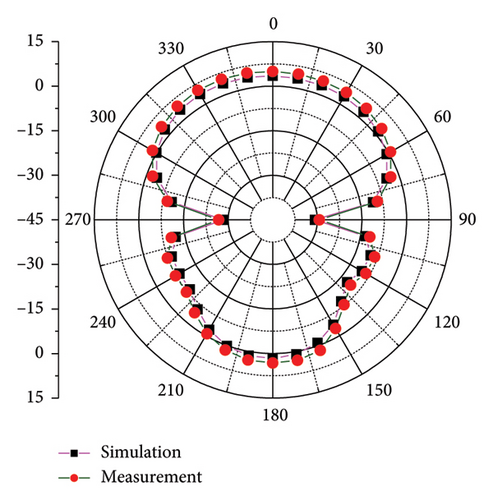
Radiation pattern is a critical performance characteristic used to describe the direction of maximum radiation intensity in an antenna. To evaluate the radiation characteristics of the proposed dual-polarized antenna in its stacked configuration, gain radiation patterns were measured in an anechoic chamber. Measurements were conducted over θ = 0°–360° at φ = 0°, and results were compared with simulations at 14 GHz and 14.25 GHz, as shown in Figures 17(a) and 17(b). The measured patterns in the E-plane exhibited strong directionality between θ = 300° and 60° in the clockwise direction. Similarly, H-plane measurements at φ = 90°, shown in Figures 18(a) and 18(b), revealed peak radiation intensity around θ = 0°, with notable directionality spanning θ = 300°–60° and θ = 150°–210°. From this analysis, it is evident that the E-plane radiation pattern exhibits a directional span of approximately 120°, while the H-plane demonstrates a broader directional spread of around 180°, indicating wide directional characteristics. Finally, peak gain measurements were conducted and compared with simulation results for both stacked and nonstacked configurations, as illustrated in Figure 19. The difference in peak gain between the two configurations was found to be minimal, with a variation of less than 1 dBi. Furthermore, the measured data closely followed the simulated trends across the frequency range of 14–14.25 GHz. The maximum measured peak gain at 14.25 GHz was approximately 5.92 dBi, while the minimum gain at 14 GHz was around 5.3 dBi. Given that the optimization target was a minimum gain of 3 dBi, the measured gain exceeds this target by approximately 1.5 dB, thereby satisfying the performance requirements of the proposed antenna design.
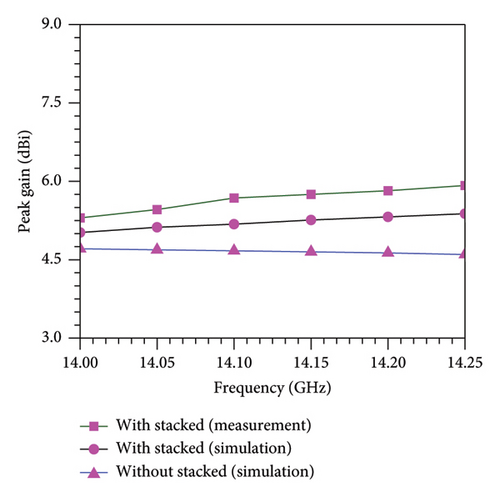
Following the performance evaluation of the proposed antenna, a comprehensive quantitative analysis for both configurations was conducted, as summarized in Table 3. This analysis spans the frequency range from 14 to 14.25 GHz, with a step size of 50 MHz. To highlight the advantages of the proposed design—particularly its ability to provide high isolation between the Tx and Rx ports without degrading other key performance metrics—a comparative study was performed against recent works published over the past two to 3 years, as shown in Table 4. From this comparison, it is evident that the proposed antenna offers superior performance, achieving an isolation level exceeding −50 dB, which is significantly higher than those reported in the literature. It is important to note that the isolation values presented in Table 4 are expressed in absolute terms. A notable contribution of this research is that the proposed antenna does not rely on any additional decoupling structures or parasitic elements. Instead, it achieves high isolation through the integration of two patch antennas operating in distinct modes and orthogonal polarizations. This approach simplifies the design, avoids the added complexity associated with decoupling structures, and reduces both fabrication time and cost. Given these advantages, the proposed design is a promising solution for the future development of large-scale array antennas intended for low Earth orbit (LEO) satellite communication systems operating in the Ku band.
| f (GHz) | Without stacked (simulation) | With stacked (simulation) | With stacked (measured) | |||||||||||
|---|---|---|---|---|---|---|---|---|---|---|---|---|---|---|
| S11 (dB) | S22 (dB) | Isolation (dB) | η (%) | Gain (dB) | S11 (dB) | S22 (dB) | Isolation (dB) | η (%) | Gain (dB) | S11 (dB) | S22 (dB) | Isolation (dB) | Gain (dBi) | |
| 14 | −6.87 | −16.78 | −40.65 | 89.53 | 4.71 | −10.36 | −15.03 | −42.35 | 92.17 | 5.02 | −15.58 | −19.86 | −54.14 | 5.3 |
| 14.05 | −8.23 | −15.09 | −40.68 | 90.04 | 4.69 | −13.89 | −14.03 | −42.39 | 93.28 | 5.12 | −22.84 | −21.25 | −55.64 | 5.46 |
| 14.1 | −9.02 | −13.66 | −40.88 | 90.6 | 4.67 | −19.55 | −12.98 | −42.57 | 94.33 | 5.18 | −29.9 | −20.37 | −57.73 | 5.68 |
| 14.15 | −9.17 | −12.45 | −41.24 | 91.21 | 4.65 | −21.96 | −11.98 | −42.88 | 95.42 | 5.26 | −18.7 | −18.2 | −58.21 | 5.75 |
| 14.2 | −8.22 | −11.42 | −41.74 | 91.86 | 4.63 | −15.2 | −11.07 | −43.29 | 96.49 | 5.32 | −14.06 | −16.03 | −56.99 | 5.82 |
| 14.25 | −6.94 | −10.53 | −42.34 | 92.49 | 4.6 | −11.77 | −10.24 | −43.79 | 97.50 | 5.38 | −11.29 | −14.17 | −55.35 | 5.92 |
| Reference | Published year | Antenna size (mm) | Isolation enhancement method | Frequency (GHz) | Isolation (dB) |
|---|---|---|---|---|---|
| [21] | 2023 | 80 × 80 | Complementary split ring resonator structure | 3.20–3.80/4.80–5.00 | < 25 |
| [22] | 2024 | 27 × 22 | Decoupling technique (stepped EBG, stub, and slot) | 3.07–11.10 | < 20 |
| [23] | 2023 | 87 × 60 | Decoupling technique (parasitic structure with DGS) | 5.80 | 22–43 |
| [24] | 2024 | 120 × 110 | Decoupling technique | 2.40 | < 15 |
| [25] | 2024 | 55 × 22 | Decoupling technique (stepped EBG) | 22.00–27.00 | < 28 |
| [26] | 2023 | 35 × 35 | Decoupling technique, defected ground structure | 24.00–40.00 | < 28 |
| [27] | 2023 | 25.8 × 17.6 | Decoupling technique, defected ground structure | 3.6.00–3.7.00 | < 28 |
| [28] | 2023 | 40 × 40 | Orthogonal feeding method | 3.10–10.60 | < 20 |
| [29] | 2024 | 40 × 81.76 | Decoupling technique (parasitic structure) | 1.50–2.10 | < 17 |
| [30] | 2024 | 80 × 110 | Decoupling technique (T-shaped stub) | 2.40/3.60 | < 20 |
| Proposed antenna | NA | 10 × 10 | TM010 and TE30 modes with distinct polarizations | 14.00–14.25 | 54.14–55.35 |
5. Conclusion
A novel method has been proposed to enhance the isolation in patch antennas by integrating two distinct operating modes under dual polarization. The proposed antenna operates in the frequency range of 14–14.25 GHz, and its performance has been measured and validated practically. Initially, a rectangular patch antenna was designed to operate in the TM010 mode with horizontal polarization, acting as the transmitter (Tx). Simultaneously, a slot antenna was designed in the TE30 mode with vertical polarization for the receiver (Rx). Both antennas were then combined, with orthogonal inputs applied to maintain dual polarization. However, the Tx antenna exhibited insufficient bandwidth, which were compensated by adding a stacked patch operating in the same TM010 mode. Then, the stacked dual-polarized antenna was fabricated and tested, yielding a measured return loss bandwidth of −10 dB. Following successful impedance matching under dual polarization, the isolation between the Tx and Rx antennas was measured and found to be below −54.14 dB within the frequency range of 14–14.25 GHz. The radiation patterns from both simulations and measurements showed strong agreement. In the E-plane, the maximum radiation span was approximately 120° (from 360° to 60°), while in the H-plane, the maximum intensity range was about 180° (from 360° to 60° and from 150° to 210°). The measured peak gain of the antenna is greater than 5 dBi across the operating frequency band. In summary, the proposed antenna achieved its design goal of providing high isolation between Tx and Rx, as required for the application. This method, due to its simplicity and reduced design complexity compared to existing techniques in the literature, presents a promising solution for future large-array designs intended for Ku-band applications, particularly in LEO satellite communication systems.
Conflicts of Interest
The authors declare no conflicts of interest.
Funding
No funding was received for this manuscript.
Acknowledgments
The authors would like to thank Prof. Yu-Jen Chi from Tamkang University, Taiwan, for his valuable discussion and insightful suggestions during the revision process of this research.
Open Research
Data Availability Statement
The data that support the findings of this study are available from the corresponding author upon reasonable request.


