Low Profile and Multiband Antenna Based on Binary Encoding and Multiobjective Optimization With Artificial Intelligence
Abstract
This paper presents a low profile and multiband antenna based on binary encoding and multiobjective optimization using artificial intelligence (AI). The antenna adopts a single-arm helical structure on the top layer and two metal parasitic middle layers above the ground. The parasitic layers are composed of 10 × 10 rectangular squares, being similar as a chessboard, and they are coded as two sets of binary sequences, respectively, according to whether there is a metal sheet at the corresponding position. The multiobjective optimization to binary coding antenna with multiple effective bands, low profile, and high gains is carried out with three steps. Firstly, the discretized parameters are converted into continuous parameters, and the crude model of the antenna is optimized. Secondly, optimization algorithms under different weight assignments to the goals are applied to optimize the antenna and produce a large amount of sample data. AI is introduced to learn and train the model and then produce a large amount of sample data, and we finally get the optimal antenna structure that satisfies the multiobjective performance. The optimized prototype of the antenna is manufactured, and its impedance is well matched with the bandwidth of 1.43–2.494 GHz and 4.62–6.75 GHz. The measured maximum gain of prototype is 7.5 dBi with 10.98%λ for profile.
1. Introduction
With the explosive development of modern information transmission and wireless communication, novel efficient antennas are in urgent need. In one terminal or mobile vehicle, functions such as GPS, BeiDou navigation satellite system (BDS), Wi-Fi, WLAN, and wireless communication are required to support its multifunction. Usually, each system works in the independent frequency band with its own antenna, and several antennas are mounted together on one carrier, but the coupling and interference between these antennas are inevitable. In another side, conformal antenna with a low profile is very useful to reduce air resistance and maintain a beautiful appearance of the moving carrier, so a shared aperture antenna with a low profile over these bands is necessary.
The multiband antenna is primarily determined by the resonant characteristics of the radiating elements. This can be achieved through a combination of resonant structures of different sizes, by introducing slots or gaps in a single resonant structure to obtain multiple operating frequency bands, or by directly using an ultra-wideband (UWB) radiating structure. Subsequently, broadband impedance matching for the antenna is realized through the feed structure by introducing multiband or broadband matching.
The profile of a directional radiation antenna is mainly constrained by the antenna type and the reflection structure. For most dipole radiation structures, achieving directional radiation with the influence of reflective structures (such as the ground floor) is equivalent to placing a horizontal current above the ground surface. This requires a spacing of about a quarter-wavelength between the current and the ground to offset the ground’s mirror image. To address this, many people introduce layers such as artificial magnetic conductors (AMC) or high-impedance surface (HIS) to form an equivalent magnetic wall and thereby reduce the profile height. However, the characteristics of these equivalent magnetic walls formed based on resonance, such as AMC or HIS, vary significantly with frequency, while there is a limited operational bandwidth.
Furthermore, some researchers have achieved broadband low-profile directional radiation antennas by introducing heterogeneous surfaces under the radiating element. Structure-like cavity-backed spiral antenna is preferred to achieve the wide band [1, 2]. In addition, rough surface like composite corrugated reflector is preferred to have HIS to get the UWB antenna [2, 4, 5]. However, both the heterogeneous surface and rough surface structures are quite complex and difficult to manufacture.
Additionally, some researchers introduced the method of binary coding optimization design for the optimal antenna [6]. As a result, others have used binary coding structures to find the optimal antenna structure to achieve low-profile directional radiation heterogeneous surfaces [7, 8]. It has been applied in millimeter-wave dual-polarized antenna [9]. However, the optimization methods to design antenna have always been unable to solve the issue of weight allocation among multiple objectives in multiobjective optimization and the result may only be a locally optimal structure under a certain weight distribution, especially when there remains a contradiction between the effective operating bandwidth and the antenna profile height.
Recently, with the rapid development of artificial intelligence (AI) technology, AI has also been used in antenna design [10]. The AI-based antenna design software mentioned in [11] can help designers quickly explore different design schemes and obtain optimized antenna structures [12]. People use PIFA [13], patch [14], monopoles [11], multiband spiral antennas [15], and arrays [16] as design prototypes and then optimize them through simulation software such as CST and IE3D to obtain a large amount of data. Then, AI models are trained and learned through machine learning algorithms such as ANN and SVM [17] to accelerate the rapid design of antennas. Especially for the optimization design of multiobjective antennas, it is generally necessary to introduce multiobjective optimization algorithms. Of course, at present, antenna optimization using AI technology mainly focuses on optimizing the size of existing antenna models, which requires prior knowledge from humans to construct the initial model and maybe not the optimal antenna.
This paper adopts a single-arm helical structure to easily achieve broadband and multifrequency radiation. At the same time, low-profile and broadband upward directional radiation is achieved by introducing two layers of binary-coded parasitic structures between the radiating element and the ground plane. In fact, the objective antenna design is multiobjective optimization to binary coding antenna with multiple effective bands, low profile, and high gains, which is carried out with several steps. In the design of the binary-coded structure, the introduction of the discretization function and rounding function allows all parameters, including the distribution parameters of the binary coding, to be continuously optimized within a given range using a general optimization algorithm. After a preliminary optimization, a crude antenna model is achieved. Then, optimization algorithms under different weight assignments to the goals are applied to optimize the antenna and produce a large amount of sample data. Furthermore, the AI method is introduced to learn and train the model and finally solve the multiobjective performance optimization problems of the proposed antenna. The optimal antenna structure that satisfies the multiobjective performance can be ultimately discovered through AI model crowdsourcing.
The designed antenna prototype can work over 1.43∼2.494 GHz and 4.62∼6.75 GHz. It achieves almost entirely upward directional radiation with gains mostly exceeding 4 dBi, fully meeting the requirements for GPS, BDS, Wi-Fi, WLAN, and wireless communication.
The structure of the remaining of the paper is arranged as follows. Section 2 presents the antenna structure, the binary coding method, and the AI optimization design, along with the optimal design prototype. Section 3 provides the actual test results of the antenna prototype to demonstrate the feasibility of the design method. Section 4 summarizes the paper.
2. Antenna Geometry Structure and Optimization
In the designing of an optimal antenna that meets performance requirements for multifunctional targets such as GPS, BDS, Wi-Fi, WLAN, and wireless communication, as well as for the compact low-profile conformal installation, it is a problem that troubles many people. Here, we introduce the binary coding optimization method and construct a multiobjective antenna optimization model based on the binary coding method and AI.
2.1. Antenna Structure
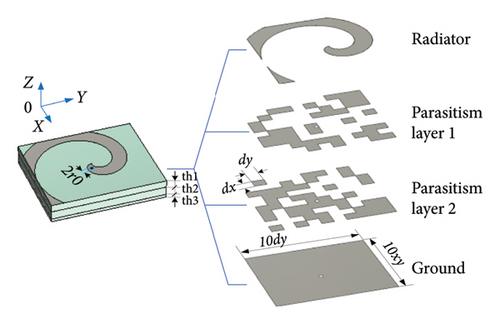
Considering the natural broadband characteristics of the spiral structure, a single-arm equiangular helix is introduced as the radiating element to meet the requirements for multiband. Also, to reduce the profile while maintaining broadband impedance matching characteristics, a reflective ground plane based on the concept of a rough reflector is introduced. Between the ground surface and the radiating element, two parasitic layers with discretized rectangular metal sheets or spaces are inserted. The distribution of small metallic rectangular patches in the parasitic layers and the distances between the layers are determined through optimization.
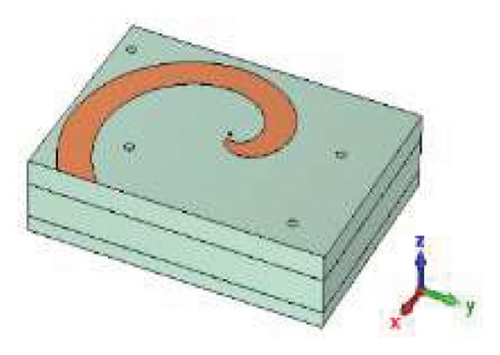
The configuration of the proposed antenna is shown in Figure 1. There are four metal layers and three medium layers. The two parasitic metal layers and ground have dimensions of length 10dx and width 10 dy, Each of the two parasitic layers consists of 10 × 10 rectangular square with size lengths dx × dy. The top radiator is one single arm of logarithm spiral (with angle width alpha) and a circle patch (with radius r0) that connects the inner wire of the feeding coaxial wire. The dielectric medium is Fr4 which has a relative permittivity of 4.3. From the top to bottom, the thicknesses of the medium layers are th1, th2, and th3, respectively.
2.2. Antenna Modeling Based on Binary Encoding
Generally, the coupling between the radiator and the ground floor often results in a narrower bandwidth and reduces gain to achieve a low-profile antenna that can be mounted on a metal ground plane (or the metal casing of a carrier). Therefore, it is challenging to balance between low profile and wide bandwidth.
On the other hand, there is research indicating that a quarter-wavelength distance between the reflector and the radiating element can effectively suppress the coupling between them, but for planar structures, this can only be achieved in a narrow band, though the distance can be effectively reduced with the introduction of HIS [1, 18]. Subsequently, it is found that the impedance bandwidth and directional radiation bandwidth of up to twice [2, 7, 8] or even five times [4] can be achieved under specific rough surface structures for broadband radiating elements when the introduced ground surface is a rough surface. The antennas above indicate that specific structures can achieve broadband directional radiation with a low profile. As a result, the binary-coded parasitic structural layers between the broadband radiating element and the ground plane are introduced to change the operation mode of antenna, therefore achieving broadband directional radiation.
2.2.1. Binary Coding of the Parasitic Layer
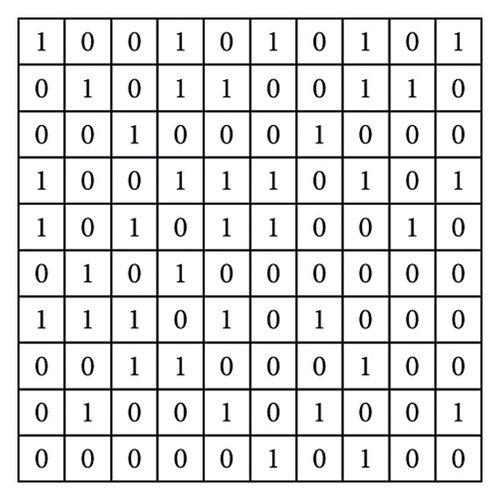
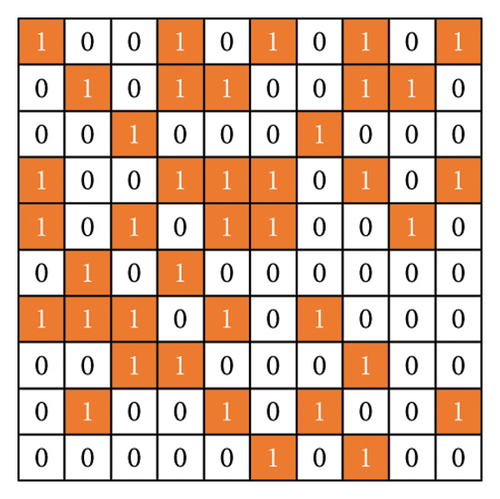
As shown in Figure 2, the parasitic layers with the digit-coding structures consist of 10 × 10 grids with the size of dx × dy and are initialized with random values. The state of each grid is determined by a binary code, where the binary code “1” represents the metal sheet and “0” represents air for the condition.
2.2.2. Transform the Two-Level Encoding Sample (Discretization Parameter) Into a Continuous Optimization Parameter
Usually, the optimizer can easily search for continuously changing parameters within a given range of values, but it is more difficult to search for discretized parameters. Binary encoding is a typical discrete parameter value. Thus, we need to convert this discrete binary encoding parameter into a continuously optimizable one.
Here, it means that the grid (i,j) is filled by metal patch when w(i, j) = int(g(i, j)) = 1, otherwise blank.
So, we can optimize the parameter g(i, j) in 0.9∼1 to get the rounding weights w(i, j), which corresponding to the metal patch distribution.
The S parameter and the circular polarization are set as the aim optimization function. The optimization of g(i, j) sample can be achieved through the particle swarm optimization (PSO) method built-in the CST Microwave Studio software.
2.2.3. Continuous Parameter Optimization to Multiobjectives
Here, Wi is the allocated weights to different objectives, Pi is the ith objective function, and the general objective is P to reach minimum value, or 0. P0 is the simple sum of objectives with same weights of 1.
2.3. Analysis of the Weights’ Allocation Based on Optimization
For the multiobjective problem, how to choose the weights is the key to the optimum results and optimization speed.
Here, we optimize the antenna with two steps, the first is the rough optimization with same weights, and then continue to the second step to different weights distribution but limit the sum of the weights to 7 to about 30 rounds optimization with different weight allocations, which includes more than 10,000 times EM computation. Then, the optimization data including the weights are introduced to train the AI model with Random Forest Regressor and then to predict the optimum parameter values of the antenna model.
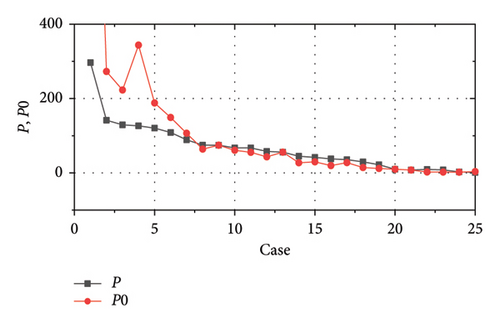
In the second step, 25 optimized cases with different weight assignments are presented in Table 1 For each case, approximately 500 electromagnetic computations are performed for optimization using the genetic algorithm (GA) or particle swarm optimization (PSO).
| Case | w1 | w2 | w3 | w4 | w5 | w6 | w7 | P0 | P |
|---|---|---|---|---|---|---|---|---|---|
| 1 | 5.8 | 0.2 | 0.2 | 0.2 | 0.2 | 0.2 | 0.2 | 296.63 | 1497.74 |
| 2 | 2 | 2 | 0.6 | 0.6 | 0.6 | 0.6 | 0.6 | 141.70 | 272.72 |
| 3 | 1.8 | 1.8 | 0.68 | 0.68 | 0.68 | 0.68 | 0.68 | 129.30 | 223.07 |
| 4 | 3 | 3 | 0.2 | 0.2 | 0.2 | 0.2 | 0.2 | 126.64 | 343.8 |
| 5 | 1.6 | 1.6 | 0.76 | 0.76 | 0.76 | 0.76 | 0.76 | 120.40 | 188.22 |
| 6 | 1.4 | 1.4 | 0.84 | 0.84 | 0.84 | 0.84 | 0.84 | 108.79 | 149.15 |
| 7 | 1.2 | 1.2 | 0.92 | 0.92 | 0.92 | 0.92 | 0.92 | 89.09 | 106.56 |
| 8 | 0.7 | 0.7 | 1.12 | 1.12 | 1.12 | 1.12 | 1.12 | 74.81 | 64.08 |
| 9 | 1 | 1 | 1 | 1 | 1 | 1 | 1 | 74.56 | 74.56 |
| 10 | 0.9 | 0.9 | 1.04 | 1.04 | 1.04 | 1.04 | 1.04 | 67.29 | 60.76 |
| 11 | 0.8 | 0.8 | 1.08 | 1.08 | 1.08 | 1.08 | 1.08 | 67.09 | 55.40 |
| 12 | 0.6 | 0.6 | 1.16 | 1.16 | 1.16 | 1.16 | 1.16 | 57.92 | 43.23 |
| 13 | 1 | 1 | 1 | 1 | 1 | 1 | 1 | 55.85 | 55.85 |
| 14 | 0.5 | 0.5 | 1.2 | 1.2 | 1.2 | 1.2 | 1.2 | 44.94 | 27.27 |
| 15 | 0.2 | 0.2 | 1.32 | 1.32 | 1.32 | 1.32 | 1.32 | 41.84 | 29.83 |
| 16 | 0.4 | 0.4 | 1.24 | 1.24 | 1.24 | 1.24 | 1.24 | 37.72 | 19.69 |
| 17 | 0.4 | 1.1 | 1.1 | 1.1 | 1.1 | 1.1 | 1.1 | 35.69 | 27.772 |
| 18 | 0.3 | 0.3 | 1.28 | 1.28 | 1.28 | 1.28 | 1.28 | 29.84 | 14.50 |
| 19 | 0.25 | 0.25 | 1.3 | 1.3 | 1.3 | 1.3 | 1.3 | 21.95 | 11.966 |
| 20 | 1 | 1 | 1 | 1 | 1 | 1 | 1 | 9.78 | 9.78 |
| 21 | 1 | 1 | 1 | 1 | 1 | 1 | 1 | 7.75 | 7.75 |
| 22 | 0.1 | 0.1 | 1.36 | 1.36 | 1.36 | 1.36 | 1.36 | 9.41 | 2.45 |
| 23 | 0.05 | 0.05 | 1.38 | 1.38 | 1.38 | 1.38 | 1.38 | 8.10 | 2.24 |
| 24 | 0.01 | 0.01 | 1.396 | 1.396 | 1.396 | 1.396 | 1.396 | 2.738 | 1.959 |
| 25 | 0 | 0.002 | 0.002 | 0.009 | 3.466 | 0.054 | 3.466 | 1.195 | 3.588 |
In Figure 3(a), all these stimulation cases are arranged according to the minimum values of the objective functions with different assignments of weights from big to small, and the corresponding values of the objective functions with same weights are presented too. It can be seen both the optimization with weight assignments and the optimization without the weight assignments share the similar trend basically when the minimum value of objective functions come to around 100.
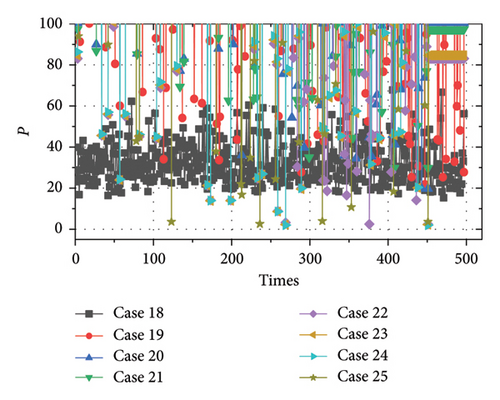
Furthermore, various curves of the objective function during the optimization of the last eight cases are given in Figure 3(b). Due to the application of binary coding and continuous optimization of g(i, j) at the same time, parasitic structure varies greatly during the optimization as a result, so that the value of objective function vibrates greatly. This is just the character of binary coding optimization. In Figure 3(b), the first obvious minimum point of objective function of case 25 emerges at the 123 time, and another minimum point of objective function first emerges at the time of 239 for case 24. Similarly, to other cases, the first minimum point of objective functions also appears in the middle of the optimization process. It can be seen that the weight assignments can accelerate the optimization process as it spends less time to get lower goal-sum-weight.
The trained AI model to predicts the EM performance of the proposed antenna is equivalent to the EM computation to the antenna. To increase the prediction efficiency, the 9 continuously varying size parameters are considered to crowdsource, and 117,661,005 examples are predicted with the trained AI model at the cost of 4 h and 50 min. Then, the optimum antenna model is found from the AI model crowdsourcing results and data, which is verified by CST stimulation again, and the corresponding values of the objective function P0 and P are 1.1 and 0.136, respectively. It is noted that the prediction and optimization process of multiobjective antennas based on AI models basically solves the multiobjective optimization problem of antennas, and the speed is much faster than the traditional optimization design antenna process.
2.4. Key Parameter Analysis
During the stimulation and optimization of antenna design, the sizes dx and dy of the small rectangular sheet are the key parameters to the antenna performance, and they are analyzed in the following.
2.4.1. dx
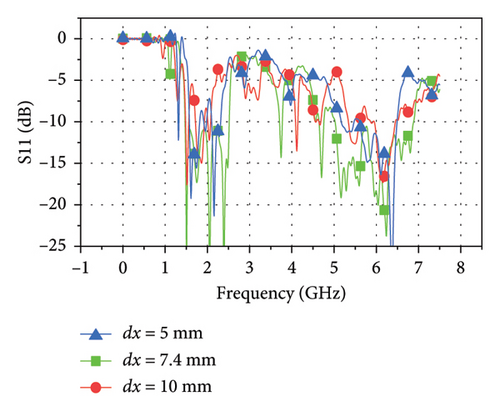
With the parameter dx varying from 5 mm to 10 mm, the S parameter curves are given in Figure 4(a). Similar situations occur in dx. When dx = 5, it can be observed that the S parameter with the magnitude larger than −10 dB in both low frequency and high frequency is limited into some discontinuous bands. As dx increases to 7.5 mm, the available bands range from 1.47 GHz to 2.5 GHz in the lower frequency band and from 5 GHz to 6.88 GHz in the higher frequency band. The available bands degenerate into a few frequency points again when dx increases to 10 mm.
2.4.2. dy
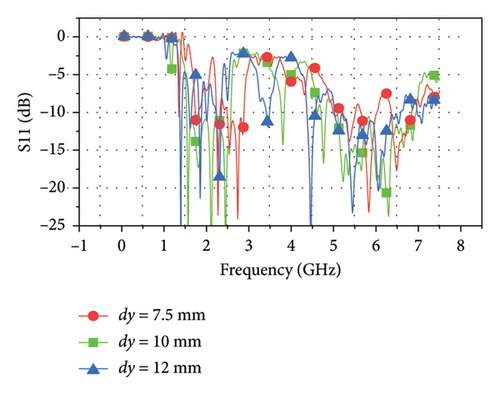
With the parameter dy varying from 7.5 to 12 mm, the S parameter curves are compared in Figure 4(b). When dy = 7.5 mm, the S parameter with magnitude large than −10 dB in both low frequency and high frequency is limited into some discontinuous bands. As dy increases to 10 mm, the available bands range from 1.47 to 2.5 GHz in the lower frequency band and from 5 to 6.88 GHz in the higher frequency band, with the bands shifts to higher frequency. Again, the S parameter gets worse when it comes to dy = 12 mm.
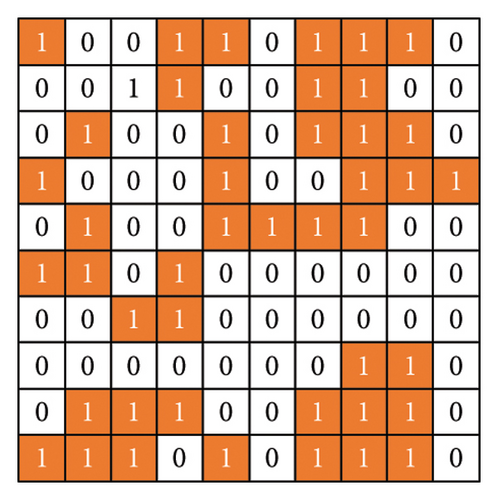
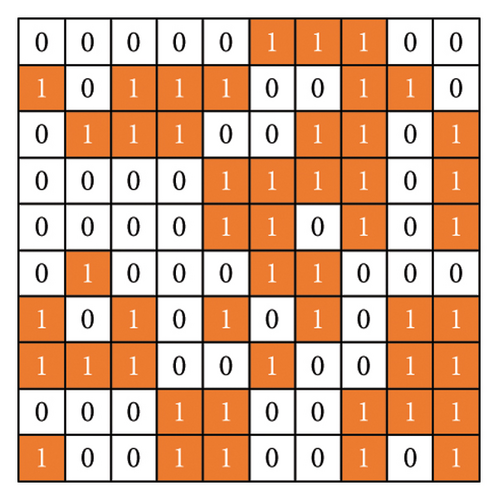
The accuracy of the best antenna model predicted by AI is proven by the analysis to the key parameters once again. The parameters of the best antenna are dx = 7.4 mm, dy = 10 mm, r0 = 1 mm, alpha = 75.3° (angle width of the logarithm spiral arm), th1 = 5 mm, th2 = 11 mm, and th3 = 7 mm. The optimized binary coding of parasite layers is shown in Figure 5.
3. Experiment Result Analysis
3.1. Antenna Prototype
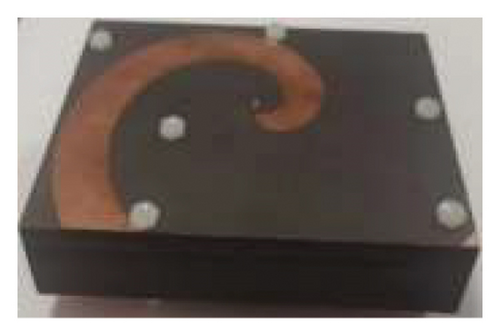
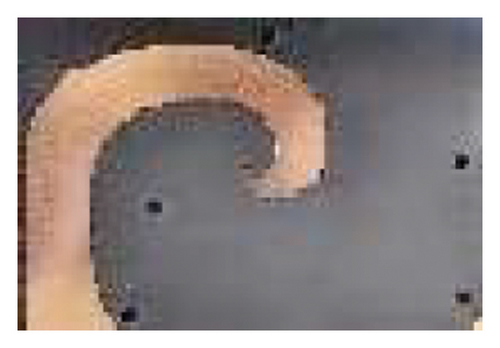
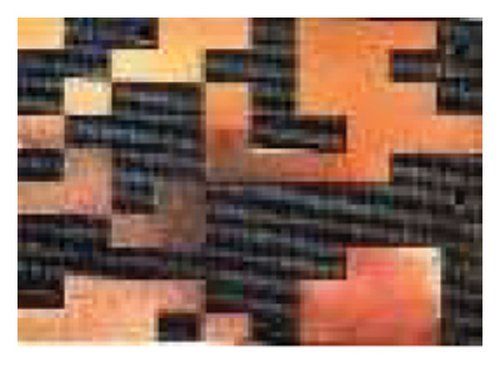
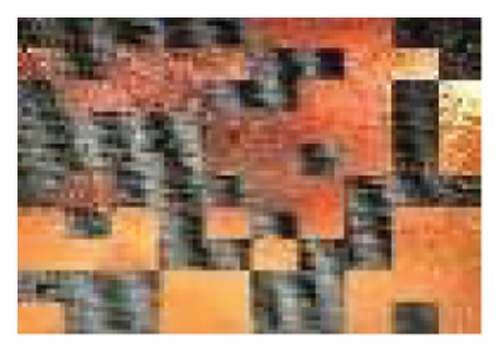
According to the optimized values of the parameters, the antenna prototype is manufactured as shown in Figure 6, and the top radiator, parasitic layers with distributed metal sheets, ground, and the middle Fr4 layers are connected by six nylon screws. The antenna is fed by a coaxial wire from the back side.
3.2. Measured S11
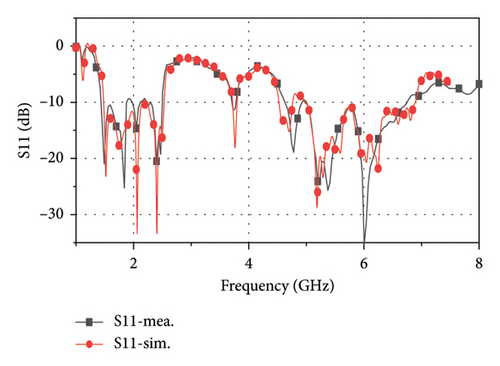
The antenna prototype is measured by the Key-sight vector network analyzer E8361. The measured S11 and simulated S11 curves are shown in Figure 7, and they are very close to cover almost all civil bands of GPS, BDS, wireless communication, and Wi-Fi. The experimental impedance band with |S11| < −10 dB covers both the lower and higher frequency bands. The lower band ranges from 1.43 to 2.494 GHz except for the frequency ranges of 1.9∼2.1 GHz and 2.1∼2.2 GHz where |S11| < −9 dB. The higher frequency band ranges from 4.62 to 6.75 GHz, except for the frequency range of 4.95∼5 GHz where|S11| < −9 dB.
3.3. Measured Gain
The measured gain and simulated gain curves are shown in Figure 8, and they share little differences in the lower band, as they all have the main upward direction in directivity and the similar magnitude for gain in the curve. But the measured gain demonstrates a drop from 4.5 to 7 GHz. And gain of most of the operation band is over 4 dB except for wireless communication band around 2 GHz. The maximum gain is from 1.75 to 2.25 GHz with 7.5 dB, and the maximum gain is at 4.6 GHz with 6.6 dBi.
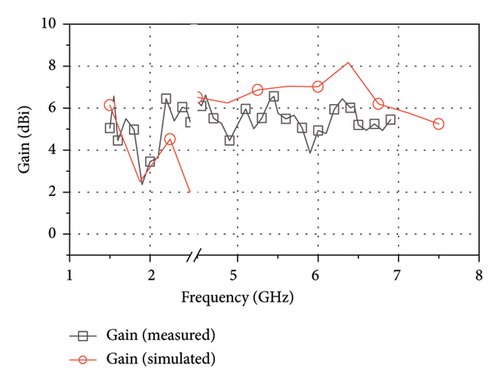
Generally, there is little difference for the trend between measured and simulated gains. However, it can be observed that measured gain is relatively higher than the stimulated gain in lower frequency band while the situation gets opposite in higher frequency band. For the error analysis, the high gain in lower band may be the reason of the reflection of the cable. As for higher frequency bands, it may be due to the error of manufacture and large loss tangent from the medium Fr4.
3.4. Measured Far Fields
The measured far fields at different frequencies over the impedance band are demonstrated in Figure 9. It can be observed that the direction of most of the operation band is upward around z axis with little difference shared between the measured and stimulated results. However, at 4.7 and 5.8 GHz, it can be observed that there is relatively larger difference, which can be considered as the result of the measurement error and environmental error.
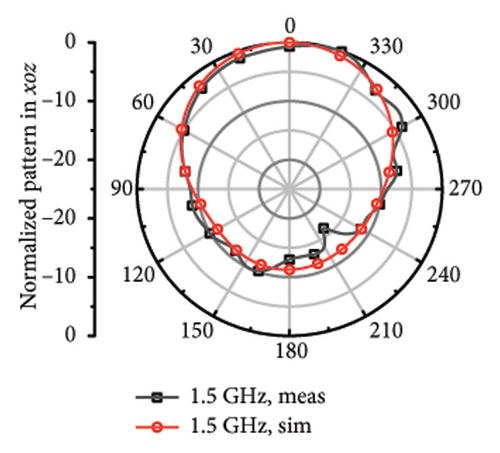
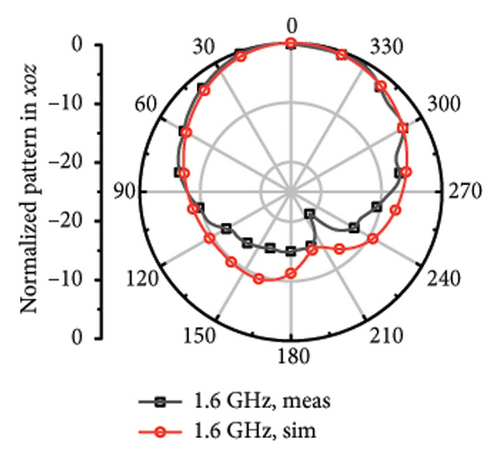
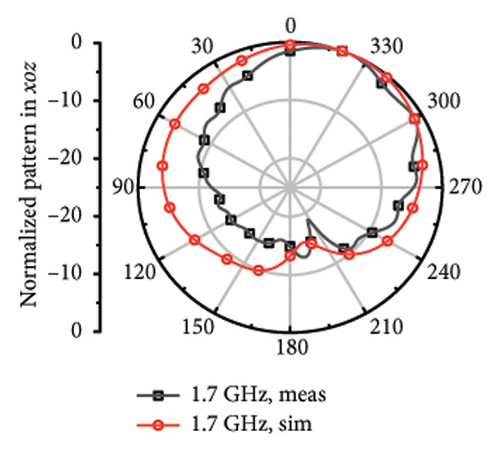
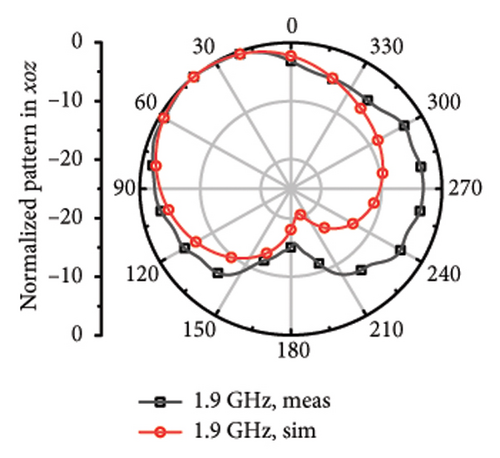
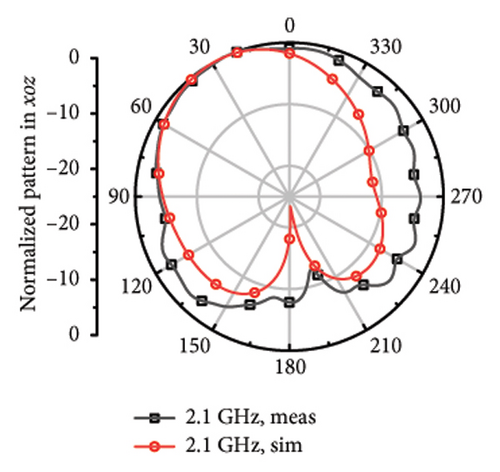
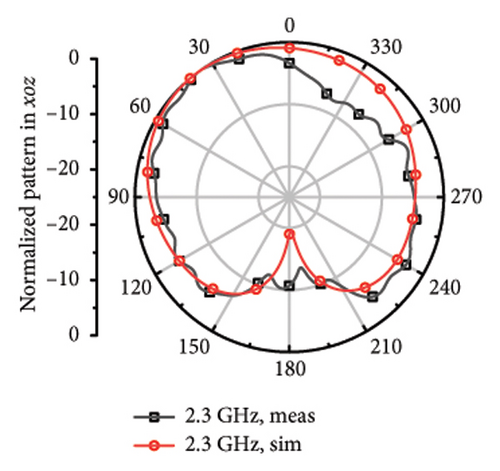
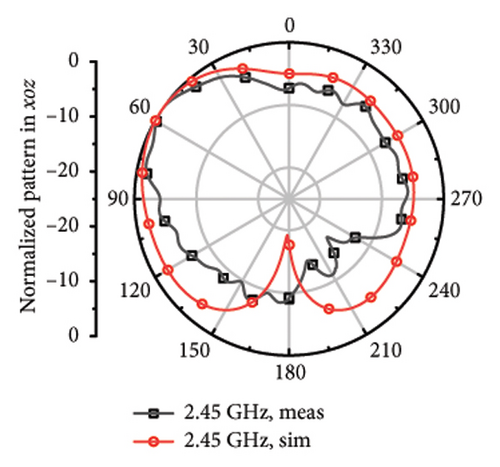
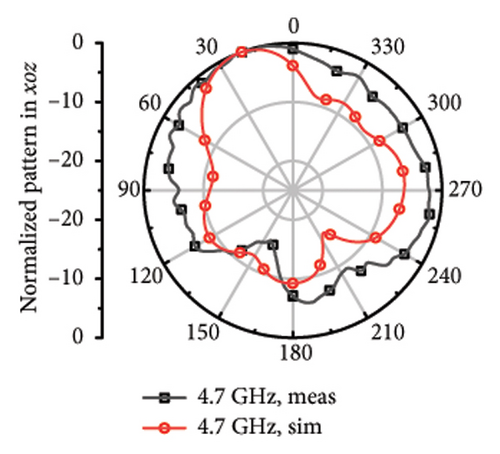
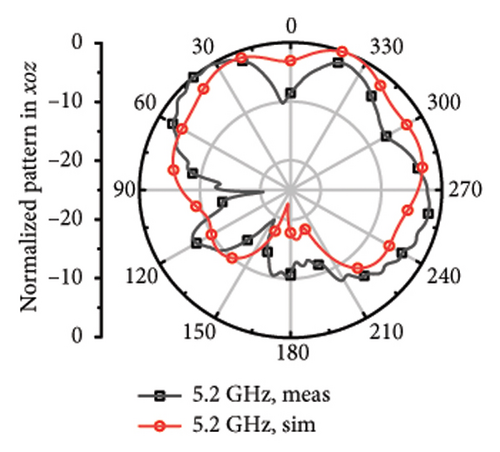
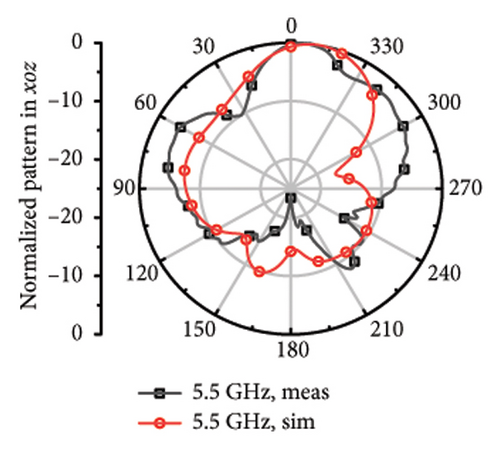
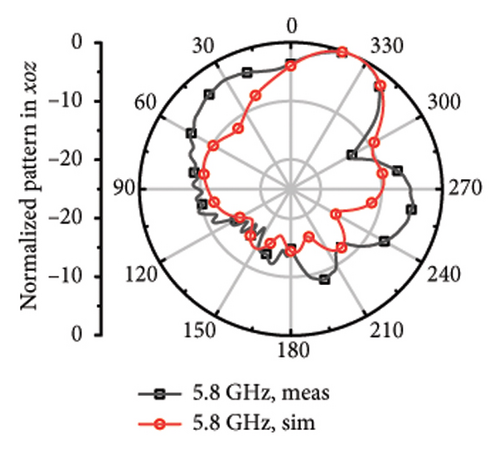
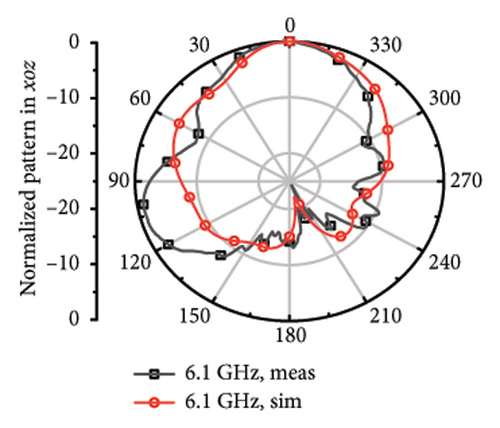
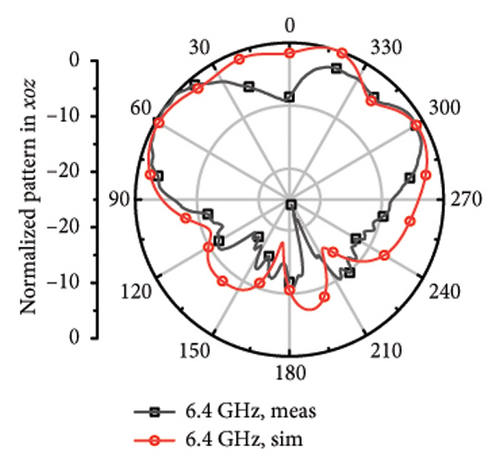
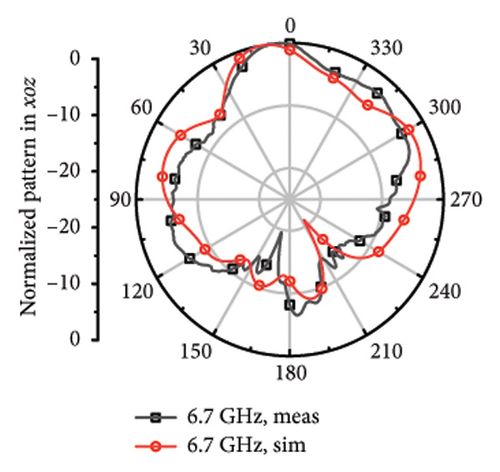
For the far fields in low-frequency band, the main beam gives orient upward and has relatively wide beamwidth of 98°–240° at 1.5, 1.6, 1.7, 1.9, 2.1, 2.3, and 2.45 GHz. It shares little difference between the measured far-field plots and the stimulated plots.
While it comes to high frequency, the main beamwidth remains upward, but narrow beamwidth of 42°∼65° and there are obvious pits for the plots at 4.7, 5.2, 5.5, 5.8, 6.1, 6.4, and 6.7 GHz. The discrepancy may arise from the asymmetric structure of the antenna. Although each frequency point has been limited with high directionality to Z axis during the optimization process, S parameters of different bands mixed with directional aim function and the radiation structure of the upper layer is asymmetric single-arm helix still may cause the asymmetric structure of the plot. The direction of the measured main beam aligns with the simulated beam.
The proposed antenna is compared with another reported similar antenna in Table 2. Compared with other antennas in the referenced literature, this work’s antenna has distinct advantages. It can cover a broader range of frequencies including GPS, Wi-Fi, WLAN, and wireless communication, outperforming the others in frequency coverage. With a relatively thin profile, especially only 7.13 mm for the wireless communication band, it is more lightweight and compact than those in [20–22]. Comparing to the dual band in [1], the proposed antenna can cover more industry band of GPS, Wi-Fi, WLAN, and wireless communication and upward radiation with wide beamwidth. It is suitable for specific scenarios, differentiating it from the thin beam or omnidirectional patterns of other antennas. Moreover, its gain peak of 7.5 dBi is higher than that of [1, 19–21]. Besides, it has a low profile and is very suitable for conforming to the shell of a mobile carrier, which can protect the antenna and meets the requirements of WLAN, Wi-Fi, mobile communication, and GPS.
| Ref. | Frequency | Profile (mm) | Pattern | Gain peak |
|---|---|---|---|---|
| [1] | WLAN 2.36∼2.776 GHz and 5.12∼5.62 GHz | 11 mm or 0.088λ0 | Unidirectional | 7.3 dBi |
| [19] | 1.575 GHz ± 60 MHz (GPS), 2.45 GHz ± 68 MHz (WLAN) | 2.72 mm or 0.01375λ0 | Directional | 2 dBic |
| [20] | GPS (1.5625∼1.579 GHz) | 50.90 mm or 0.0989λ0 | Directional | 5 dBi |
| [21] | WLAN 2.15∼2.65 GHz and 4.85–5.92 GHz | 36.99 mm or 0.2651λ0 | Omnidirectional | 4.51 dB |
| [22] | Wi-Fi (4.25∼6.25 GHz) | 37.29 mm or 0.5283λ0 | Omnidirectional | 6.0 dBi |
| This work |
|
23.03 mm or 0.1098λ0 | Upward directional | 7.5 dB |
- Note: λ0, the wavelength at the lowest frequency.
4. Conclusion
In this paper, a low-profile and multiband antenna based on binary encoding and multiobjective optimization with AI is designed. The two metal parasitic layers based on binary encoding are introduced to achieve good impedance matching in low profile. The spiral structure is introduced to improve the bandwidth and performance and the low profile. The multiobjective optimization to binary coding antenna with multiple effective bands, low profile, and high gains is carried out with three steps. Firstly, the discretized parameters are converted into continuous parameters, and the crude model of the antenna is optimized. Secondly, optimization algorithms under different weight assignments to the goals are applied to optimize the antenna and produce a large amount of sample data. Then, AI is introduced to learn and training the model, and we finally get the optimal antenna structure from the AI model predicted data, which satisfies the multiobjective performance. The crowdsourcing and prediction process based on AI model requires approximately 5 h, and it basically solves the multiobjective optimization problem of antennas. The antenna design speed based on an AI model is much faster than that of the traditional optimization design process. The measured bandwidths of the finally optimized antenna prototype are in the ranges of 1.43∼2.494 GHz and 4.62∼6.75 GHz. The measured gain peak of the prototype is 7.5 dBi with a profile of 10.98%λ. The AI model is very powerful and is introduced to solve this multiobjective optimization problem.
Conflicts of Interest
The authors declare no conflicts of interest.
Funding
The authors received no specific funding for this work.
Open Research
Data Availability Statement
The data generated during this study are available from the corresponding author upon reasonable request. As all data were independently produced by the authors for this research, there are no restrictions from external data sources. We are committed to provide the data to support further research and verification, ensuring transparency and reproducibility in the scientific community.


