Design of Corrugated Airfoil for a Flapping Wing Micro Air Vehicle
Abstract
The design of micro air vehicles (MAVs) presents unique challenges, particularly in achieving efficient aerodynamic performance and maneuverability within strict size and weight constraints. Flapping wing MAVs, inspired by nature’s efficient flyers, offer promising solutions but demand innovative approaches to aerodynamic design. Bioinspired flapping wing MAVs are the latest research area in the development of aviation technology and find their application in vast fields like military, government, and research institutes and for commercial purposes. The corrugated airfoil concept draws inspiration from natural fliers such as birds and insects, where corrugated wing structures contribute to improved aerodynamic efficiency and robustness. A new wing design approach has been proposed to be used for a flapping wing MAV, operating at lower Reynolds number regime that offers equally good or minimally compromised aerodynamic performance as compared to the previously used wing design with increased structural strength. This design approach is based on inducing regular corrugations (or surface perturbations) on a smooth elliptical airfoil. Using the National Advisory Committee for Aeronautics 0012 airfoil as a baseline, a parametric study has been conducted for the design parameters of the corrugations. Two different motions for the designed airfoils have been studied, including the pitching motion of airfoil through a constant free stream and impulsively started translation motion. The pitching motion has been studied at three different reduced frequencies, and the impulsively started translation motion has been studied for two acceleration modes, that is, fast acceleration and slow acceleration. The study also compares the aerodynamic efficiencies of smooth and corrugated airfoils during these motions. Reynolds number sensitivity analysis is also performed to study the behaviour of these airfoils at different Reynolds number flight regimes. Finally, a structural strength analysis is conducted to analyze the expected structural advantages this new design approach offers. Results demonstrate the superiority of the corrugated airfoil design compared to traditional airfoils in terms of lift generation, stall resistance, and maneuverability. Furthermore, insights gained from this study contribute to advancing the understanding of aerodynamic principles underlying flapping wing flight and pave the way for future developments in MAV design and optimization.
1. Introduction
Flapping wing flight, inspired by nature’s mastery of aerial locomotion in birds, insects, and bats, has captivated researchers for decades due to its potential to revolutionize aerial robotics and unmanned aerial vehicles (UAVs). Unlike fixed-wing or rotary-wing aircraft, flapping wing systems mimic the intricate motions of biological flyers, offering unique advantages in maneuverability, agility, and efficiency. The underlying principles governing flapping wing flight are complex, encompassing aerodynamics, fluid dynamics, biomechanics, and control theory. The appeal of flapping wing systems lies in their ability to navigate through cluttered and dynamic environments with remarkable dexterity, a feat that remains challenging for traditional aircraft designs. By emulating the fluid and adaptive movements observed in nature, flapping wing vehicles hold promise for applications ranging from search and rescue missions in disaster zones to environmental monitoring in densely forested regions. However, realizing the full potential of flapping wing technology requires overcoming formidable engineering hurdles. Designing efficient flapping wings involves a delicate balance between aerodynamic performance, structural integrity, and power requirements. Moreover, the nonlinear and unsteady nature of flapping wing aerodynamics presents computational and experimental challenges, necessitating interdisciplinary approaches that integrate fluid dynamics, structural mechanics, and control theory. In recent years, advancements in materials science, microelectronics, and computational modeling have propelled the development of flapping wing micro air vehicles (FWMAVs)—miniature aerial platforms capable of autonomous flight in confined spaces. These micro air vehicles (MAVs) hold great promise for applications in surveillance, reconnaissance, environmental monitoring, and beyond, offering the ability to access areas inaccessible to traditional aircraft and ground-based systems.
FWMAVs have shown promise as a viable alternative to traditional fixed-wing and rotary-wing MAVs due to their ability to fly with great agility and maneuverability in confined spaces. The design of FWMAVs involves a delicate balance between aerodynamic performance, structural integrity, and power efficiency. One approach to achieve this balance is to draw inspiration from nature and develop bioinspired wing designs, which have very irregular corrugations and transform the wing design with regular occurring corrugations. Corrugated airfoils are characterized by a series of parallel ridges and valleys that run perpendicular to the leading edge of the wing. The design of regular occurring corrugated airfoils offers several advantages over traditional smooth airfoils, including ease of manufacturing, reduction in mass, and improved structural integrity, and finds their application in military, government, and research institutes as well as for commercial purpose [1]. These airfoils can be manufactured through 3D printing and laser cutting which is a cost-effective method that enhances its accessibility for researchers. The overall weight of the FWMAV is reduced owing to the lightweight nature of these airfoil designs which also leads to decreased energy consumption, increase in payload capacity, and importantly better structural integrity.
Computational fluid dynamics (CFD) simulations and wind tunnel experiments are commonly used to investigate the aerodynamic performance of these airfoils. Studies have shown that the naturally occurring corrugated airfoil’s ridges and valleys improve lift and reduce drag at specific angles of attack, leading to a higher lift-to-drag ratio and better aerodynamic efficiency compared to smooth airfoils. While the unique wing structure of the insects or birds plays a significant role in deciding their flight, the aerodynamic characteristics possessed by insects having corrugated wing structures, like the ability to fly forward and backward and hover, are also very much desirable for the design of MAV. The corrugated airfoil design delays the airfoil stall by preventing flow separation over the airfoil by virtue of trapped vortex structures within the valley of corrugations [1–4].
Azargoon and Djavareshkian [5] worked on the unsteady characteristic on the flapping wing with the corrugated trailing edge and wingtip. Their research showed that by employing the modified wing, the lift force over the baseline wing improved by an average of 14%, with a maximum increase of 45%. Moreover, the baseline wing’s thrust force was up to 21% lower than that of the modified eagle wing. The modified eagle wing’s top and lower surface had a greater pressure differential than the baseline wing, according to the examination of the flow physics in this simulation, and the wingtip slots had the most impact on the flow physics.
Sun et al. [6] investigated kinematic parameters and corrugated structures of dragonfly wings. Their findings show that the aerodynamic forces of flexible flat plates and corrugated structures were superior to those of the rigid wing models when the sole factor considered is flexibility. When corrugated structures were considered, flexible corrugated wings provide more thrust but less lift.
Researchers have recently examined the impact of clap-and-fling, corrugation structures, and wing kinematics on our hovering two-winged FWMAV (KUBeetle)’s aerodynamic efficiency. Additionally, various corrugation heights of 3%, 6%, and 0% (noncorrugated) of the local chord length were taken into consideration. The impact of corrugation along the leading and trailing edges was also examined for each corrugation height. Researchers are developing a nonlinear aeroelastic framework to study the static response of morphing composite wings made of orthotropic materials. Understanding the nonlinear aeroelastic properties of composite/corrugated wings is aided by this research. A unique decentralized control design approach for an aeroelastic morphing wing has also been studied to regulate the active damping. This specific wing may replace the present wing by deleting vein structures, which can help with reduced weight and lower power consumption to counteract inertial force during the stroke reversals. Wing corrugation is projected to strengthen the membrane wing [7–12].
The seamless transition of operational modes in self-sustaining microthrusters was studied by Zhu et al. [13]. The apparatus they studied employed wings that flapped in a semipassive manner—a design approach in which one degree of freedom (pitching) is actively controlled, while the other (heaving) responds passively to aerodynamic forces. This semipassive design approach offers a balance between fully active and fully passive systems where actively controlling one motion and letting other develop naturally offers a simpler and more stable mechanism. The results demonstrated that the change in vortex street structures takes longer to occur than the shift in flapping wing performance from energy harvesting to propulsion circumstances. Additionally, the impact of wake vortices on propulsion rises with pitching frequency. The aerodynamic interference impact of three tandem flapping wings at various morphological and kinematic parameters was investigated by Meng et al. [14]. Three effects were investigated in the computation of the aerodynamic interference for the tandem flapping wings: the narrow channel effect, the downwash effect, and the wake capture effect. The results indicate that the wake capture effect was more noticeable as Re increased because of the lowering viscous effect [13, 14].
The unsteady flow regulation of the flexible flap was studied by Han et al. [15] using the immersed boundary-lattice Boltzmann-finite element approach. It was proposed that the airfoil surface’s flow separation mechanism operates at a large angle of attack (AOA) that is bioinspired. The findings demonstrated that the aerodynamic properties of the airfoil vary over time from a “periodic state” to a “chaotic state” to a “quasi-periodic state” and that these changes are strongly associated with the unstable flow separation on the upper surface of the airfoil. However, a flexible flap’s flow control system was also suggested [15].
This study focuses on one crucial aspect of FWMAV design: the development of a specialized corrugated airfoil. By harnessing principles from nature and leveraging cutting-edge computational tools, the aim is to enhance the aerodynamic performance and maneuverability of FWMAVs. In this study, a comprehensive performance analysis of bioinspired corrugated airfoils, having different design parameters, for FWMAVs is presented. The aerodynamic performance analysis is performed using CFD for two types of motion for a FWMAV: pitching motion in a constant free stream at different reduced frequencies and impulsively started translation motion for fast and slow acceleration modes. These motions are studied at three different Reynolds numbers of 100, 1000, and 10,000. The Re numbers for analysis are selected carefully to understand the effect of diverse flow regimes on the performance of the designed corrugated airfoils. Typically, FWMAVs operate at low Re where viscous forces are dominant, owing to their smaller sizes and lower flight speeds. Reynolds Number 100 represents very low Re flow regime which is characteristic of small insects and smaller FWMAVs. During this regime, viscous forces are dominant, and a laminar flow exists. The Re 1000 is representative of an intermediate flow regime where both the viscous and inertial forces are significant. This regime is common for many FWMAVs. Finally, the Re 10,000 regime is governed by more influential inertial forces, and the flow transitions into turbulent flow. This regime is common for larger or faster FWMAVs.
In addition to the aerodynamic analysis, a structural strength analysis for the designed corrugated airfoil has also been conducted. The new airfoil design proposed in this study is expected to supply additional structural strength to the flapping wing without compromising the aerodynamic efficiency. The concept of corrugations otherwise used for commercial purposes (packaging industry) is known to add to the structural integrity. Applying the similar concept to the airfoils suggests that corrugations help an airfoil bear more aerodynamic loads than a smooth airfoil hence making it stronger to withstand bending stresses and damage due to impact. The work presented by Kesel in 1998 also supports this claim that corrugations on the surface of an airfoil offer greater structural stability with lesser weight and greater stiffness as compared to a smoother airfoil [16, 17]. It is believed that the use of bioinspired corrugated airfoils has the potential to revolutionize the wing design of FWMAVs and enable new applications in fields such as surveillance, exploration, and environmental monitoring.
2. Methodology
In this research, code validation was carried out prior to the detailed analysis of the newly generated corrugated airfoils with reference to experimental data available in literature. Corrugated airfoils have been generated through geometric manipulation of the smooth ellipse. Grid sensitivity analysis was carried out to select a grid size that gives the best compromise between accuracy and computational expense. The analysis of the corrugated and smooth airfoils for pitching motion and impulsively started translation motion was conducted at different Reynolds number where the parameter for comparison was the force coefficients and their respective aerodynamic efficiencies. These motion analyses were followed by a structural strength analysis where the structural strength of the best-selected corrugated airfoil was compared with that of a smooth airfoil.
2.1. Airfoil Generation
The aim of this study was to come up with a novel design of a corrugated airfoil for a FWMAV that offers the best aerodynamic efficiency in addition to structural strength as compared to a smooth airfoil. For this purpose, a reference smooth airfoil, an ellipse with 1 cm chord length and 12% c thickness, was selected, to mimic the geometry of baseline airfoil NACA 0012, which is known for its symmetric profile and balanced aerodynamics. It has also served as a benchmark airfoil in both the computational and experimental studies owing to its well-documented performance. The corrugated airfoils were generated by introduction of corrugations on the surface of this smooth airfoil. As no formulations for generation of corrugated airfoils exist, geometric manipulation was used for generation of the airfoils used in this study. This was done by applying a sine curve modulation to the baseline elliptical airfoil in MATLAB. A sine wave was superimposed on the smooth airfoil’s surface to create periodic smooth corrugations unlike the irregular corrugations seen in the wing structure of insects since the purpose of this study was to be inspired from nature and not mimic it. The distance between the leading edge and first corrugation was carefully chosen so as to not disrupt the optimal flow attachment and preserve the smooth, curved leading edge. This approach of geometry manipulation offered simplicity and control over the design while making the process reproducible. Figure 1a shows the key design parameters for these corrugated airfoils including the number of corrugations, the depth of corrugations (vertical distance between crest and trough), and the pitch of corrugations (distance between the adjoining crests), which were varied for these airfoils.
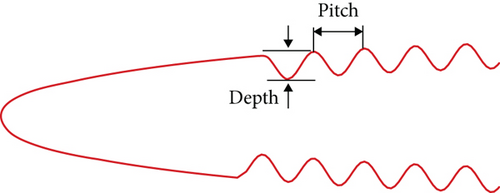
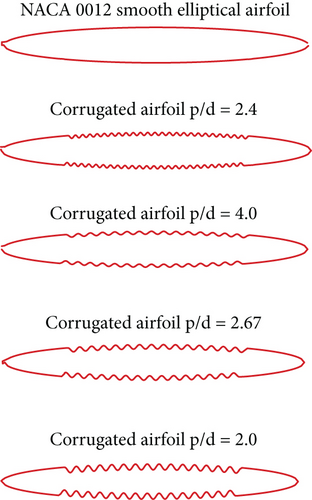
The airfoils in this study are characterized based on a p/d factor, that is, pitch of corrugation/depth of corrugation. It can be inferred that the lower p/d ratio implies more roughness. Introduction of this nondimensional factor provides a useful, consolidated metric to compare different corrugated airfoil designs and their performance. Keeping in view the design parameters of the corrugated airfoils, four such airfoils were generated having different p/d factor. The depth of corrugations was limited by the thickness of the airfoil to maintain its aerodynamic shape and overall structural robustness. With this constraint, the corrugations do not encroach excessively on the airfoil’s core geometry, preventing detrimental effects to flow over the airfoil as well as structural failure. Figure 1b and Table 1 show the design parameters of the airfoils considered for later calculations.
| Airfoil | No. of corrugations on upper or lower surface | Depth of corrugations (% of chord) | p/d factor |
|---|---|---|---|
| Smooth Airfoil | 0 | 0.0 | — |
| Airfoil 1 | 25 | 1.0 | 2.40 |
| Airfoil 2 | 15 | 1.0 | 4.00 |
| Airfoil 3 | 15 | 1.5 | 2.67 |
| Airfoil 4 | 15 | 2.0 | 2.00 |
2.2. Grid Generation and Grid Sensitivity Analysis
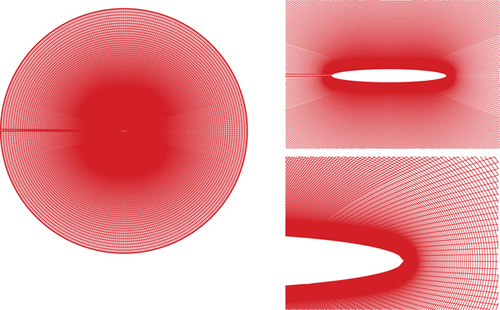
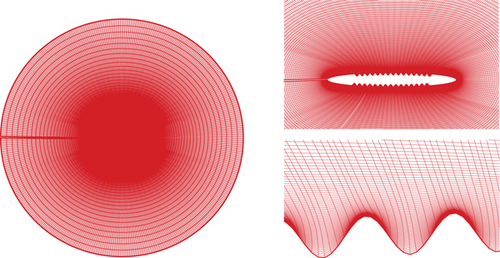
The body-fitted grid is generated around the airfoil using the method of Thomas [17] and Jingchang et al. [18]. The type of topology chosen for this grid is an O-grid which is shown in Figure 2a,b.
Here, τa is the duration of the acceleration, and τ is the nondimensional time. Figure 3 shows the results of the three grids, whereas Grid 2 is selected for the later computations.
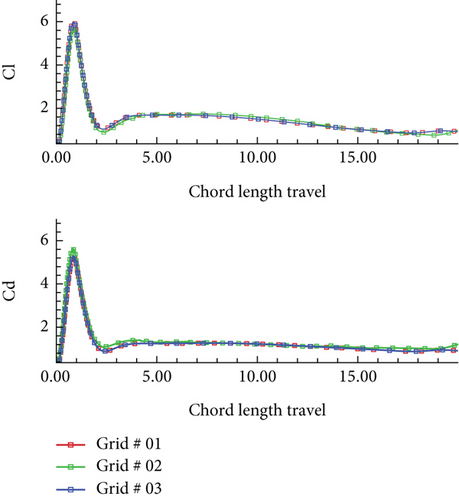
The chord length travel is a nondimensional measure of the distance that an airfoil (or the relative flow) travels, normalized by chord length of the airfoil.
2.3. Computational Method
The coefficients of the implicit and explicit smoothing terms are represented by εi and εe, respectively, in the equations. The added constant second-order implicit and fourth-order explicit spectral damping coefficients enhance stability and work to damp high-frequency oscillations. At the inflow boundary, V∞ and T∞ are specified, while the pressure is extrapolated from the interior. At the outflow boundary, the pressure is set equal to the p∞, and the velocity and temperature are extrapolated from the interior. On the airfoil surface, the no-slip boundary condition is applied, and the pressure on the boundary is obtained through the normal component of the momentum equation.
2.4. Code Verification and Validation Study
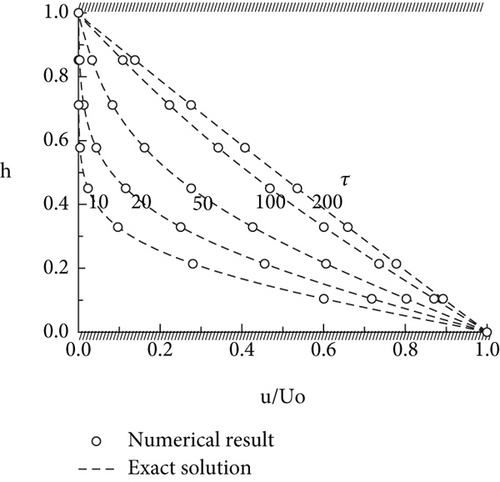
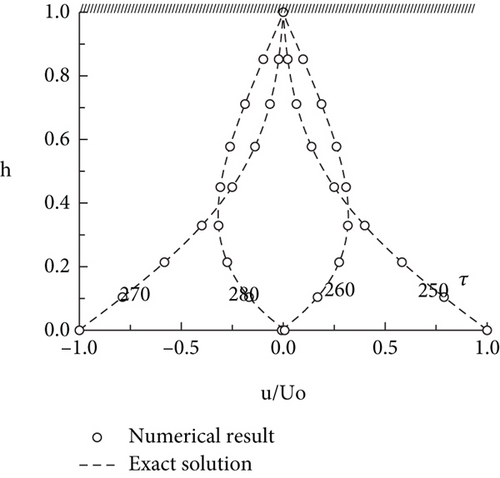
The code used for this study was first verified and validated with experimental data available in the literature. For the verification of the code, the flow formation in the Couette motion and the flow between a periodically moving wall and a stationary wall are computed and compared with the analytical solution, as shown in Figure 4. In the first calculation, the flow-field and the upper boundary are initially at rest, and the lower boundary had initial velocity U0 in its own plane. In the second calculation, the lower boundary moves with the velocity U0sin(πt/40) .
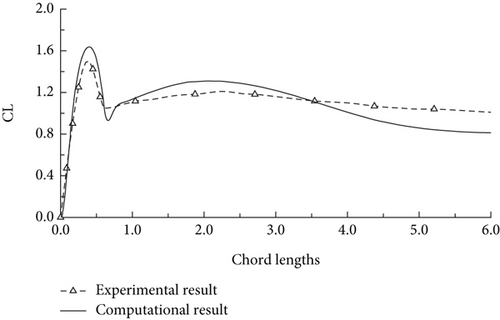
Dickinson et al. and Hamdani and Zunair [19, 20] have presented the experimental results for an airfoil undertaking impulsively started translation motion at low Reynolds number. Similar experimental data was compared with that obtained from computationally solving the said motion for the same airfoil. Both the results, experimental and computational, are plotted together and shown in Figure 5. The code provides results that are in very close agreement to those obtained from the experimental study especially in the initial phase of the unsteady motion. This here concludes that the code is validated and can be used for further analysis.
3. Results and Discussions
3.1. Pitching Motion of Airfoils
3.2. Reynolds Number 100 Analysis
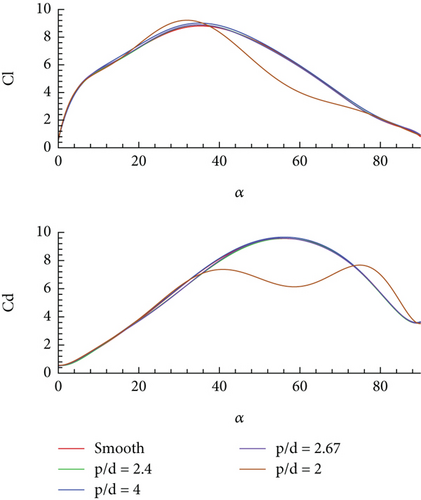
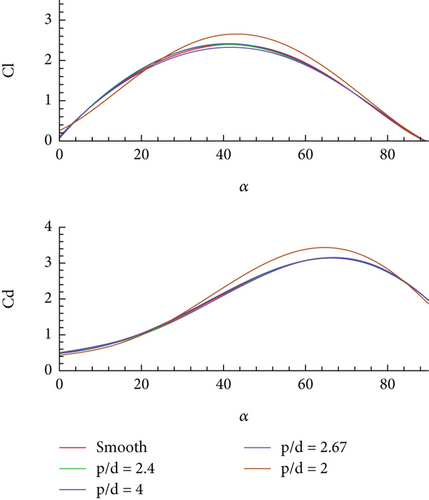
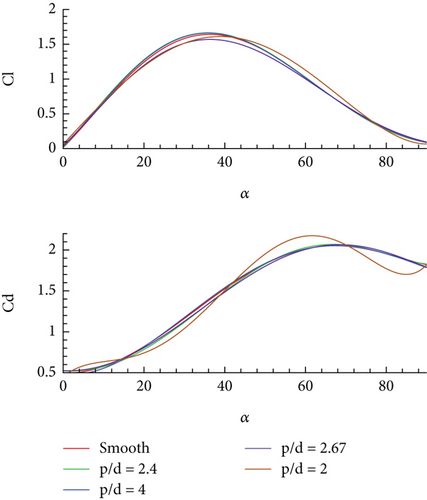
Low Reynolds number flights are characteristics of insects and a regime of interest for MAVs; therefore, the performance analysis of these airfoils was started from Reynolds Number 100. The analysis was performed at a very small Mach number. Figures 6a, 6b, and 6c show the force coefficients obtained at reduced frequencies of 2.4, 0.5, and 0.2, respectively, where Table 2 lists the mean aerodynamic efficiency obtained for all designed airfoils during these motions in the same order.
| Airfoil | Mean aerodynamic efficiency CL/CD | ||
|---|---|---|---|
| Pitching rate 2.4 | Pitching rate 0.5 | Pitching rate 0.2 | |
| Smooth Airfoil | 0.852 | 0.836 | 0.75 |
| Airfoil 1 (p/d = 2.4) | 0.872 | 0.862 | 0.79 |
| Airfoil 2 (p/d = 4) | 0.866 | 0.834 | 0.754 |
| Airfoil 3 (p/d = 2.67) | 0.868 | 0.822 | 0.736 |
| Airfoil 4 (p/d = 2) | 0.888 | 0.862 | 0.76 |
The values of both the CD and CL increase during the initial phase of the motion and start declining after certain AOA. For lower pitching rate, the force coefficients behave similarly for all the airfoils and in close agreement with the performance of the smooth airfoil. However, for the fastest pitching rate of reduced frequency 2.4, the airfoil with largest corrugations, that is, p/d = 2, displays rapid change in force coefficient after α = 38°, while other airfoils have almost the same force coefficients as the smooth airfoil during the entire motion. This means that for large geometric variation, that is, p/d = 2.0, unsteady effect does not dominate, and geometric changes play an important role. Same can be inferred in terms of aerodynamic efficiency for the designed airfoils. Prior to this point, small differences in force coefficients indicate the dominance of the unsteady effect over the geometry changes.
As the pitching frequency reduces, the values of the force coefficients also reduce as compared to faster pitching modes. At a pitching rate of 0.2, similar behaviour of airfoils is seen as for the case of Ω+ = 0.5; that is, all the airfoils show similar but not the same force coefficients throughout the motion which indicates that at low Re, force coefficients are negligibly impacted by the geometric modifications. From this analysis, it has been observed that the force coefficients for all designed airfoils remain in close agreement with each other for low and medium pitching rates, that is, Ω+ = 0.2 and 0.5. However, for greater pitching rate, that is, Ω+ = 2.4, three of the corrugated airfoils show similar force coefficients as the smooth airfoil except for the one with the deepest corrugations or p/d = 2.0 (15 corrugations with 2% c depth). This means that for the three pitching rates, aerodynamic forces of p/d > 2.0 airfoil (or less corrugated airfoil) can be used as an alternate for the smooth airfoil, while structural strength is enhanced (percentage increase in structural strength is discussed in subsequent section). It is worth noting that in all the pitching motion cases, the corrugated airfoil with a p/d factor of 4 provides the best performance in terms of aerodynamic efficiency.
3.3. Vorticity Plots—Flow Around Airfoil
- i.
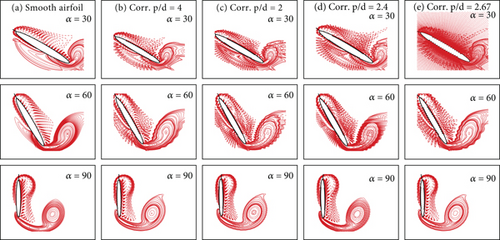
Vortices are formed inside the corrugations creating a virtual surface that makes the airfoil appear as the smooth airfoil; therefore, a streamlined flow ensues, and hence, no compromise or little compromise on the aerodynamic efficiency is observed. These trapped vortices promote attached flow over the airfoil by mimicking a smooth airfoil.
- ii.
Both the negative and positive vorticity layers exist around the airfoil before the start of the pitching motion since the airfoil was in motion at α = 0°. At Ω+ = 2.4, as angle increases, new vorticity layers are generated around the airfoil, and positive vorticity layers move downstream at the lower surface of the airfoil, from the trailing edge. This results in a large time rate of change of the total first vorticity moment or large force coefficients. Analysing the vorticity plots for the smooth airfoil and the corrugated airfoil, a similarity in the movement and the structure of the forming vorticity layers is seen. This reflects the similarity in the force and moment coefficients of these smooth and corrugated airfoils. However, the net aerodynamic efficiency is affected by the variation in the lift and drag of these airfoils occurring due to the local flow behaviour differences.
- iii.
Structural differences in the negative vorticity layers present at the upper surface of the smooth airfoil and the corrugated airfoil are also observed.
3.4. Velocity Vectors
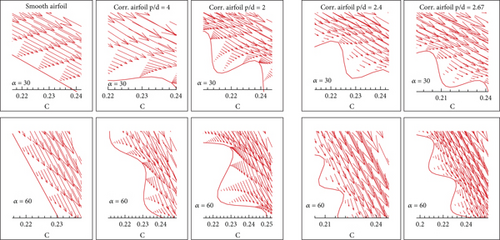
Figure 8 represents the velocity vectors for Ω+ = 2.4 of all designed airfoils at quarter chord location. These vector plots reveal that the boundary layer profile is fuller for the smooth airfoil as compared to that of the corrugated airfoils. The velocity vector behaviour observed on the crest and trough of the corrugations differs from each other since recirculation is formed within the corrugated structure. However, the velocity profile at the crest of the corrugations is like that of the smooth airfoil. This effect appears earlier for a faster pitching motion as opposed to the slower pitching motion. To conclude, the pitching motion of the smooth and corrugated airfoils in a constant free stream bears a slight effect of the corrugated structure on the velocity profile, resulting in a slight difference of the value of lift. Moreover, the unsteady effect in the airfoil motion is seen to be dominating over the geometric differences in the structure of airfoils.
3.5. Reynolds Number Sensitivity Analysis at Re = 1000 and Re = 10,000
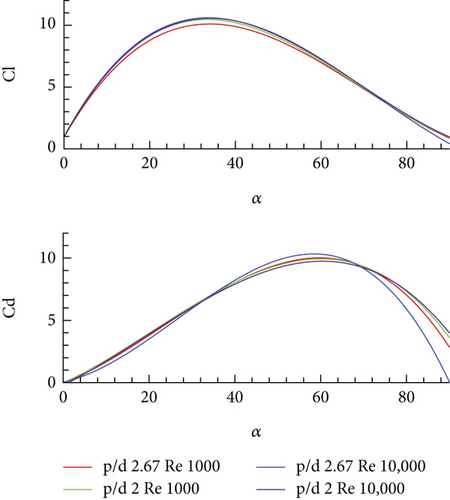
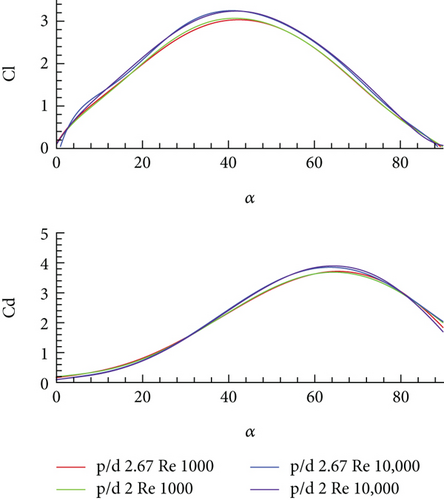
Observing the flow phenomena and airfoil performances at Reynolds Number 100, a further in-depth study was conducted at different Reynolds number, that is, 1000 and 10,000 for the two pitching cases of reduced frequency 2.4 and 0.5. For this purpose, only two corrugated airfoils were selected, that is, p/d = 2.67 and p/d = 2. The airfoil with p/d factor 2 performed differently in the case of Ω+ = 2.4 at Re = 100. The same airfoil was selected for further analysis to study if difference in performance is achieved at a higher Reynolds number. The force coefficients of both the airfoil are shown in Figure 9a for a reduced frequency of 2.4 and Figure 9b for a reduced frequency of 0.5. Table 3 summarizes the mean aerodynamic efficiencies of these airfoils during the studied motions at three different Reynolds numbers.
| Airfoil | Mean aerodynamic efficiency | |||||
|---|---|---|---|---|---|---|
| Pitching rate 2.4 | Pitching rate 0.5 | |||||
| Re 10,000 | Re 1000 | Re 100 | Re 10,000 | Re 1000 | Re 100 | |
| p/d = 2 | 1.03 | 0.998 | 0.888 | 0.998 | 0.964 | 0.862 |
| p/d = 2.67 | 1.018 | 0.98 | 0.868 | 1.01 | 0.95 | 0.822 |
The overall behaviour of airfoil observed at higher Reynolds numbers remains like that at Re = 100. Both the force coefficients increase initially with an increase in the AOA and then start decreasing after a certain AOA. However, the value of force coefficients is increased for the greater Reynolds number which results in a greater aerodynamic efficiency of the airfoil at a higher Reynolds number, keeping consistent with reduced value of force coefficients with reduced pitching rate. Moreover, the performance of the corrugated airfoil with p/d = 2 is improved at higher Reynolds numbers and lies in closer agreement with the performance of the corrugated airfoil with a p/d factor of 2.67, as opposed to its unusual performance at Re = 100. This performance transition is explained by the changing dominance of inertial and viscous effects through different Re regimes. At Re 100, the dominance of viscous effects results in higher drag and early flow separation which reduces the aerodynamic efficiency of the airfoil. On the other hand, at higher Re of 10,000, the inertial forces gain dominance leading to enhanced vortex control and flow attachment which leads to an improved L/D ratio. A slight difference in the performance of the corrugated airfoil is observed, particularly in the drag characteristics. The CL for both the corrugated airfoil remains in close agreement throughout the motion; however, the corrugated airfoil with p/d = 2 is seen to have greater drag beyond α = 70° at Re = 10,000. It is observed that the aerodynamic efficiency of p/d = 2.67 airfoil is slightly increased as compared to p/d = 2 airfoil at Re = 10,000 for the pitching case of Ω+ = 0.5, unlike previously observed cases. An alternate explanation for deteriorated performance of p/d = 2.0 airfoil at large k (Ω+ = 2.4) and small Re (Re = 100) is attributed to the fact that at small Re, viscous effects and geometric modification (corrugations) dominate the unsteady effect. When the Re is increased to 1000 or 10,000, then the unsteady effect dominates, and therefore, p/d = 2.0 airfoil performs similar to p/d = 2.67 airfoil (see Figure 9).
4. Impulsively Started Translation Motion
The impulsively started translation motion has been performed at three different Reynolds numbers, that is, 100, 1000, and 10,000 for two different modes of slow acceleration and fast acceleration at a small Mach number.
4.1. Impulsively Started Translation at Reynolds Number 100
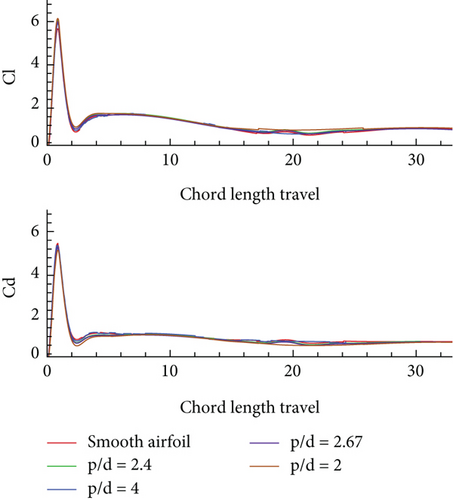
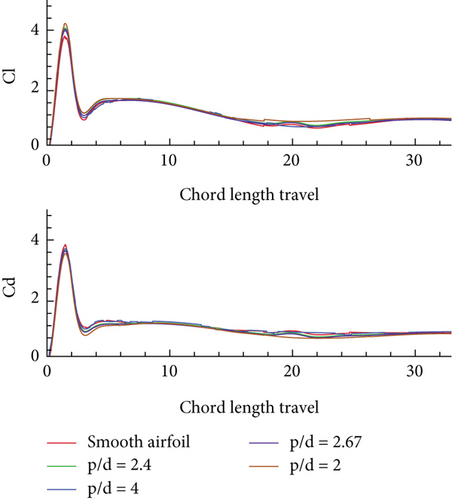
The translation motion analysis was started with Reynolds Number 100. The smooth airfoil and all the designed corrugated airfoils were studied performing this motion. Figure 10 shows the force coefficients obtained for the impulsively started translation motion (a) during fast acceleration and (b) during slow acceleration. The mean aerodynamic efficiency obtained using the time-averaged force coefficients during the impulsively started translation motion at Reynolds Number 100 was 1.0109 and 1.13018 for fast and slow acceleration modes, respectively. The analysis shows that the behaviour of the airfoil remains similar in both slow and fast acceleration modes. This attributes to the fact that the unsteady effects are dominant over the geometric manipulations. A sudden increase in the force coefficients is observed at the instant motion starts in both modes; however, a constant speed is then obtained by the airfoil for about two chord lengths of travel, where both the force coefficients attain a lower sustained value. Moreover, the performance of the corrugated airfoil vis-à-vis smooth airfoil remains similar in both modes. This concludes that the geometrical manipulation of the surface of a smooth airfoil in the form of corrugations does not affect its aerodynamics during translation motion at low Reynolds number. However, the initial peak value of the force coefficients is greater in the case of slow acceleration which indicates that the aerodynamic efficiency of airfoil is greater in the initial phase of slow acceleration as compared to the fast acceleration.
The flow around these airfoils is studied with the help of streamlines and vorticity plots. These plots help understand better how the flow behaves around the smooth and corrugated airfoils leading us to understand the role of corrugations and the vortices in establishing the aerodynamics of MAV wings.
4.2. Flow Behaviour Around Smooth and Corrugated Airfoils
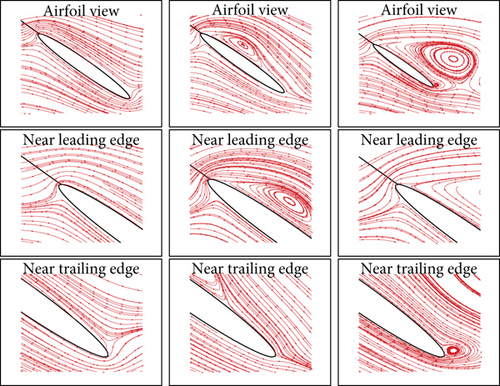
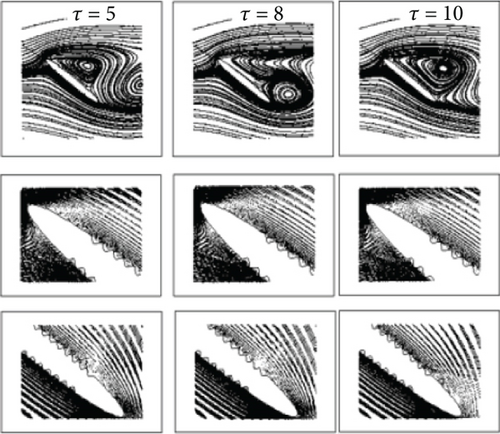
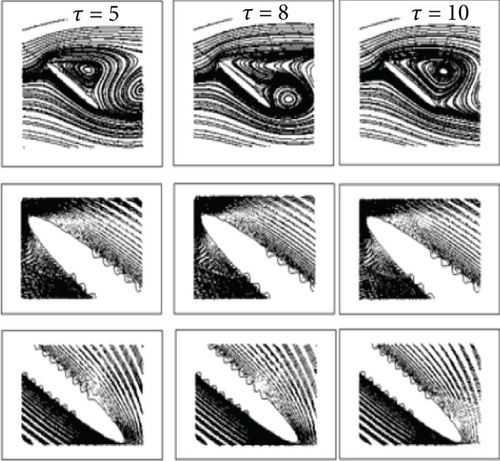
The streamlines and velocity vectors have been plotted to study the flow phenomena around the smooth airfoil and the corrugated airfoil at different instances of time during the impulsively started translation motion. The air flow is smooth and streamlined over the airfoil. The recirculation regions are formed at the upper side of airfoil as it travels through time at certain AOA. These vortices are also observed to travel downstream the airfoil as the motion progresses. The vortex shedding process has also been observed.
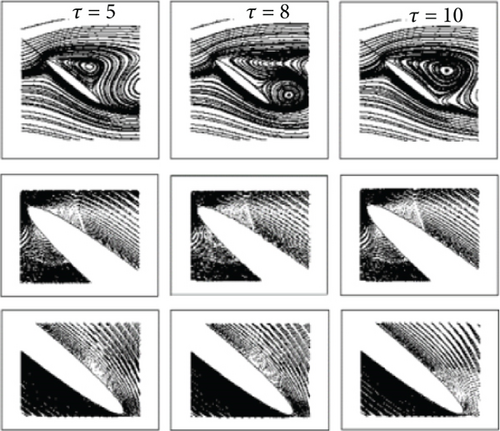
Analysing the force coefficients through streamlines at different instances of times shows that initially the flow remains attached at the leading edge of the airfoil through a small separation bubble. However, as the time progresses, the separation bubble enlarges, while the flow remains attached at the trailing edge of the airfoil. With further progression in time, the leading-edge vortex (separation bubble) starts shedding. An important finding from the translation analysis of the airfoil is that large force coefficients are possible if the flow remains attached to the leading edge or, in other words, the leading-edge vortex does not shed. A general progression of vortices through initial phases of motion to the last phase is shown in Figure 11. The figure clearly represents the generation and time-progressive shedding of the leading-edge vortex.
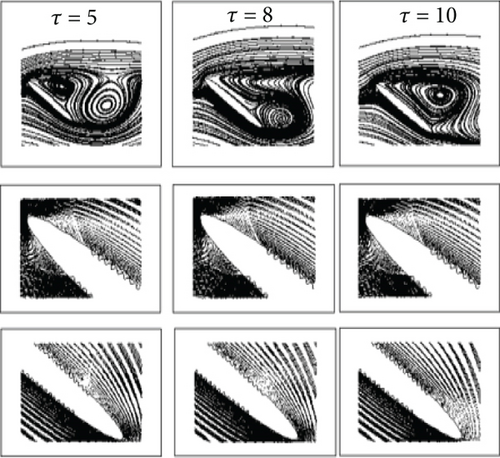
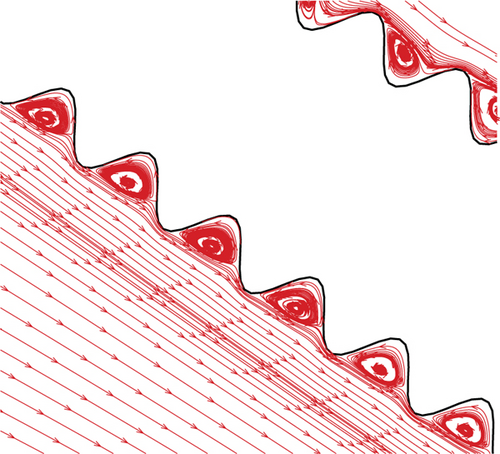
Flow streamlines at different instances of time for impulsively started translation motion for the corrugated airfoil are shown in Figure 12. This analysis of flow behaviour concludes that the geometric manipulation on the surface of the smooth airfoil does not affect its aerodynamic performance in the case of impulsively started translation motion. However, it does result in a much lighter airfoil with greater stiffness and ability to withstand greater bending loads, as will be discussed in coming sections.
4.3. Reynolds Number Sensitivity Analysis at Re = 1000 and Re = 10,000
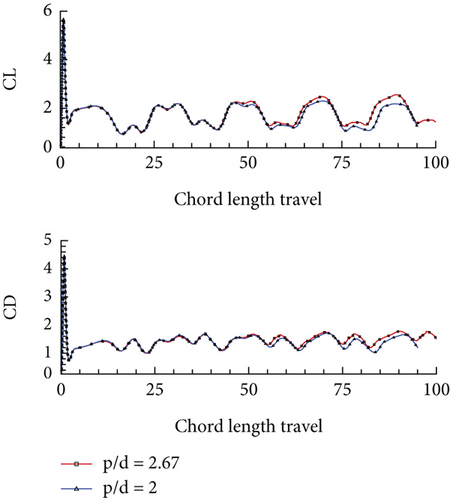
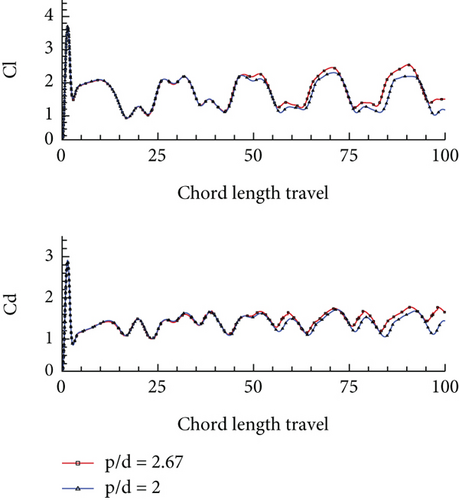
A sensitivity analysis was conducted for the impulsively started translation motion of corrugated airfoils at higher Reynolds numbers of 1000 and 10,000. For this purpose, only two corrugated airfoils were selected, that is, p/d = 2.67 and p/d = 2, which were observed to perform in a similar manner at both Reynolds numbers. For the case of Re = 1000, both fast and slow acceleration modes were studied; however, only the slow acceleration mode was analyzed for the case of Re = 10,000 since the aim was to get the gist of the overall airfoil behaviour at a high Reynolds number. Figure 13 shows the force coefficients vs. chord length travel for the corrugated airfoil during (a) fast acceleration at Re = 1000, (b) slow acceleration at Re = 1000, and (c) slow acceleration at Re = 10,000. Table 4 lists the mean aerodynamic efficiencies of these airfoil obtained using time-averaged force coefficients. The peak values of force coefficients are observed to have reduced at a higher Reynolds number. Moreover, these coefficients do not attain a smooth converged straight-line pattern at a higher Reynolds number; rather, they are seen to undergo a sinusoidal behaviour, which is attained in a regular pattern indicating convergence of force coefficients. The oscillatory force coefficients in case of this motion are closely related to the vortex shedding and flow separation phenomena.
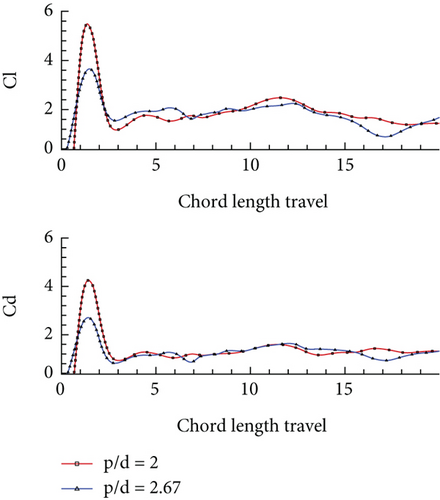
| Mean aerodynamic efficiency (using time-averaged force coefficients) | ||
|---|---|---|
| Re = 1000 | Re = 10,000 | |
| Fast acceleration | 1.185 | — |
| Slow acceleration | 1.2588 | 1.410 |
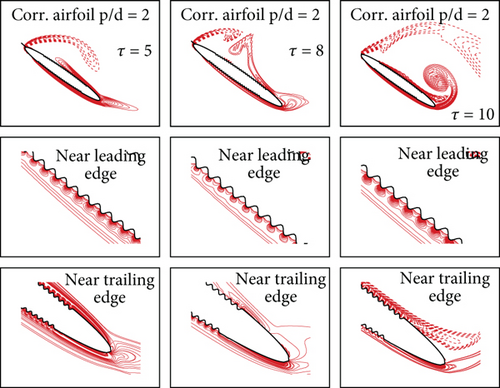
The flow behaviour around the airfoil has also been analyzed through streamlines and vorticity plots. A close-up of positive and negative vortices generated on these airfoils at different instances of time is shown in Figure 14a,b. The strong generation and time-progressive shedding of these vortices are depicted in both the vorticity plots and the streamlines plots. The positive vorticity is shown with solid lines and negative vorticity with dotted lines. The flow at the trailing edge remains attached, while the leading-edge vortex undergoes vortex shedding.
5. Structural Strength Analysis
Structural strength holds extreme importance when it comes to the MAV wing’s structure. In real-world applications, MAVs carry additional loads like actuators, sensors, or payloads, in addition to the aerodynamic loads. For an airfoil, providing better structural strength as compared to others with equally good or improved aerodynamic efficiency suits to be the best solution. Increased strength of wings can help MAVs bear more loads without breakage as well as enable them to withstand greater damage due to impact. The plea taken for structural strength analysis and comparison of smooth vs. corrugated airfoils is that the airfoil that experiences less load/stresses applied on its structure because of equal aerodynamic loads is the one that possesses greater structural strength. The stresses applied on the wing are due to the bending moments caused by aerodynamic loads. To evaluate the structural strength of any wing one must evaluate the primary loads which a wing must take/experience during flight, including aerodynamic lift, load acting as a result of the wing structure weight, and load acting as a result of the weight of the fuel that is contained in the wing. It is important to note that these loads act in perpendicular direction to the wing surface, and their magnitude varies along the length of the wing.
To compare the structural strength of two airfoils, the ratio of their moment of inertia gives an estimate of the ratio of stresses that these airfoils can bear to the minimum, given that the moment applied is considered constant. To this study, a comparison of a smooth hollow airfoil and a corrugated hollow airfoil is made. For a 100 mm × 500 mm wing, shown in Figure 15a, the data obtained is listed in Table 5.
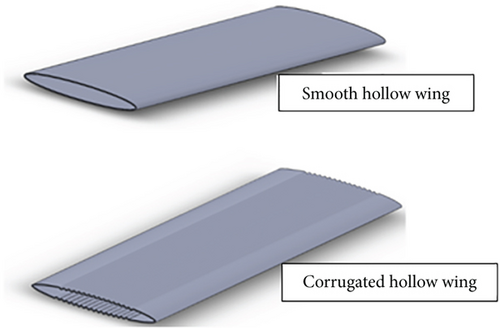

| Property | Smooth filled | Corrugated filled | Difference | Smooth hollow | Corrugated hollow | Difference |
|---|---|---|---|---|---|---|
| Mass (g) | 471.43 | 442.07 | −29.36 | 22.2 | 24.54 | 2.34 |
| Ixx (g∗mm2) | 9,827,853.8 | 9,214,009.23 | −613,844 | 446,875.66 | 512,406.57 | 65,530 |
Thus, the smooth hollow airfoil has more stress applied on its structure as compared to the corrugated airfoil. This concludes to the corrugated airfoil structure being stronger than the smooth airfoil. The percentage difference between the Ixx and hence the structural strength of the airfoils is 14.66%. Concluding that, with similar aerodynamic performance, the corrugated airfoil structure gives 14.66% greater strength as compared to the corresponding smooth airfoil.
6. Conclusion
- a.
The results show that the use of bioinspired corrugated airfoil provides significant advantages over traditional smooth airfoil, including improved aerodynamic performance, ease of manufacturing, reduction in mass, and improved structural integrity. Interesting aerodynamic behaviour developments around these airfoils reveal that the leading-edge vortex plays a significant role in the development of the large force coefficients which is dictated by the time rate of change of the first moment of vorticity.
- b.
The aerodynamic efficiency of the corrugated airfoil is affected by the Reynolds number of the flight, and the corrugated airfoil has better aerodynamic efficiency at higher Reynolds number comparative to lower Re.
- c.
The analysis of the flow behaviour around the corrugated airfoil during the pitching motion revealed that the vortices are generated in the corrugations of the airfoil. These vortices help form the virtual airfoil shape for enabling aerodynamics that is like that of a smooth airfoil/ellipse.
- d.
It has been observed that for impulsively started translation motion, the overall behaviour of these airfoils remains the same and close to each other during both modes of acceleration. However, the peak initial value of the force coefficients obtained is reduced in slower acceleration mode.
- e.
The leading-edge vortex and vortex shedding phenomena dictate the behaviour of flow around the airfoils during the translation motion. It has been observed that the leading-edge vortex or separation bubble remains attached at the leading edge of the airfoil during the initial phases of the motion. Large force coefficients are possible as long as the leading-edge vortex remains attached. As time progresses, vortex shedding phenomena starts taking place.
- f.
With similar aerodynamic performance, the corrugated airfoil structure gives greater strength as compared to the corresponding smooth airfoil.
- g.
Of all the airfoils designed and studied, the corrugated airfoil with p/d = 2, that is, deepest corrugations, shown in Figure 15b gives the best aerodynamic performance and offers the greatest structural strength over a counter smooth airfoil.
Ethics Statement
This research is not conducted on human and animals.
Conflicts of Interest
The authors declare no conflicts of interest.
Author Contributions
All authors contributed equally.
Funding
This research is funded under Sultan Qaboos University Grant Number: RF/ENG/ECED/25/04.
Acknowledgments
The authors appreciate the technical assistance and computing resource used in part of this research from the Computational Lab of the Institute of Space Technology, Islamabad, Pakistan.
Open Research
Data Availability Statement
The datasets used and/or analyzed during the current study are available from the corresponding author on reasonable request.


