Finite Element Analysis to Investigate the Effects of Split Sleeve Cold Expansion Process Variables on Residual Stress Distribution and Pulling Force Progression for Al 2024-T351 Alloy
Abstract
The split sleeve cold expansion process is broadly utilized in aerospace metallic structures to improve the fatigue life of fastener holes. However, the effectiveness of this process is highly affected by variations in key process parameters. This numerical parametric study investigates the effect of hole size variations up to 0.09 mm, frictional coefficient up to 0.1, and mandrel pulling angle up to 1.5° on the outcomes of the split sleeve cold expansion process for a 7.59-mm hole in aluminum 2024-T351. This study primarily focuses on two primary outcomes: residual stress fields and the evolution of pulling force. Explicit 3D FE models were developed using ABAQUS 6.19 to simulate the process. The results of this investigation indicate that geometric variations in hole diameter lead to a reduced magnitude of peak compressive residual stress and a smaller compression region at the hole’s entrance face by up to 24% when compared to the straight hole. When the mandrel’s pulling angle is 1.5°, the distribution of compressive residual stresses becomes asymmetrically around the hole, with a declining trend in circumferential compressive stress magnitude at the entry and exit faces near the hole. Additionally, an increase in the coefficient of friction from 0.05 to 0.1 results in an increase of the maximum pulling forces by 62%–74%; however, its impact on the circumferential residual stresses is minimal.
1. Introduction
Cold hole expansion processes have been instrumental in extending the metallic holes’ fatigue life, particularly in the aerospace industry. These processes involve inducing plastic deformation through an oversized mandrel, which generates beneficial compressive stresses near the hole’s vicinity. These compressive residual stresses delay fatigue crack initiation and propagation on the hole [1–4]. Among cold expansion processes, the split sleeve cold expansion (SSCE) is one of the most extensively utilized antifatigue processes due to its precise hole expansion rate, minimal hole damage, and one-sided processing capability [5]. The SSCE process begins with a lubricated split sleeve being put over an oversized mandrel. The mandrel/sleeve assembly is then traveled over a hole in the metallic workpiece. As a hydraulic puller unit withdraws the oversized mandrel from the split sleeve, plastic deformation occurs around the workpiece hole. The split sleeve is then discarded, leaving a permanent expansion of the hole and the compressive residual stresses around the hole [5–7]. The developed circumferential compressive residual stresses are primarily nonlinear [8–19], and the distribution of circumferential residual stresses is correlated to fatigue life improvement from the SSCE process. Therefore, the accurate prediction of residual stress distributions is critical when applying the SSCE process to result in desired fatigue life enhancement. Figure 1 shows typically required tooling for the SSCE process.
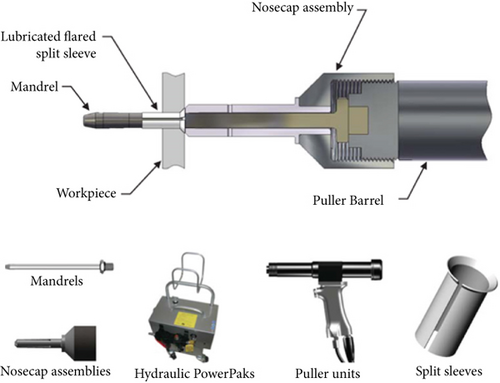
Multiple parameters in the SSCE process affect the induced residual stress fields near a workpiece hole. Past studies [2, 9, 13, 14, 21, 22] have identified these parameters as the hole expansion percentage or the diameter ratio of the expanded hole to the original hole, mandrel geometry, split sleeve geometry, contact conditions between components, workpiece material properties, workpiece geometry, and hole location. An optimum hole expansion percentage exists for a given workpiece material as the magnitude of the induced circumferential residual stress increases with the hole expansion percentage but begins to decrease when the expansion percentage is continuously increased [21]. The geometry of the mandrel [18, 23] and split sleeve [5, 13, 14, 24] has been optimized to produce desired residual stress distributions. It was claimed that friction at the mandrel–split sleeve interface could induce noticeable changes in projected residual stresses at the entrance zone [5, 14, 22]. Mechanical properties of the workpiece material influence the residual stresses; for instance, Al 2024-T351’s yield strength variation from 290.9 to 377.8 MPa produced approximately 215–395 MPa in maximum compressive residual stresses in the circumferential direction [25]. The workpiece thickness also influences the circumferential residual stress magnitude, which increases with increasing thickness [8]. Another critical parameter is the edge distance ratio or edge margin ratio, defined as the ratio of the distance from the center of the hole to the nearest free edge of the workpiece to the hole diameter. The residual stress fields and deformations surrounding the hole can be affected by the edge distance ratio in workpiece models [26, 27]. For this reason, the SSCE process has been standardized with optimum process parameters that depend on workpiece materials and dimensional requirements.
Aircraft manufacturers use standardized SSCE process parameters during their aircraft structure assembly; however, the variation of process parameters within the tolerance is inevitable. For example, many past studies assumed that the prepared hole was considered a perfect cylinder, the contact interaction between the mandrel and the split sleeve is frequently assumed to be frictionless, and the mandrel travels perfectly parallel to the hole axis. However, numerous experimental studies [28–32] have shown that the drilled holes often exhibit variations in their cylindricity. Here, cylindricity refers to the three-dimensional (3D) extension of roundness along the hole’s axis, defining the overall form of a cylindrical feature [33]. Variations in hole quality parameters, particularly cylindricity and perpendicularity, are affected by drilling process parameters such as cutting speed, spindle speed, feed rate, cutting fluid, drill geometries, and drill coating conditions. These parameters affect heat generation, vibrations, and tool/workpiece interactions, leading to deviations in drilled hole quality [28–34]. When it comes to the contact between the mandrel and the split sleeve, it has been reported that the frictional coefficients of solid lubricants in the SSCE process vary between 0.04 and as high as 0.3. The most typical range of the frictional coefficient ranges from 0.05 to 0.1 [5, 8, 11, 14, 16, 18, 22, 27, 35].
Finite element (FE) simulations have been widely used to investigate residual stress patterns for the cold expansion process of the hole and provide a cost-effective means of investigating and optimizing the SSCE process design [5, 25]. This finite element method (FEM) study examines how the variations of the prepared hole geometry and the SSCE operational conditions within the practical tolerances affect residual stress and mandrel pulling force development in the SSCE process. The chosen key parameters for this investigation follow worst-case scenarios within the specified tolerances. In this study, the three hole geometry models are used: (1) perfectly straight, (2) minimum entry and maximum exit diameter, and (3) maximum entry and minimum exit diameter. Mandrel’s pulling angles used are 0° as an ideal and 1.5° as the maximum allowable angle. The two coefficients of friction (COFs) values of 0.05 and 0.1 are used in the modeling. This study can offer crucial considerations to ensure the SSCE operational quality and accurate anticipation of the pulling force progression and the residual stress distribution.
2. Methods of Approach
2.1. Geometrical Configurations
The workpiece is an Al 2024-T351 alloy workpiece with a thickness of 6.35 mm. A through-hole was made in the center of a 100 mm by 100 mm workpiece model. For the study, we used the hole dimension of mm, with a maximum material condition of 7.59 mm and the least material condition of 7.68 mm, a typical aerospace hole tolerance. In a practical SSCE process, the split sleeve with a thickness of 0.2 mm is designed to fit over the mandrel with a minor diameter of 7 mm. With a mandrel’s maximum diameter of 7.47 mm, this setup achieves a 3.69% expansion rate when applied to a hole with a maximum material condition diameter of 7.59 mm. Here, the % expansion rate is computed by Ix = (MMD + 2ST − IHD/IHD) × 100%. Here, Ix represents the radial expansion percentage of the hole, MMD and IHD are the maximum mandrel diameter and initial diameter of the hole, respectively. At the same time, ST represents the sleeve thickness used in this numerical modeling. The mandrel and sleeve dimensions were unaltered from the prior study [25].
2.2. Design of the Parametric Study
This study focused on the three input parameters: the hole geometry, the mandrel’s pulling angle, and the COF between the mandrel and the sleeve. Firstly, we used different diameter ratios, DS, DL, and DH, for entry and exit faces to define the hole geometric variation. The DS model represents the straight hole geometry with a constant diameter of 7.59 mm, which is the hole’s maximum material condition. The DL model indicates the smallest possible diameter, or 7.59 mm, in the entry and the maximum possible diameter, or 7.68 mm, in the exit, and its hole diameter ratio or DEntry/DExit equals 0.988. The DH model with the hole diameter ratio of 1.01 has the largest possible hole size in the entry face with the smallest possible diameter in the exit. Secondly, the angle at which the mandrel is withdrawn has been identified as an additional parameter in the SSCE process that affects the outcomes. In a preferred setting, the mandrel needs to be pulled collinearly to the hole axis, resulting in a pulling angle of 0°; however, this cannot always be the case in practice. The maximum allowable pulling angle of the mandrel, defined in this study, is 1.5° from the hole center. Lastly, the two different COFs of 0.05 and 0.1 were incorporated during the SSCE modeling. The range of COF was chosen based on the conditions used in past studies [6, 18, 35]. In this numerical investigation, a total of 12 models were analyzed. Table 1 summarizes the three input parameters and represents the convention of symbolizing and nominations utilized in this paper.
| Parameter 1: hole diameter variation ratio | ||||
|---|---|---|---|---|
| Symbol | DEntry (mm) | DExit (mm) | Visualization of hole diameter variation | |
| DS | 7.59 | 7.59 | 1 |  |
| DL | 7.59 | 7.68 | 0.988 |  |
| DH | 7.68 | 7.59 | 1.01 |  |
| Parameter 2: coefficient of friction (COF) | ||||
| Symbol | Low COF value | High COF value | ||
| μ | μ = 0.05 | μ = 0.1 | ||
| Parameter 3: pulling angle | ||||
| Symbol | Collinear pulling of the mandrel | Angular pulling of the mandrel | ||
| α | α = 0° | α = 1.5° | ||
- Abbreviations: DEntry, diameter at entry face of the hole; DExit, diameter at the exit face of the hole; DH, negatively tapered hole; DL, positively tapered hole; DS, straight hole.
3. FE Modeling Methodology
3.1. Modeling Assembly and Material Properties
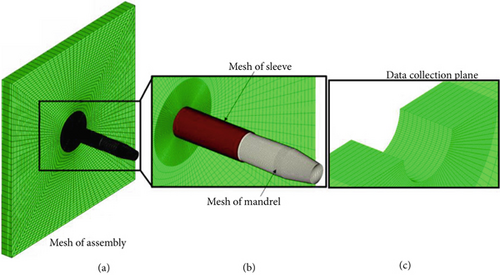
The 3D SSCE was modeled using a commercially available FE software, Abaqus 6.19. Figure 2a,b depicts the FE model assembly of the tapered mandrel, split sleeve, and aluminum hole workpiece, representing a typical industrial configuration. The region for collecting simulation data during the postprocessing was chosen to be away from the sleeve’s split location, which impacted the process modeling outcomes [5]. Therefore, the data collection plane avoids the irregular residual stress distribution at the axial ridge along the contact line between the sleeve split and bore surface, as shown in Figure 2. Table 2 represents the material properties of the three models, that is, Al 2024-T351 workpiece, stainless steel sleeve, and steel mandrel.
| Parts | Material | Young’s modulus (GPa) | Poisson ratio | Yield strength (MPa) |
|---|---|---|---|---|
| Workpiece | Al 2024-T351 | 73.3 | 0.33 | 326.46 |
| Split sleeve | Stainless steel | 196.5 | 0.27 | 1007.74 |
| Mandrel | Steel | 205.46 | 0.3 | N/A |
3.2. FE Meshing
A fine mesh is often necessary to ensure accurate predictions of the SSCE process outcomes. In this study, the workpiece’s hole bore is the most significant region of interest, where a fine mesh was applied, as illustrated in Figure 2, whereas the other regions away from the hole bore have a coarse mesh. This method provides higher accuracy for the SSCE process near the hole while lowering computational costs.
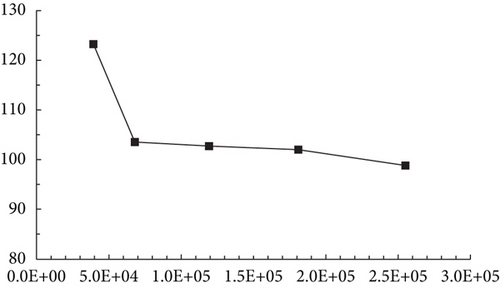
A grid-independence study was conducted to ensure that the predicted residual stresses were unaffected by mesh size [25, 35]. FE models with varying levels of mesh refinement were analyzed until the difference in the predicted maximum circumferential residual stress (σθθ) around the hole became negligible. Figure 3 illustrates the relationship between σθθ and the total number of elements in the FE models. The results show that after the third level of refinement, the differences in residual stress predictions become insignificant. For the parametric study, the fourth refinement level, comprising 525,612 linear hexahedral elements of type C3D8R, was selected as an optimal balance between computational cost and accuracy. The mesh elements for the mandrel and the split sleeve were 71,940 and 334,152, respectively. The method for achieving finer meshing is partitioning each part into smaller regions. These partitions concentrate on the key areas of interest and allow individual meshing of the data collection zones.
3.3. Boundary Conditions, Contact Interactions, and Modeling Processes
The boundary conditions used in this study replicate the practical SSCE process. The nose cap assembly restricts the movement of the sleeve while the hydraulic puller unit pulls the mandrel. As shown in Figure 4a,b, the three sides of the aluminum hole workpiece are set to “no movement or rotation” to prevent any movement or rotation throughout the simulation process. A new datum coordinate system, designated as X′, Y′, and Z′ planes, was implemented to apply a 1.5° pulling angle in the X-Y planes. The displacement of the split sleeve was constrained in the Z′-axis at the flange end of the split sleeve.

Contact interactions play an essential role in FE modeling of the SSCE process. In this study, the mandrel was considered the master surface for the mandrel–split sleeve interaction. Following the ABAQUS contact convention, the split sleeve was assumed to be the master surface for the sleeve–workpiece interaction. Moreover, the two COFs of 0.05 and 0.1 were applied between the mandrel and sleeve contact [25, 35].
We used ABAQUS/Explicit computational methodology for this study to model and simulate the highly dynamic movement of the cold expansion process and nonlinear behavior such as the contact interaction. The total simulation time for this numerical SSCE process was set to 2.19 s with a constant mandrel velocity of 22 mm/s. Additionally, a mass scaling factor was used to improve the numerical simulation efficiency by reducing the overall computational costs of the simulations.
3.4. Validation of FE Model Results
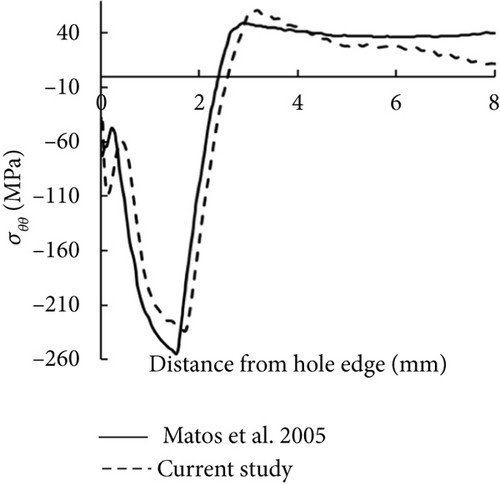
Matos et al. [13] performed a 3D FE simulation of the SSCE process for rivet holes in 2024-T3 Alclad plates, providing detailed information on the workpiece dimensions, SSCE tooling, and material properties. Their simulation applied an expansion percentage of 4.5%. We replicated their study to validate our FE model using our modeling approach [25, 35].
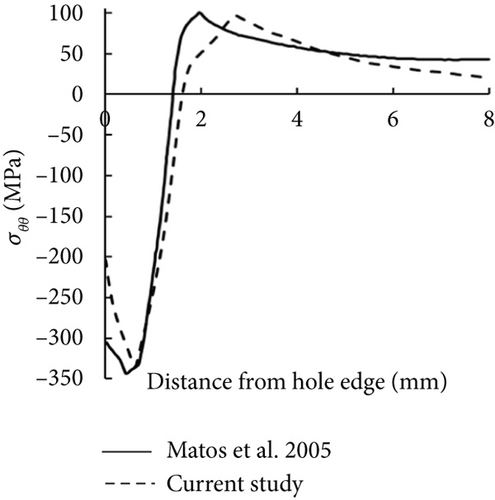
Comparisons of the circumferential residual stresses (σθθ) along the radial direction at the entry face and mid-thickness plane are shown in Figure 5a,b, respectively. The entry face refers to the workpiece surfaces where the mandrel enters. The results demonstrate a strong agreement between our predictions and those of [13], confirming the accuracy of our model. Both studies show the characteristic residual stress pattern around a cold-expanded hole: a compressive stress zone near the hole edge and a tensile stress zone farther away. The differences in maximum compressive σθθ between the two studies are 11.4% and 5.9% at the entry face and mid-thickness plane, respectively. Furthermore, the size of the compressive and tensile stress zones predicted by our model closely matches their results. These results further validate the reliability of our approach and its agreement with prior work.
The pulling force during the SSCE process is another key output in our study. Phillips [36] from Boeing reported experimental pulling force data for the SSCE process using three levels of mandrel interference as a design variable. Table 3 compares Phillips’ experimental results with our numerical predictions for the same mandrel interferences. Overall, our FE simulation results show good agreement with the experimental data, with both studies confirming that the pulling force increases as mandrel interference increases. The differences between our predictions and Phillips’ data range from 7.7% to 11.4%. These discrepancies are primarily due to the limited availability of detailed SSCE process parameters in Phillips’ study, such as mandrel design, mandrel velocity, friction coefficients, and process duration. Our simulations used SSCE parameters commonly adopted in current industrial practice, which likely contributed to the variations. Despite these uncertainties, the close alignment between our results and Phillips’ experimental data underscores the reliability of our FE model in predicting pulling force trends in the SSCE process.
4. Results and Discussion
4.1. Analysis of Residual Stress Distributions
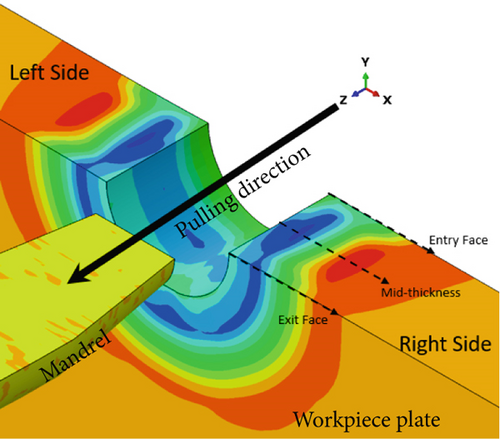
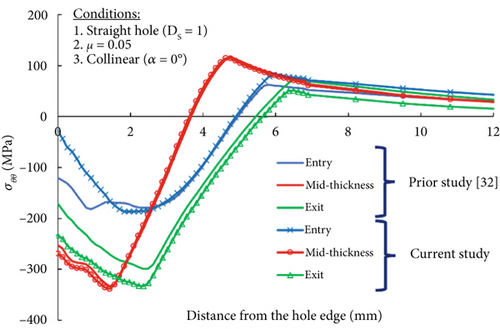
We primarily focused on the circumferential compressive residual stress (σθθ), as the most crucial output parameter, which can reduce net tensile stress at the hole to delay fatigue crack initiation and fracture formation. This beneficial residual stress also facilitates fracture closure, slowing fatigue crack progression [5]. Figure 6 represents the circumferential compressive residual stress (σθθ) distribution in the condition of the straight hole, or the DS model, with the diameter ratio = 1, the COF = 0.05, and the pulling angle, α = 0°. This condition is similar to the modeling work found in other published FE studies [25, 35]. Figure 6a indicates the three planes surrounding the hole, namely, the entry face, mid-thickness face, and exit face, which have commonly been referred to in previous studies [5, 15–19]. The figure also identifies the right and left sides of the cross-sectional workpiece concerning the mandrel’s pulling direction. The simulation results indicate that the entry face of the hole exhibits lower compressive residual stress compared to the mid-plane and exit face of the hole, which agrees well with findings from past numerical and experimental studies [4, 5, 11, 12, 25]. The maximum compressive residual stress occurs near the mid-plane. We used similar SSCE parametric conditions from a prior FE study [25] to validate our numerical results. Figure 6b shows that both results show strong agreement and suggest that the residual stress distribution surrounding the hole remains axisymmetric when the mandrel’s pulling angle is completely parallel to the hole axis [25].
4.1.1. Effect of the Hole Diameter Variation Ratio
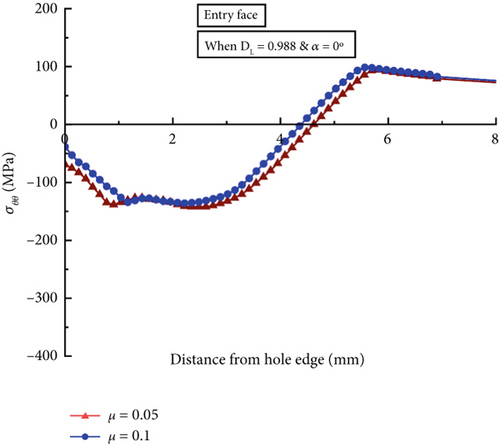
The geometric variation of the hole size, or the hole diameter variation ratio, is designated by the ratio of different diameters of the hole between the entry point and exit side. Figure 7 illustrates the effect of the hold diameter variation ratio on the compressive residual stress (σθθ) distributions at different faces, that is, entry, mid-thickness, and exit faces of the hole, when the mandrel pulling angle equals 0° and the COF is 0.05. Each residual stress curve shows the compressive region size, which can be defined as the compression-to-tension transition distance from the hole bore. For example, the residual stress curve of the entry at α = 0° in the case of DS or the straight hole model was −29 MPa at the hole bore, maximized to −187 MPa at 1.8 mm, and declined to 0 MPa at 4.89 mm from the hole bore; therefore, the compressive region size can be identified 4.89 mm. Figure 7a shows that both DL (the positively tapered hole) and DH (the negatively tapered hole) models produce relatively lower maximum compressive σθθ at the entry face of the hole at −142 MPa and −150 MPa, respectively, compared to the straight hole model. The plastic deformation surrounding the hole bore contributes to compressive residual stress (σθθ) distribution growth [25]. The DL and DH models produce 24% and 20% less peak residual stresses, respectively, over the DS models due to less plastic deformation. Figure 7a also demonstrates the compressive region size variation at the entry face of the three hole models. DL and DH models produce lower compression regions at 4.62 and 4.09 mm, respectively, compared to the DS model’s 4.89 mm.
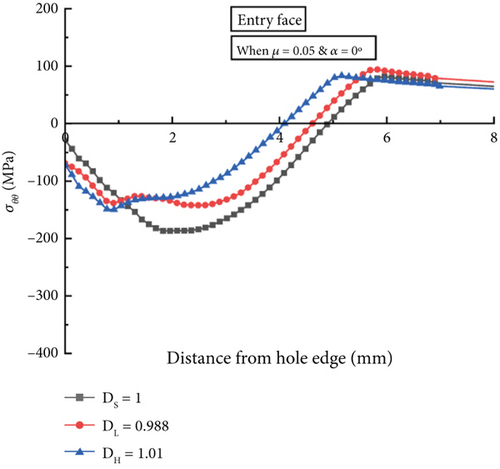
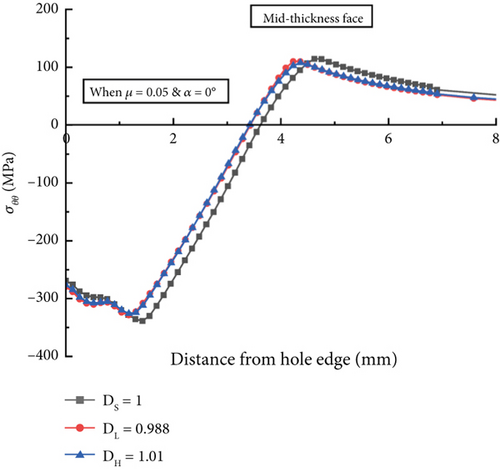
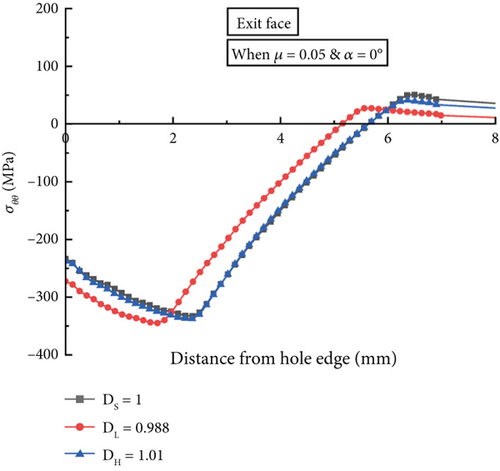
The reduction in compressive residual stresses observed in the tapered hole models (DL and DH) can be attributed to the variation in the expansion process along the hole’s thickness. Unlike a straight hole, where uniform radial expansion leads to relatively consistent plastic straining, the presence of a diameter gradient results in nonuniform mandrel–hole interference. In the tapered holes, the expansion percentage is not constant along the mandrel’s travel path, causing variations in local plastic deformation. This results in a more distributed strain field, reducing the peak compressive residual stresses at the entry face. Additionally, since the mandrel interacts differently with each segment of the bore, the interference fit varies along the thickness, contributing to the observed stress distribution differences. The nonuniform material flow due to the varying diameter further alters the compressive region’s extent.
Due to the geometric variation of the hole’s bore surface, the expansion percentage varies throughout the mandrel’s travel, resulting in dissimilar maximum σθθ values and compression regions. Similar trends in residual stress distributions and compression region sizes are observed in the mid-thickness and exit faces of the hole surface, as shown in Figure 7b,c. However, variations in the hole diameter over the thickness have a relatively minor impact on maximum compressive residual stresses and the size of the compression zone at the hole’s mid-thickness and exit faces. Notably, fatigue failure often occurs at the entry face of cold expanded holes due to this region’s comparatively lower compressive residual stresses [37–39]. When the hole deviates from a perfectly straight form, the peak compressive residual stresses at the entry face can be further reduced, potentially impacting the hole structure’s fatigue life.
4.1.2. Effect of the COF
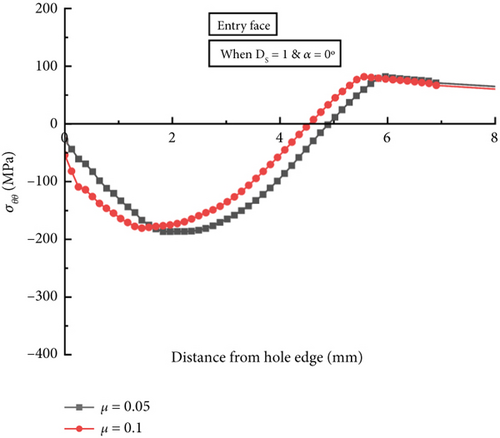
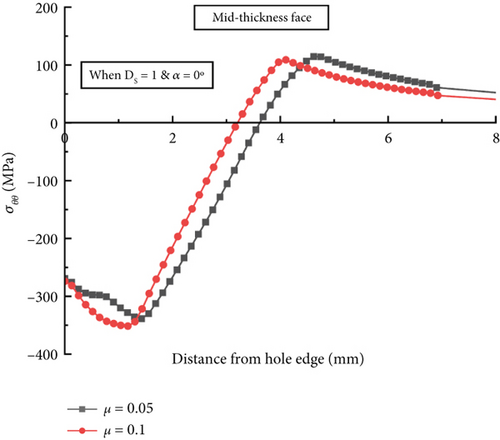
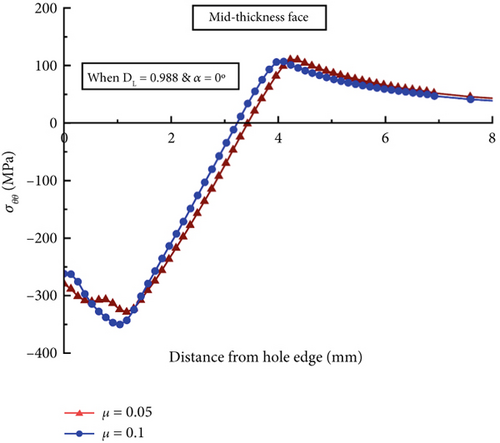
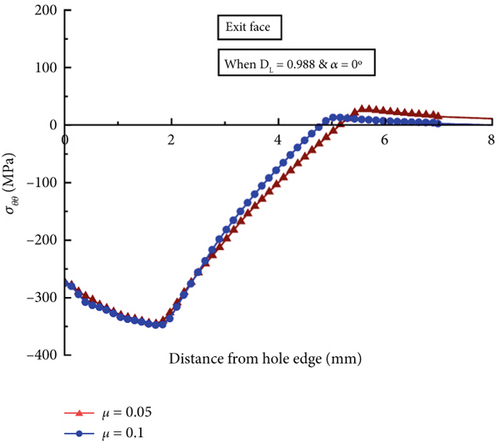
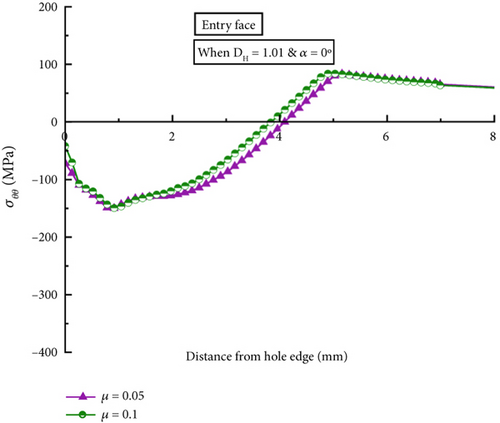
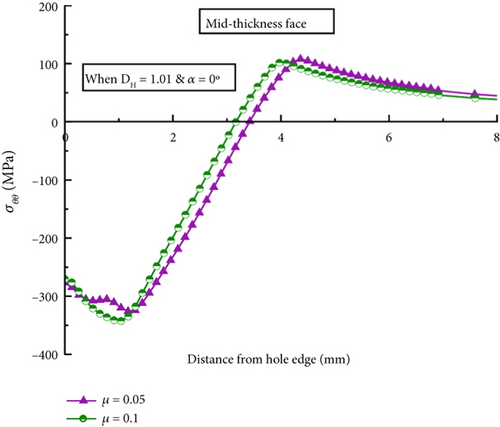
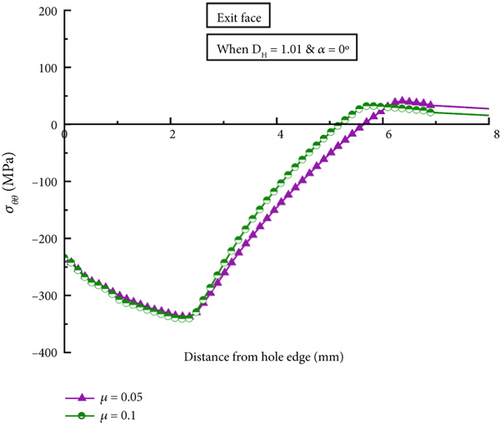
The impact of the COF on residual stress distribution for collinear models with different hole variations is shown in Figures 8a, 8b, and 8c for the DS model; Figures 9a, 9b, and 9c for the DL model, and Figures 10a, 10b, and 10c for the DH model. The analysis results indicate a considerable change in the residual stress curve trend. However, the high COF value at 0.1 results in a comparably lower compression region than the low COF at 0.05. This result can be correlated to the average normal force acting on different faces of the hole. For instance, when the COF is low at 0.05, the average normal pressure corresponding to the normal force produced by the mandrel at the entry face of the hole for collinear DS, DL, and DH models are found to 534, 483, and 496 MPa, respectively. Similarly, in the case of the high COF condition or μ = 0.1, the average normal pressure at the entry face of the hole for collinear DS, DL, and DH models are found 478, 443, and 450, respectively, which are lower than those obtained from the low COF condition. Past studies [40–43] reported that normal pressure applied decreases with increasing the COF between the tool and the workpiece. Our analysis also concludes similar findings that the average normal pressure at the entry face of the hole gets reduced for collinear DS, DL, and DH models from 534, 483, and 496 to 478, 443, and 450 MPa with increasing the COF from 0.05 to 0.1, respectively. A similar trend in normal pressure magnitudes is also observed at the mid-thickness and exit faces of the hole with increasing COF. However, the high COF condition does not produce a noticeable variation in the compressive residual stress distribution among the hole diameter variation models, which agrees well with a past study [44].

4.1.3. Effect of the Pulling Angle
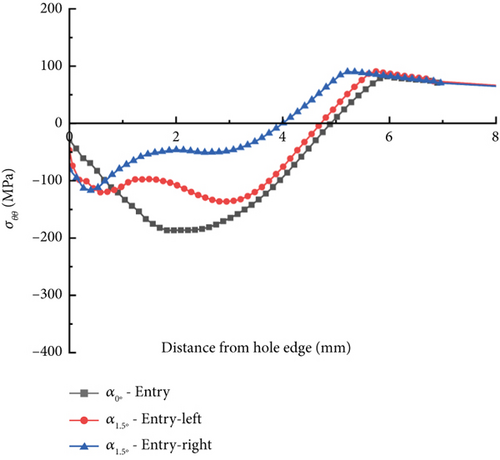
Figure 11 illustrates the circumferential compressive residual stress (σθθ) contour distributions of DS or the straight hole model when the pulling angle becomes 1.5°. The residual stresses are not symmetrical along the hole’s left and right sides, unlike the collinear model results introduced in Figure 6. The entry-left side of the hole generates higher σθθ compared to the entry-right side due to the mandrel’s angular pulling. For instance, in the hole’s entry-left face, the peak compressive residual stress is approximately −136 MPa, while the entry-right face has a peak compressive residual stress of about −117 MPa. The identical hole’s exit also has asymmetric compressive residual stress patterns between the left and right sides. The exit-right side has a higher peak σθθ, which is approximately −361 MPa, than that of the exit-left side, which is approximately −307 MPa, due to the angular pulling direction. Therefore, when the mandrel’s pulling angle is not zero, it is critical to consider the effect of the pulling angle on compressive residual stress distribution on both the two opposite sides, left and right, of the hole.

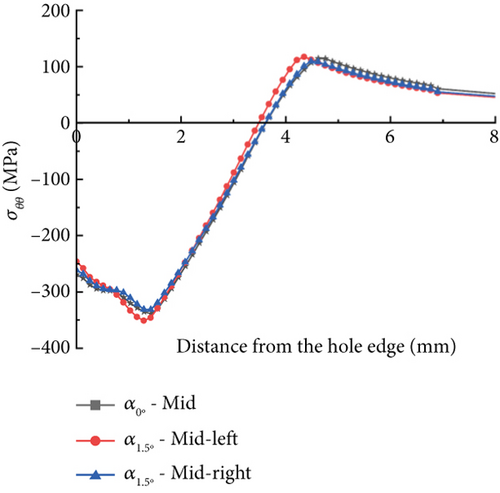
The effect of the pulling angle on the entry, mid-thickness, and exit faces of the DS hole model is investigated. Figure 12 presents a graphical depiction of the circumferential compressive residual stress (σθθ) distributions comparing the angular model at α = 1.5° with the collinear model at α = 0°. Table 4 summarizes the peak compressive residual stresses and the compressive region size obtained from Figure 12. The left and right sides of the hole’s entry and exit faces revealed a distinct pattern considering the angular model at α = 1.5°. The angular pulling model’s entry-left and entry-right faces exhibit declining peak compressive residual stress and compressive region values compared to the collinear model a α = 0°. As shown in Figure 12a, the entry-right face underwent a substantial reduction in peak compressive residual stress and compressive region values, approximately 38% and 18%, respectively, compared to the collinear model. Residual stress distributions in the mid-thickness are similar among the three conditions, as shown in Figure 12b. Figure 12c shows that the exit-left face also produces a lower peak σθθ and compressive zone values of roughly 8% and 11%, respectively, over the collinear model. Decreased expansion percentages attributed to the angled pulling may result in reduced plastic deformations on the entry-right and exit-left faces of the hole, resulting in comparatively reduced peak compressive residual stress and compressive region values.
| D | μ | α | Output parameters | Entry face | Mid-face | Exit face | |||
|---|---|---|---|---|---|---|---|---|---|
| Left | Right | Left | Right | Left | Right | ||||
| DS | μ = 0.05 | α = 0° | Peak σθθ | −186.52 | −338.73 | −332.71 | |||
| r | 4.89 | 3.68 | 5.69 | ||||||
| μ = 0.1 | Peak σθθ | −180.62 | −351.64 | −329.79 | |||||
| r | 4.49 | 3.30 | 4.88 | ||||||
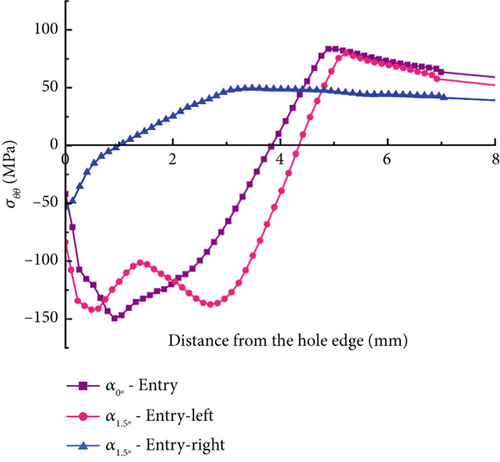
| μ = 0.05 | α = 1.5° | Peak σθθ | −136.25 | −116.63 | −351.05 | −331.62 | −307.69 | −361.36 | |
| r | 4.67 | 4.01 | 3.54 | 3.68 | 5.08 | 5.76 | |||
| μ = 0.1 | Peak σθθ | −152.57 | −144.79 | −358.68 | −343.81 | −326.89 | −358.18 | ||
| r | 4.42 | 3.48 | 3.16 | 3.30 | 4.27 | 5.05 | |||
- Abbreviations: σθθ, compressive residual stress (MPa); r, compressive region distance (mm) from the hole bore.
The mid-thickness face of the hole does not produce any noticeable alteration, as shown in Figure 12 and Table 4. Table 4 also provides an outlook of the peak compressive residual stress and compressive region size for the straight-hole models with angular pulling, considering the high COF condition at μ = 0.1. It can also be noticed that the high COF value does not produce any meaningful variation in the compressive residual stress distribution and the compressive region size compared to the low COF condition.
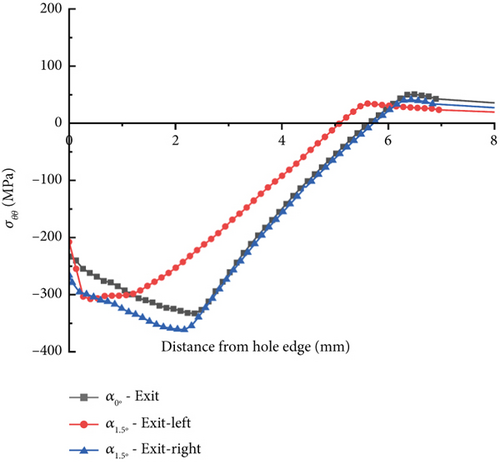
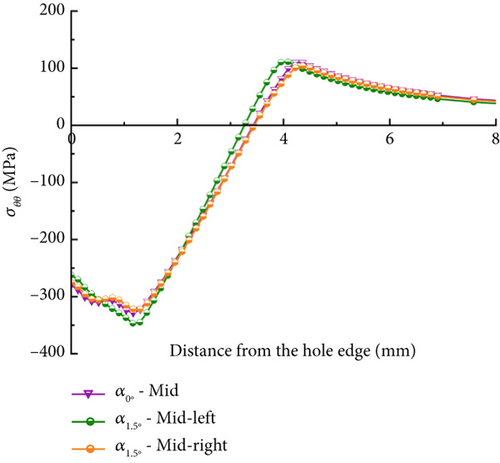
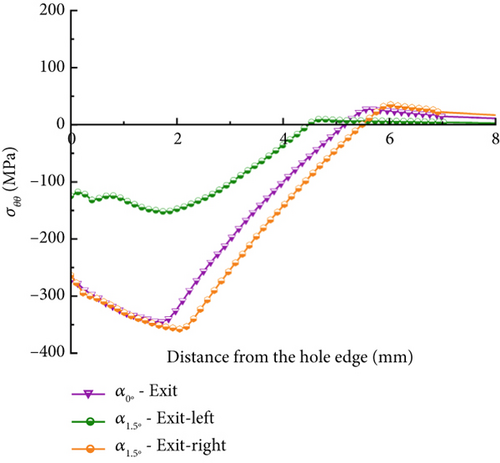
Figure 13 illustrates the circumferential residual stress distributions on the entry (Figure 13a), mid-thickness (Figure 13b), and exit faces (Figure 13c) of the surrounding hole when the mandrel’s pulling angles are α = 0° and α = 1.5° for the DL model, which possesses the smallest entry (ϕ = 7.59 mm) and the largest exit (ϕ = 7.68 mm) within the hole size tolerance. Table 5 displays the summary of the peak compressive residual stresses and compressive regions computed from Figure 13. The compressive residual stresses are reduced in both entry-right and exit-left faces when the mandrel pulling angle becomes 1.5°. The entry-right face of the angular model exhibits a 28% lower peak compressive residual stress, which is −103 MPa, and a 28% lower compressive region, which is 3.34 mm, compared to the corresponding collinear model. The exit-left face of the hole of the angular pulling model produces a peak σθθ of −152 MPa, which is approximately 56% lower than that generated by the collinear model. The reduction in the peak residual stress in the DL model is more significant than the DS model, indicating a combinatorial effect between the hole size variation and the pulling angle on the outcomes of the SSCE process.

| D | μ | α | Output parameters | Entry face | Mid-face | Exit face | |||
|---|---|---|---|---|---|---|---|---|---|
| Left | Right | Left | Right | Left | Right | ||||
| DL | μ = 0.05 | α = 0° | Peak σθθ | −142.17 | −328.59 | −344.92 | |||
| r | 4.62 | 3.42 | 5.16 | ||||||
| μ = 0.1 | Peak σθθ | −135.99 | −350.21 | −347.54 | |||||
| r | 4.36 | 3.30 | 4.89 | ||||||
| μ = 0.05 | α = 1.5° | Peak σθθ | −129.45 | −103.03 | −346.71 | −321.96 | −152.00 | −357.72 | |
| r | 4.54 | 3.34 | 3.28 | 3.42 | 4.53 | 5.49 | |||
| μ = 0.1 | Peak σθθ | −153.01 | −135.62 | −360.28 | −335.77 | −178.19 | −360.33 | ||
| r | 4.42 | 2.81 | 2.89 | 3.17 | 3.99 | 4.94 | |||
- Abbreviations: σθθ, compressive residual stress (MPa); r, compressive region distance (mm) from the hole bore.
In contrast, the angular model’s entry-left and exit-right faces show results comparable to those of the collinear model. Figure 13 and Table 5 also indicate that only the compressive zone at the entry-right face of the angular model is reduced to approximately 36% compared to the corresponding collinear model in the COF = 0.1 condition. However, no apparent considerable variation is produced by the mid-thickness face of the hole. Therefore, for DL models considering both COF conditions of 0.05 and 0.1, relatively lower expansion on the entry-right and exit-left faces of the hole may contribute to the lower compressive residual stress generation. The most significant compressive residual stress reduction occurs in the exit-left face of the hole at the pulling angle of 1.5° and the COF of 0.05, resulting in a 58% lower maximum compressive residual stress value over the exit-right face of the hole. The significantly reduced compressive residual stress at the hole’s exit can cause premature fatigue crack initiations on that site, causing a negative impact on the hole structure’s fatigue life.
At present, direct experimental validation of our results remains limited, and specific industry guidelines on acceptable residual stress asymmetry in cold-expanded holes are not readily available in open literature. However, previous studies [45] suggest that significant asymmetry in compressive residual stresses can influence fatigue performance, particularly in aerospace structures subjected to cyclic loading.
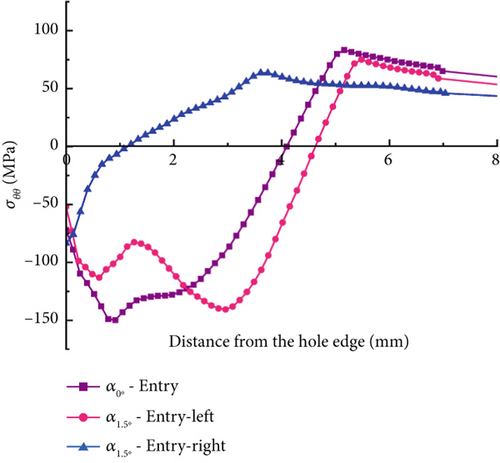
For the DH models, or the positively tapered hole models, the most significant variation between the left and right faces of the angular model was found in the hole entry, as shown in Figure 14. The entry-right face of the angular model results in a 44% lower peak compressive residual stress and a 71% lower compressive region than in the corresponding collinear model at μ = 0.05, as shown in Figure 14a. The peak compressive residual stress distribution and the compressive regions are summarized in Table 6 when the two pulling angles and the two COFs are used. Similar to the DL model, the angular model’s entry-right and exit-left faces have reduced compressive residual stresses due to insufficient radial expansion. In particular, similarly, for the COF of 0.1, the peak σθθ and compressive zone values on the entry-right face are also 64% and 72% reduced, respectively, when compared to the collinear or α = 0° models, as shown in Figure 14b. However, the entry-right and exit-left faces of the angular model show only 15%–19% reductions in the compressive zone values for both μ = 0.05 and μ = 0.1 models. The combination of negatively tapered hole and angled pulling resulted significantly unbalanced compressive residual stresses between left and right in the hole entry due to unmatched expansion. The lowered residual stresses in the hole entry-right of the negatively tapered hole can undesirably impact the fatigue life of the hole structure.
| D | μ | α | Output parameters | Entry face | Mid-face | Exit face | |||
|---|---|---|---|---|---|---|---|---|---|
| Left | Right | Left | Right | Left | Right | ||||
| DH | μ = 0.05 | α = 00` | Peak σθθ | −149.81 | −325.99 | −337.38 | |||
| r | 4.09 | 3.42 | 5.69 | ||||||
| μ = 0.1 | Peak σθθ | −149.49 | −342.66 | −340.85 | |||||
| r | 3.83 | 3.17 | 5.29 | ||||||
| μ = 0.05 | α = 1.50 | Peak σθθ | −140.64 | −83.49 | −343.68 | −321.99 | −310.29 | −355.42 | |
| r | 4.68 | 1.20 | 3.29 | 3.42 | 4.82 | 5.64 | |||
| μ = 0.1 | Peak σθθ | −141.90 | −53.24 | −358.50 | −334.94 | −340.81 | −360.09 | ||
| r | 4.29 | 1.07 | 3.03 | 3.17 | 4.27 | 5.07 | |||
- Abbreviations: σθθ, compressive residual stress (MPa); r, Compressive region distance (mm) from the hole bore.
4.2. Pulling Force Analysis
The force needed to pull the oversized mandrel through the hole is referred to as a pulling force in this study. Figure 15 depicts the pulling force progression over the mandrel displacement for the straight hole or the DS model at α = 0° and μ = 0.05. The pulling force curve can be segmented into four sections, correlating to the mandrel’s engagement with the hole [25]. A typical SSCE mandrel largely consists of three portions, including the 1st taper portion, the maximum diameter portion, and the 2nd taper portion. As shown in Figure 15, Region I produces negligible pulling force before the initial taper part of the mandrel interacts with the hole. The enlarged diameter of the mandrel’s first taper portion passes through the hole in Region II; consequently, the pulling force experiences rapid growth. Region III occurs when the flat maximum diameter portion of the mandrel gets pulled through the hole. When the flat section of the mandrel’s maximum diameter portion is fully engaged near the hole center, the pulling force is considered at its peak. The pulling force then reduces rapidly to almost zero when the second taper portion of the mandrel starts to enter the hole in Region IV. Out of the four regions, we focus on the peak force in Region III due to its potential impact on mandrel tool wear and hole damage.
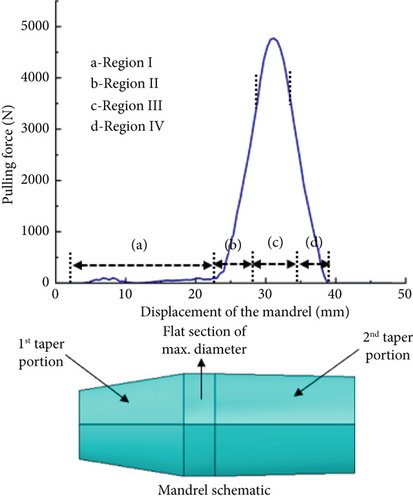
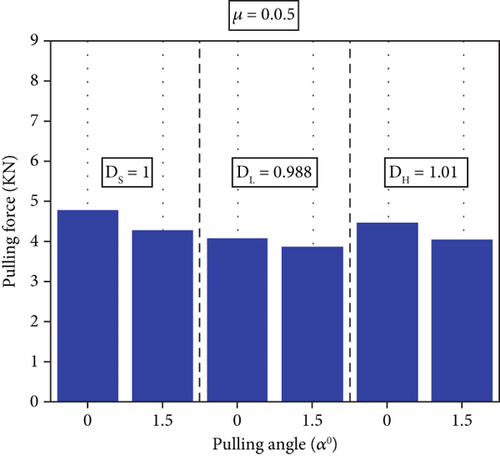
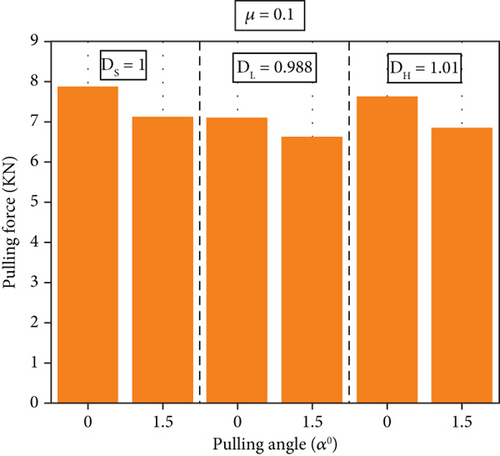
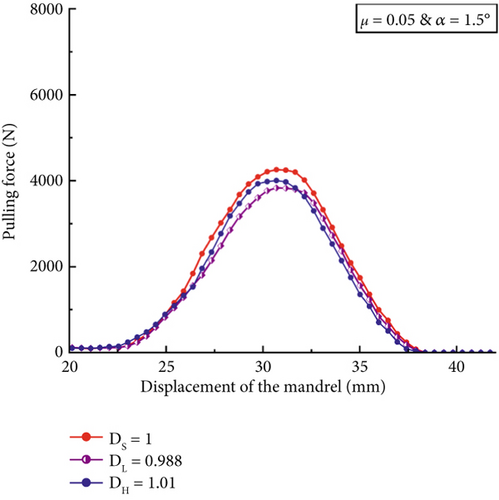
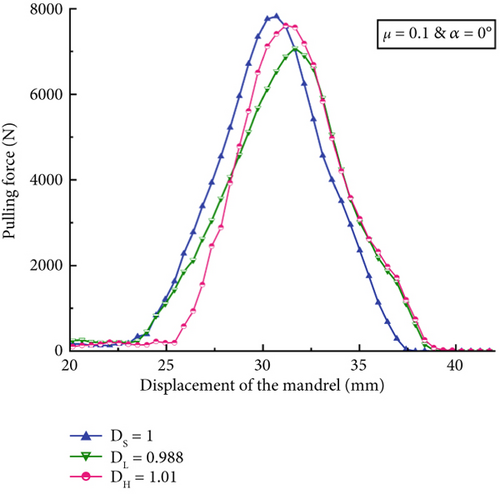
Figure 16 provides a summary of the peak pulling forces of all 12 models. The high COF at 0.1, as shown in Figure 16b, produces a 62%–74% greater maximum pulling force than the low COF at 0.05, which is presented in Figure 16a. This phenomenon is related to the effect when the mandrel needs to overcome increased friction force due to an increased COF. The pulling angle also affects the peak pulling force magnitudes at the same hole model. For example, the DS models of angular pulling (α = 1.5°) yield 4255 N at μ = 0.05 and 7107 N at μ = 0.1, which are 11% and 9% lower than those from the collinear models at α = 0°. However, the DL models produce the lowest peak pulling forces regardless of the COF and pulling angle conditions when compared to the other two geometric variable models, which are DS and DH. The positively tapered hole results in less resistance to the mandrel when the mandrel travels toward the larger hole exit.
4.2.1. Effect of the Hole Diameter Variation Ratio
The effect of the hole diameter ratio on the pulling force progression when the two pulling angle (α) models are taken into consideration at the low COF condition or μ = 0.05 is shown in Figures 17a,b. As shown in Figure 17a, the mandrel contacts the hole surface at the same displacement for both the DS and DL models since both of these models have the same entry diameter (DEntry = 7.59 mm). On the other hand, because of the larger entry diameter (DEntry = 7.68 mm) in DH models, compared to the DS and DL models, the mandrel initiates contact with the hole bore surface at a longer distance traveled in the pulling direction. Following that, all the DS, DL, and DH models experienced an inclining trend in pulling force. The DH model’s pulling force rapidly grows due to the negatively tapered hole diameter towards the hole exit. In contrast, the pulling force slope of the DL model is the lowest due to the increasing hole diameter during the mandrel progression. The hole size variation impacted the peak pulling force, resulting in the highest at the DS model. The variation in pulling force profiles and peak magnitudes due to hole geometric variations can show that the in-process force signals can potentially indicate hole geometric variations when the pulling angle is collinear with the hole.
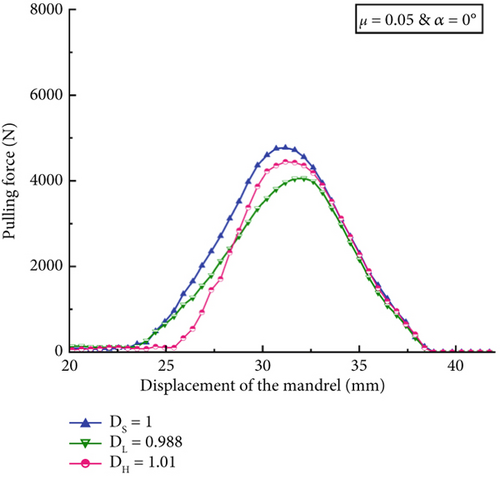

The inconsistent expansion percentages of the DL and DH models may result in lower peak pulling forces than those of the straight-hole model. In a previous study [25], it was established that the higher expansion percentages of the hole result in increased peak pulling force generation as it creates higher interference between the mandrel and the hole bore. Because a straight hole has a constant diameter on both the entry and exit sides, the expansion percentage for the DS models in this study is approximately 3.69%. For the DL models, the entry and exit of the hole provide different expansion percentages since the entry face is smaller in diameter (7.59 mm) than the exit face (7.68 mm). The DL models’ entry face experienced 3.69% expansion percentages as opposed to 2.47% expansion at the hole’s exit side. As a result, the DL models produced approximately 15% less peak pulling force than the DS model. Similarly, the DH model’s hole expansion begins at 2.47% at the entry face and gradually increases to 3.69% at the exit. Due to the reduced hole expansion, the DH model’s peak pulling force is approximately 7% lower than that of the straight-hole model. The reduced hole expansion influenced normal pressure caused by the oversized mandrel. The DS model produced an average normal pressure of 534 MPa for the μ = 0.05 condition; however, the DL and DH models yielded reduced average normal pressure values of 483 and 500 MPa, respectively, compared to the DS model. The reduced normal pressure values result in reduced pulling forces in the DL and DH models.
The key difference between DL and DH lies in the progression of expansion. In the DL case, the hole expands from the beginning as the mandrel moves through, allowing for a more extended relaxation period of plastic deformation, which results in a lower contact pressure and, subsequently, a lower pulling force. In contrast, the DH case, despite having a gradual interference fit, experiences a more constrained plastic relaxation due to the major expansion occurring later in the mandrel’s travel. This leads to a smaller reduction in pulling force compared to the DL case.
4.2.2. Effect of the COF
Figure 17c,d indicates that the pulling force magnitudes are increased with the high COF condition, μ = 0.1, regardless of hole geometry and pulling angle variations when compared with those at the low COF condition, μ = 0.05, in Figure 15a,b. At a higher COF, the oversized mandrel must overcome higher friction force when pulling through the hole bore surface at a given hole expansion. The overall trend of the pulling force progressions at the high COF condition in Figure 17c similarly follows the trend at the low COF condition in Figure 15a; however, the magnitude of pulling forces is approximately 62%–74% greater. The increasing pulling force with increasing the COF can be explained through Coulomb’s friction law. When the COF becomes double with the high COF condition, or μ = 0.1, compared to the lower COF condition (μ = 0.05), it is expected that the pulling force becomes double when the normal force is consistent. However, the peak pulling forces became only 1.62–1.74 times higher when the COF was doubled at the same hole geometry models. This can be due to the reduced normal pressure at an increasing COF. The collinear (α = 0°) models’ average normal pressure ranged from 483 to 534 MPa at the COF of 0.05, while they ranged from 443 to 478 MPa at the COF of 0.1. The reduction of normal pressures at the high COF condition was also found in the angular models.
4.2.3. Effect of the Pulling Angle
When the mandrel is pulled at a 1.5° angle, the pulling force curves over the mandrel displacement become relatively close for all three hole diameter variation models, as shown in Figure 17b,d. It can be noticed that the angular DS model produces the highest peak pulling force, whereas the angular DL model generates the lowest peak pulling force magnitude. This trend is the same between the low and high COF conditions. The peak pulling force magnitudes for angular DL and DH models at the COF of 0.05 are 3830 and 4001 N, respectively, while that of the angular DS model is 4255 N. This result can be linked to the corresponding normal pressure variation among the three hole diameter models. Considering the low COF condition, the average normal pressure produced by the angular pulling at 1.5° of the mandrel for DS, DL, and DH models is 507, 462, and 496 MPa, respectively, when the peak pulling force occurs. The tapered hole models with angular pulling produce lower average normal pressure than the straight hole model due to the variation of hole expansions. Lastly, Figure 17d depicts that marginally reduced peak pulling forces were obtained in the DL and DH models compared to the DS models at the high COF condition, which shows a similar trend at the low COF condition presented in Figure 15b. Therefore, pulling force magnitudes cannot be a good indicator of the process variations due to the pulling angle when the holes are tapered.
5. Conclusion
- 1.
Declining peak compressive residual stress and compressive region are observed when the hole models with the diameter variations within the hole tolerance. At a COF of 0.05, the hole size variations within the defined tolerance could result in a 20%–24% reduction in peak residual stresses in the hole entry due to reduced plastic deformation. In addition, increasing COF values from 0.05 to 0.1 do not yield significant variation in compressive residual distribution regardless of the geometric variation of the holes.
- 2.
Angular pulling of the mandrel produces asymmetric compressive residual stress distribution surrounding the hole; therefore, compressive residual distributions vary between the left and right sides of the hole. This outcome can be correlated to the asymmetric expansion percentages generated by the angular pulling at different faces of the hole. For the straight hole, the mandrel’s angular pulling at 1.5° produces up to 28% and 56% lower peak compressive residual stresses in the hole entry and exit, respectively.
- 3.
The effect of angular pulling on process outcomes is more significant when the holes are tapered. For the negatively tapered hole, the hole entry-right face experiences 64% and 72% lower peak compressive residual stress and compressive zone values, respectively. Angular pulling can negatively impact the fatigue life of the hole structure.
- 4.
The pulling force progression analysis revealed that increasing the COF results in higher peak pulling forces. A variation in the pulling force profiles was found at the entry and exit sides of the workpiece hole due to the mandrel’s interactions with the hole diameter variation. In addition, it was observed that both geometric variant and angular pulling models produce lower peak pulling force compared to the collinear models, irrespective of the COFs.
- 5.
The variations in residual stresses and compressive zones with the range of the SSCE process parameters could be attributed to the inconsistent expansion percentages at different faces of the hole bore surface and the variations of normal pressures that occurred when the oversized mandrel traveled. When a negatively tapered hole is pulled at 1.5° angle, it results in significantly lower and unbalanced compressive residual stresses in the hole entry, which may not produce the desired impact the fatigue life of the holed structure.
Disclosure
The work was not undertaken, funded, or in any way affiliated to Boeing or Rolls Royce, and that the work was not undertaken there.
Conflicts of Interest
The authors declare no conflicts of interest.
Funding
This research was supported by the Joint Center for Aerospace Technology Innovation (10.13039/100013119).
Acknowledgments
The authors greatly appreciate the financial support from the Joint Center for Aerospace Technology Innovation (JCATI) of Washington State, USA.
Open Research
Data Availability Statement
The data that support the findings of this study are available from the corresponding author upon reasonable request.


