Damage and Failure of Aeroengine Blades Under Small UAV Impacts
Abstract
Unmanned aerial vehicles (UAVs) may collide with vulnerable parts of other aircrafts, such as engine blades, causing accidents. The research on small UAV impact is limited. Besides, UAV impact with propeller and rotor blades is poorly understood. In this paper, a finite element (FE) model of a UAV with a weight of 4.78 kg, turbofan blades, propeller blades, and helicopter tail rotor blades was developed. The FE modelling was carried out by commercial software named LS-DYNA R13.1.0, which is one of the most advanced simulation tools for nonlinear dynamic structural analysis, mainly solving numerical simulations of collision and penetration problems. First, the UAV FE model was validated by comparing the simulation results against the experiments. Next, simulations were conducted to investigate the damage of the three blades under UAV impact with different heading angles. The damage type and effect of UAV’s heading angle were analyzed and identified. The simulation results indicated that the turbofan blades experienced the more severe damage, compared with the propeller blades and tail rotor blades. The head orientation of the UAV has a significant effect on the impact force of the three aircraft engine blades. In addition, certain parts of the UAV (e.g., battery) can produce significant damage to the blades. The research findings are helpful for the safety assessment of the UAV impact damages to different aircraft engines.
1. Introduction
Unmanned aerial vehicles (UAVs) are unmanned aircrafts, operated by remote control or programs. According to survey data, the global market size for UAVs in 2020 is about $22.5 billion [1]. It is further predicted that by 2030, the market for UAVs will be worth $92 billion [2]. The vast use of UAVs has brought aviation safety issues, increasing the collision risk between UAVs and aircrafts. In March 2020, a drone was reported at Frankfurt Airport, leading to the airport closure [3]. Although many countries have progressively introduced policies to limit the flight area of drones [4] and drones have been equipped with intelligent obstacle avoidance systems [5], there are still risks of UAV–aircraft collision, due to UAV losing control or flying without authorization. Aeroengine blades are one of the most vulnerable components of aircrafts. Material or structural failure of aeroengine blades may cause severe aeronautical accidents. Therefore, aeroengine blade–UAV collisions are worth more attention.
There have been several previous studies that investigate UAV’s impact on aircraft engines. Using finite element (FE) modelling and computational fluid dynamics methods, Liu et al. [6–8] studied the UAV impact on turbo engine and confirmed that both the weight and the orientation of the UAV have a significant effect on the damage of turbofan blades. Zhang et al. [9, 10] summarized the FE methods for UAV impact and conducted high-resolution simulation for UAV impact. The FE model was validated against experiments. The ingestion of UAV into high-bypass engines and the caused damages have been studied both numerically and experimentally [11–13]. It has been shown that UAV impact is a significant threat to jet engines [13]. One study compared the damage of turbofan blades, produced by bird and UAV impact, and the results show that UAV produced more severe damage to the turbofan blades than bird with the same weight [14]. Moreover, the authors suggested that UAV with only 1.345 kg can threaten the aircraft safety. Wang, Wu, and Yang [15] used FE modelling and found that the rotating velocity of turbofan has a larger effect on the blade damage than the UAV impact velocity. The thrust loss of commercial aircraft engine due to UAV impact was investigated with computational fluid dynamics [16, 17]. The results showed that the more than 50% of thrust may be lost due to the UAV impact. Beh, Dhaker, and Chow [18] modeled the impact of lightweight UAVs on commercial jet engine fan blades and showed that the damage of the blade’s leading edge was mainly induced by the UAV component with large weight and stiffness.
Despite these previous studies on UAV impact with aircraft engines, several gaps exist. Firstly, most previous studies focused on the collision safety of light UAV with a weight of less than 4 kg. According to the standards of the Civil Aviation Administration of China [19], UAVs with a weight of less than 4 kg are classified as light or micro-UAV, and 4–15 kg weight UAVs are classified as small drones. Research on the aircraft collision with small UAV is very limited. Secondly, previous research mainly investigated UAV impact on turbofan blades. UAV damage to propeller blades and rotor blades remains unknown. Thirdly, the effect of UAV’s heading orientation on blade damage is not fully understood.
The aim of this study is to address some of these gaps by investigating a 4.78-kg UAV impact against three different engine blades: turbofan, propeller, and rotor blades. The FE models of the UAV and the three blades were developed. The UAV FE model was validated against experimental results. Then, simulations of the UAV–blades impact under three UAV heading orientations were conducted. The results showed that the turbofan blades experienced more severe damage than the propeller and rotor blades. The UAV heading orientation did not have a significant effect on the blade damage. The research findings are helpful for the safety assessment of the UAV impact damages to different aircraft engines.
2. Materials and Methods
2.1. Computational Modelling Methods
2.1.1. UAV FE Model
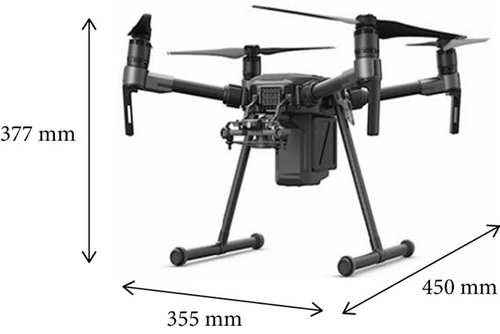
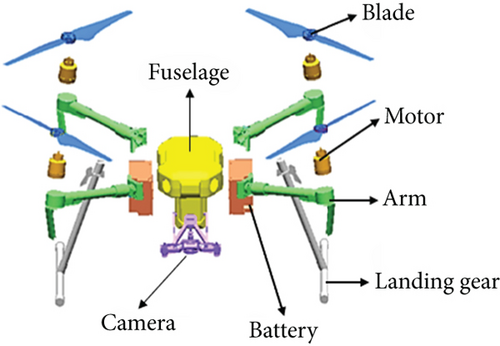
The UAV model studied in this paper is DJI JingWei M200 as shown in Figure 1(a), which is a typical small civilian quadrotor UAV with a total weight of 4.78 kg. Its size is 355 mm × 377 mm × 450 mm as shown in Figure 1(b). The M200 UAV can be divided into seven major parts: body, blade, motor, arm, battery, camera, and landing gear, as shown in Figure 1(b).
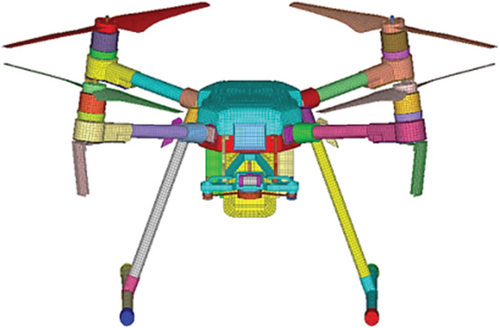
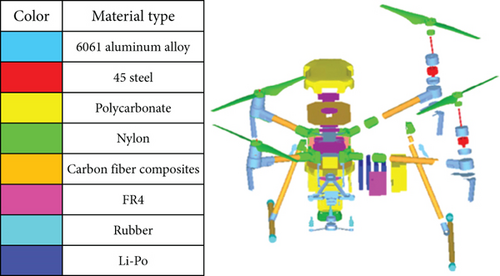
The UAV FE model was developed based on its geometric model as shown in Figure 1(c), which was established by laser scanning. As most of the structure is thin-walled tubes and shells, these parts were modeled with two-dimensional shell elements. The battery, camera, motor, and other components were modeled as solid elements. The element sizes were set to 3.5 mm for shell and 5.5 mm for solid, as recommended in previous studies [6, 12, 20]. The UAV FE model contains 110,085 elements. The UAV is mainly made of four materials: metal, plastic, composite material, and rubber. The specific material classification and distribution are shown in Figure 2(d).
The Johnson–Cook (J–C) constitutive material model was used to simulate the polycarbonate (PC), 45 steel, and 6061 aluminum alloy. This model has been widely used to simulate large deformations of metals and other materials [21]. The J–C model comprehensively considers the effects of material strain strength, strain rate, and temperature softening effects on materials. In addition, the J–C model comprehensively considers the effects of stress triaxiality, strain rate, and temperature effects on failure behavior. The material parameters are listed in Table 1, taken from literature [22–25].
| Material type | Density (kg/m3) | Young’s modulus (GPa) | Poisson’s ratio | A (GPa) | B (GPa) | n | C |
|---|---|---|---|---|---|---|---|
| PC | 1220 | 2.59 | 0.3 | 0.080 | 0.075 | 2.00 | 0.052 |
| 45 steel | 7800 | 200 | 0.3 | 0.507 | 0.320 | 0.28 | 0.064 |
| 6061-T6 | 2704 | 71 | 0.3 | 0.324 | 0.114 | 0.42 | 0.002 |
Nylon material was simulated using elastoplastic constitutive model, and the material parameters were derived from previous literature [26, 27], listed in Table 2. The glass fiber and carbon fiber material model and parameters are taken from [28] listed in Table 2. The material parameters of carbon fiber composites are taken from [29] listed in Table 2. The rubber material was modeled with the Mooney–Rivlin constitutive model, as suggested by Zhang, Li, and Ma [30]. For the cell material, with reference to previous studies [31–33], the cell part was replaced with an equivalent model, and it was modeled with the elastoplastic material model listed in Table 2.
| Nylon [26, 27] | |||
|---|---|---|---|
| Density (kg/m3) | Young’s modulus (GPa) | Poisson’s ratio | Yield stress (GPa) |
| 1100 | 4.5 | 0.375 | 0.080 |
| Battery [31–33] | |||
|---|---|---|---|
| Density (kg/m3) | Young’s modulus (GPa) | Poisson’s ratio | Yield stress (GPa) |
| 1755 | 0.5 | 0.01 | 0.240 |
| Epoxy resin [28] | ||||||||||
|---|---|---|---|---|---|---|---|---|---|---|
| Density (kg/m3) | Young’s modulus (GPa) | Compressive strength (GPa) | Tensile strength (GPa) | Shear modulus (GPa) | Shear strength (GPa) | Poisson’s ratio | ||||
| X | Y | X | Y | X | Y | XY | XZ/YZ | |||
| 1850 | 18.83 | 19.26 | 0.365 | 0.3 | 0.233 | 0.31 | 8.275 | 0.152 | 0.136 | 0.118 |
| Carbon fiber [29] | |||||||
|---|---|---|---|---|---|---|---|
| Young’s modulus (GPa) | Compressive strength (GPa) | Tensile strength (GPa) | Shear modulus (GPa) | Poisson’s ratio | |||
| X | Y | X | Y | X | Y | XY | YX |
| 160 | 9 | 1.45 | 0.18 | 2.1 | 0.087 | 7.62 | 0.0118 |
2.1.2. FE Model of the Three Aeroengine Blades
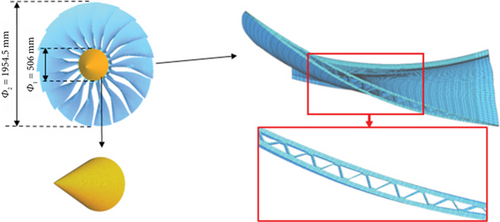
The FE model of the turbofan blades consists of 18 fan blades and a simplified spinner, as shown in Figure 2(a). The spinner is for connecting the 18 fan blades and will not be impacted with the UAV. Therefore, the spinner was modeled by using shell elements with a mesh size of 10 mm and mesh number of 5645. The fan blade was modeled by using hexahedral elements with a mesh size of 9 mm and mesh number of 55625 for each blade. The internal structure of the fan blade is a cavity-reinforced core structure as shown in Figure 2(a). The outer diameter of the turbofan is 1954.5 mm, and the spinner diameter is 506 mm.
The material of the fan blade part is TC4 titanium alloy, which has excellent heat resistance, strength, plasticity, toughness, formability, weldability, corrosion resistance, and biocompatibility. It was modeled with the J–C model, and the material parameters are shown in Table 3. The spinner was modeled as a rigid body with the material of TC4 titanium alloy.
| Materials | Density (kg/m3) | Young’s modulus (GPa) | Poisson’s ratio | A (GPa) | B (GPa) | n | c | εf |
|---|---|---|---|---|---|---|---|---|
| TC4 titanium alloy | 4.400e − 06 | 121 | 0.3 | 0.98 | 0.7 | 0.48 | 0.028 | 0.2 |
| LY11 aluminum alloy | 2.277e − 06 | 59.7 | 0.3 | 0.265 | 0.229 | 0.786 | 0.02004 | 0.2 |
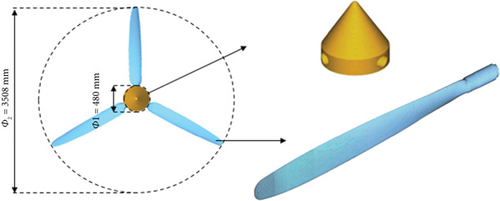
The FE model of the propeller blades is composed of three propeller blades and a simplified spinner as shown in Figure 2(b). The spinner is for connecting three propeller blades and will not be impacted with the UAV. Therefore, the spinner was modeled by using shell elements with a mesh size of 10 mm and mesh number of 12,574. The geometric characteristics of the propeller blades are complex and are modeled with tetrahedral elements to ensure mesh quality. The general size of the propeller blade mesh is 3 mm, and the number of meshes of each blade is 432,346. The outer diameter of the propeller blade is 3508 mm, and the spinner diameter is 480 mm.
The material of the propeller blade is LY11 aluminum alloy. Again, the J–C constitutive was used to model the material behavior. The material parameters are listed in Table 3. The spinner was modeled as the rigid body with the same material.
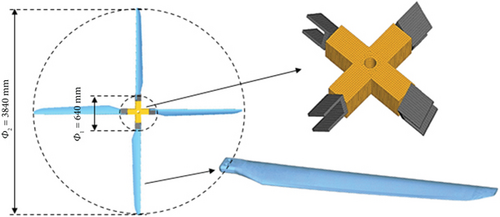
The FE model of the rotor blades consists of four rotor blades and a simplified hub, as shown in Figure 2(c). The hub was modeled by using hexahedral elements with a mesh size of 10 mm and mesh number of 10,882. The rotor blade was also modeled by using hexahedral elements with a mesh size of 2 mm and mesh number of 424,481 for each blade. The internal structure of the fan blade is a cavity-reinforced core structure as shown in Figure 2(a). The outer diameter of the turbofan is 3840 mm, and the hub diameter is 640 mm.
The material of the propeller blade is LY11 aluminum alloy. Again, the J–C constitutive is used to model the material behavior. The material parameters are listed in Table 3. The hub was also modeled with the rigid body with the same material as it will not be impacted by the UAV.
2.1.3. FE Modelling Method
The simulation details are listed in Table 4. First, the free-falling and drop weight impact tests were conducted, which were detailed and introduced in Section 2.2, and the test results were used for validating the UAV FE model. Then, the UAV impact against the three aeroengine blades was simulated, each with three UAV heading orientations. The detailed definition of UAV heading orientation and the simulation conditions are shown in Figures 3(a), 3(b), and 3(c).
| Number | Condition | Heading orientation | Velocity (m/s) | Rotational velocity (rpm) |
|---|---|---|---|---|
| 1 | Free-falling impact (for validation) | — | 10.27 | — |
| 2 | Drop weight impact (for validation) | — | 5.2 | — |
| 3 | Turbofan blade impact | 0° | 100 | 3500 |
| 4 | 45° | 100 | 3500 | |
| 5 | 90° | 100 | 3500 | |
| 6 | Propeller blade impact | 0° | 100 | 1500 |
| 7 | 45° | 100 | 1500 | |
| 8 | 90° | 100 | 1500 | |
| 9 | Rotor blade impact | 0° | 20 | 1500 |
| 10 | 45° | 20 | 1500 | |
| 11 | 90° | 20 | 1500 | |


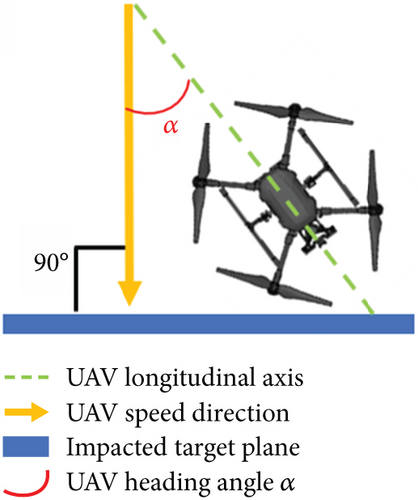
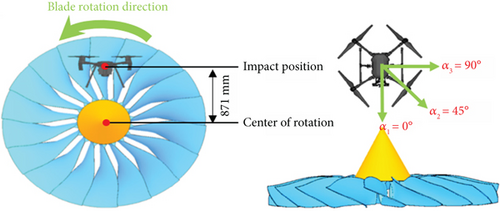
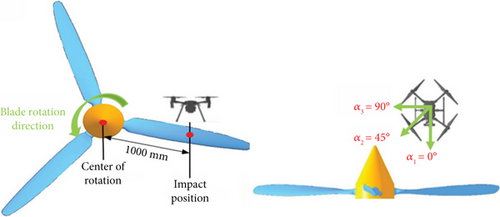
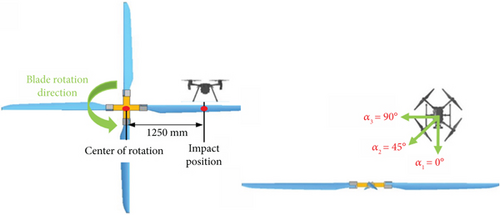
The numerical simulation of UAV impacted with blades includes two types of contact. The first one is the contact between the UAV and blades, in which the point-surface contact type was used. To complete the definition of contact, it is necessary to determine the master contact surface and the slave contact surface. In general, there are the following guidelines for the definition of master and slave surface: (1) The surface with a relatively large area is the master surface; (2) the surface with the relatively greater stiffness is the master surface; (3) the surface with the relatively coarse grid is generally the master surface. According to this criterion, the UAV is defined as the slave contact surface, and the blades are defined as the master contact surface. The second one is the self-contact between the various components of UAV.
In the free-falling simulation, the size of the impacted platform is 1200 ∗1200 mm, which was modeled by using quadrilateral shell with a mesh size of 6 mm. The material is modeled as rigid body with a density of 7800 kg/m3, an elastic modulus of 210 GPa, and Poisson’s ratio of 0.3.
In the drop weight impacting simulation, the size of the drop weight is 400 ∗400 ∗70 mm, modeled by using hexahedral elements with a mesh size of 4 mm. It was also modeled by using rigid body with an elastic modulus of 210 GPa and Poisson’s ratio of 0.3, and the total weight is 45.75 kg. The geometry and weight are consistent with those in the test. The size of the impact platform is 400 mm ∗400 mm ∗30 mm, and it was modeled by using hexahedral elements with a mesh size of 4 mm, which is the same as the platform size in the test.
2.2. Validation Experiments
One free-falling and one drop weight impact tests with the UAV were conducted, which were used to validate the UAV FE model. The setup of the free-falling impact test is shown in Figure 4(a). The UAV was suspended by the lifting equipment in a horizontal position directly above the table and released at a predetermined height. The test was captured by a high-speed video camera at 2000 frames-per-second (FPS) rate.
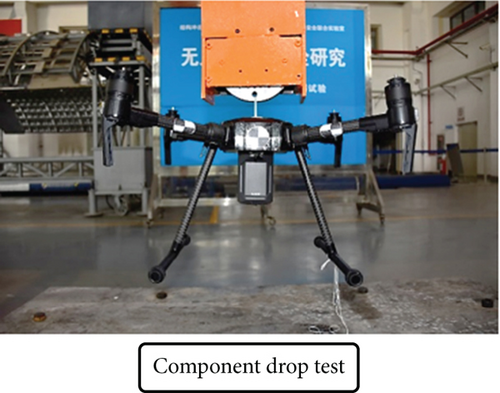
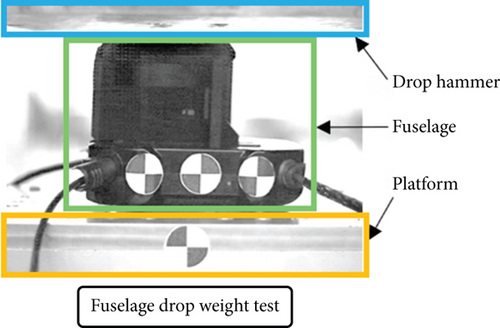
The drop weight impact test focused on the UAV’s main body, which is the most complicated part of the UAV. As shown in Figure 4(b), the UAV’s main body parts were placed on the surface of the platform, and the weight is dropped at a predetermined height directly above the body. The test was also captured by a high-speed video camera at 2000 FPS. In addition, the impact force on the platform was measured with a mechanical sensor installed under the platform.
3. Results and Discussion
3.1. UAV FE Model Validation
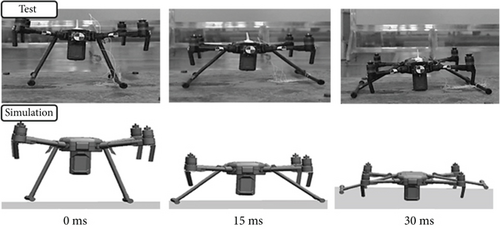
For the free-falling impact test, time zero was set as the time when the component was in contact with the platform. The simulation results were compared with the test results at 0, 15, and 30 ms, shown in Figure 5(a). At 0 ms, the UAV began to contact with the platform. At 15 ms, the two landing gears had obvious relative slip on the platform, and the overall posture of the UAV remained almost horizontal. At 30 ms, the impact between the UAV and the platform almost ended, and the UAV began to rebound; no obvious deformation or failure of the main body was observed. During the entire falling process, the simulation results were in good agreement with the test, which verified the accuracy of the UAV FE model.
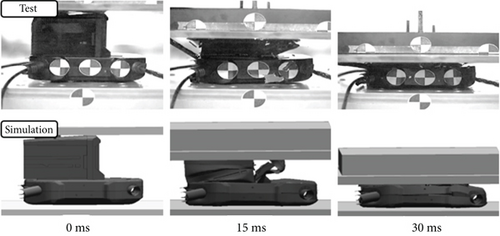

For the drop weight impact test, the time was also set and the results were compared at 0, 15, and 30 ms. As shown in Figure 5(b), at 0 ms, the drop weight began to contact with the body; at 15 ms, the drop weight crushed the battery holder containing the battery, and this holder was plastically deformed and severely damaged; at 30 ms, the battery holder was completely crushed by the drop weight, and at this time, it was in contact with the part loaded with internal circuit components. After 30 ms, the impact process between the drop weight and the main body finished and the drop weight began to rebound. The part housing the internal circuit components did not show obvious damage. Overall, the simulation results agreed with the test results very well, which verified the UAV FE model.
Figure 5(c) shows the body damage morphology obtained from the test and simulation after the drop weight test. It can be observed that the structure of the battery holder was destroyed, while the part carrying the internal circuit did not have obvious damage. The failure modes of the test results and the simulation calculation results are consistent, which proves the similarity between the two and verifies the rationality of the numerical model from the perspective of damage morphology.
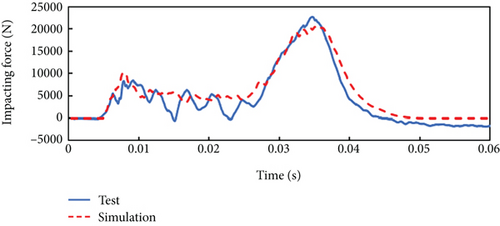
The impact force of the UAV from the test and simulation is shown in Figure 5(d). The impact force from the test and the simulation agrees very well. More specifically, the predicted peak impact force from the simulation (2.03 kN) is very close to the measured one from the test (2.25 kN). In addition, the timings and oscillation of the impact force data are very similar. These further verified the UAV FE model.
3.2. Damage of the Turbofan Blades Under UAV Impact
Figure 6 shows the results of the turbofan blades impacting with UAV at a heading orientation of 0°. The impact process lasted less than 10 ms as shown in Figure 6(a). At 3.25 ms, UAV’s main body started contact with the fan blades, which finished at 6.75 ms. After the impact, the UAV was totally crushed. The turbofan experienced significant deformation, gaps, and other damages at seven blades as shown in Figure 6(b). Three blades had significant material failure and plastic deformation, which was mainly produced by the UAV’s motor and battery. The material plastic deformation and failure were mainly located at the leading edge of the blades.

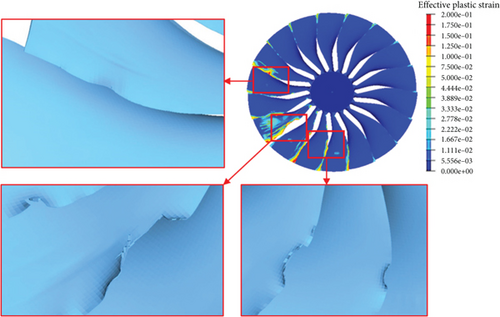
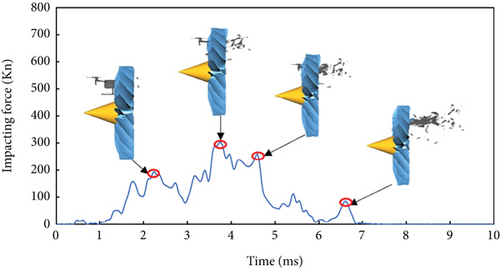
Figure 6(c) shows the impact force time history during the impact. There are four peaks at 2.3, 3.7, 4.6, and 6.5 ms. At 2.3 ms, the UAV’s two frontal motors were cut by the turbofan blades, producing peak impact force of 181 kN. At 3.7 ms, there is the second peak (293.8 kN), resulting from the collision between the blades and the UAV’s main body. The next peak (249.7 kN) was observed at 4.6 ms, which was due to the fan blades cutting the battery components. Finally, at 6.5 ms, the two rear motors impacted with the fan blades, generating the last peak force of 83.6 kN. Among the four peaks of impact forces, the main body and battery created more damage to the blades than the motors.
3.3. Damage of the Propeller Fan Blades Under UAV Impact
Figure 7 shows the results of the propeller blades impacting with UAV at heading orientation of 0°. The impact process lasted less than 4 ms as shown in Figure 7(a). At 1.3 ms, the UAV’s main body started contact with the fan blades, which finished at 2.6 ms. After the impact, the UAV’s main body was cut into half by the blade. The propeller blades showed limited deformation and damages as shown in Figure 7(b). The damage was localized to the leading edge of the blade, which was mainly produced by the battery of the UAV. The blade showed significant elastic deformation, which absorbed some amount of the impact energy and reduced the damage.

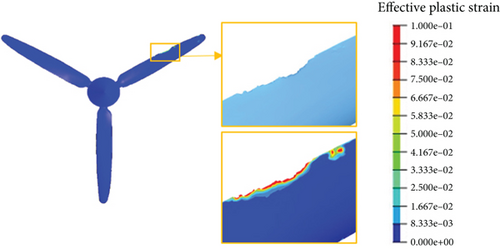
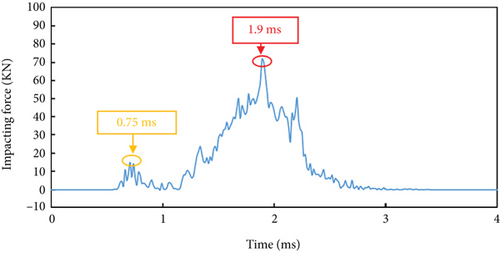

Figure 7(c) shows the impact force time history during the impact. There are two peaks at 0.75 ms and 1.9 ms, respectively. At 0.75 ms, the peak impact force is 14 kN, corresponding to the moment when the UAV’s landing gear was cut by the propeller blades as shown in Figure 7(d). The second peak (71.7 kN) occurs at 1.9 ms, resulting from the collision between the battery and propeller blade as shown in Figure 7(d). The second peak is much higher than the first peak, which indicates that the battery created more damage to the blade than the landing gear.
3.4. Damage of the Rotor Blades Under UAV Impact
Figure 8 shows the results of the rotor blades impacting with UAV at heading orientation of 0°. At 8.3 ms, one rotor blade completed the impact with the UAV, and the UAV was seriously damaged. At 16.6 ms, the UAV already disintegrated, and the second rotor blade started contact with the UAV debris. At 25 ms, the entire impact process between the UAV and rotor blades finished. During the impact, two rotor blades collided with the UAV. The UAV was totally crushed, but the two rotor blades only showed slight deformation without material failure as shown in Figure 8(b). Compared with turbofan blades and propeller blades, the UAV produced lower damage to the rotor blades. Only one blade had plastic deformation on the leading edge at the root of the blade. As the rotor blade had relatively larger thickness, the blade did not show any material failure. Besides, the elastic deformation of the blade was minimal.

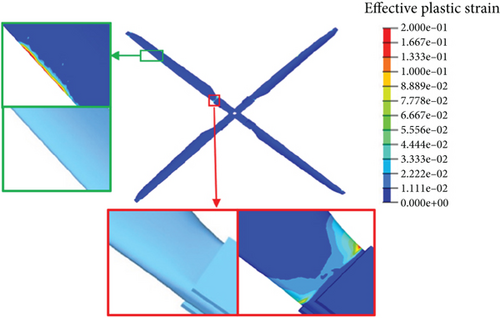
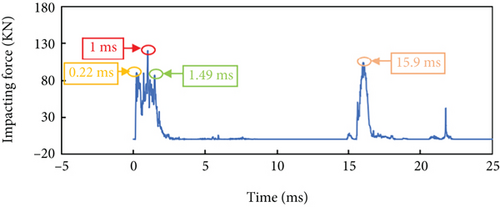
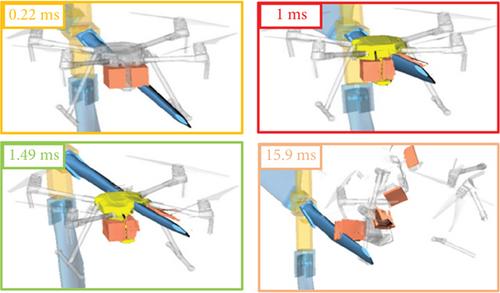
Figure 8(c) shows the impact force time history during the impact. The four peaks occur at 0.22, 1, 1.49, and 15.9 ms as shown in Figure 8(d). At 0.22 ms, the peak impact force is 89 kN, corresponding to the moment when the first blade impacted the battery. The second peak (120 kN) happened at 1 ms when the first blade contacted the battery and the fuselage. The third peak is 86.5 kN at 1.48 ms, produced by the first blade impacting the fuselage. The last peak is 102 kN, which occurred at 16 ms. This corresponds to the moment when the second blade is impacted with the battery. Among the four peaks of impact forces, the components and fuselage created more damage to the blades than other parts.
3.5. Effect of UAV’s Heading Orientation on Blade Damage
Figure 9(a) shows the damage of turbofan blades under the three different heading orientation angles: 0°, 45°, and 90°. With the increase of heading orientation angle, the blades experienced more damages. When the heading angle is greater than or equal to 45°, the number of seriously damaged blades increases significantly. This is mainly because the UAV’s battery is mounted on the rear fuselage. When the heading angle of the drone is less than 45°, the fan blades will first contact with the camera and part of the fuselage, which have less mass. Therefore, this mitigates the subsequent impacts. However, when the heading angle is greater than or equal to 45°, the fan blades directly impacted with the battery, which has more mass and can create higher impact forces to the turbofan blades. The total number of damaged fan blades is not affected by the heading orientation of the UAV. The debris after the impact is affected by the centrifugal force of the fan blade, which tends to spread out by the turbofan blades. Figure 9(b) shows the comparison of impact forces from the three heading angles. The peak impact force ranges between 293 and 375 kN. The largest peak occurs when the heading angle is 90°, and all the peaks were caused by the cutting and impact between the fan blades and the UAV battery, motor, and other components. Overall, the UAV’s heading orientation significantly affects the damage of the fan blades. The fundamental reason is that under such higher heading angles (45° and 90°), the battery is more likely to directly contact the fan blades, which creates more severe damage to the fan blades.


For the propeller blades, only one blade impacted with the UAV and created limited damage. Figure 10(a) shows the blade damage under the three heading orientation angles. The three heading angles produced similar damage to the blade. There is no significant effect of UAV heading angle on the propeller blade damage. The impact force ranged from 71 to 107 kN among different heading orientations as shown in Figure 10(b). The 90° heading angle produced the highest peak. The impact force histories follow similar shape and trend. The impact force peaks are all produced by the blade cutting the UAV’s battery. Overall, the heading orientation has limited effect on the damage of the propeller blades, but it affects the peak of the impact force.


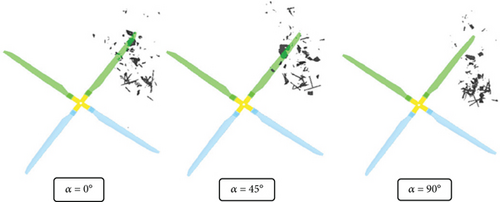
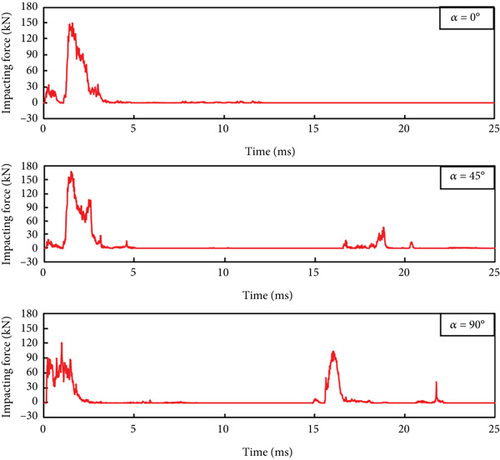
Figure 11(a) shows the rotor blade damage under the three heading orientation angles. Under all the three heading angles, two rotor blades impacted with the UAV, resulting in similar damage to the rotor blades. The impact force of the rotor blades varies between 120 and 167 kN as shown in Figure 11(b). The largest peak occurs when the heading angle is 45°. The impact force histories are similar among the three heading angles. All the peaks were caused by the rotor blades cutting the UAV battery and fuselage. In addition, there is a second peak for the 45° and 90° heading angle case, which happened between 15 and 20 ms. This is produced by the impact between the second rotor blade and UAV’s battery fragments. Overall, the damage of the rotor blades is not significantly affected by the UAV heading orientation. However, the heading orientation affects the peak of the impact force.
4. Conclusions
- 1.
The simulation results were in good agreement with the corresponding UAV impact test results, which validated the UAV FE model. Therefore, the UAV FE model can be used for subsequent simulations.
- 2.
The process of the UAV hitting the blades of the turbofan engine is a full-contact impact. After the impact, the drone is cut into pieces by the fan blades. The heading orientation of the UAV affects the impact load and material damage of the turbofan blades.
- 3.
The process of the UAV impacting with the three-blade propeller and the four-blade helicopter tail rotor is nonsufficient contact impact. The impact load and material damage of these two types of blades in the impact are mainly determined by the specific parts of the UAV that the blades impact with. The heading orientation of the UAV affects the impact load, but not the material damage of the blades.
- 4.
The UAV heading orientation has minimal effect on the damage of the three blades. Compared with the propeller and rotor blades, the turbofan blades are more sensitive to UAV head orientation.
Conflicts of Interest
The authors declare no conflicts of interest.
Funding
The study has not been funded.
Open Research
Data Availability Statement
The numerical data used to support the findings of this study are available from the corresponding author upon request.


